Loading ...
Loading ...
Loading ...
19
1
Before You Begin
Camera Displays
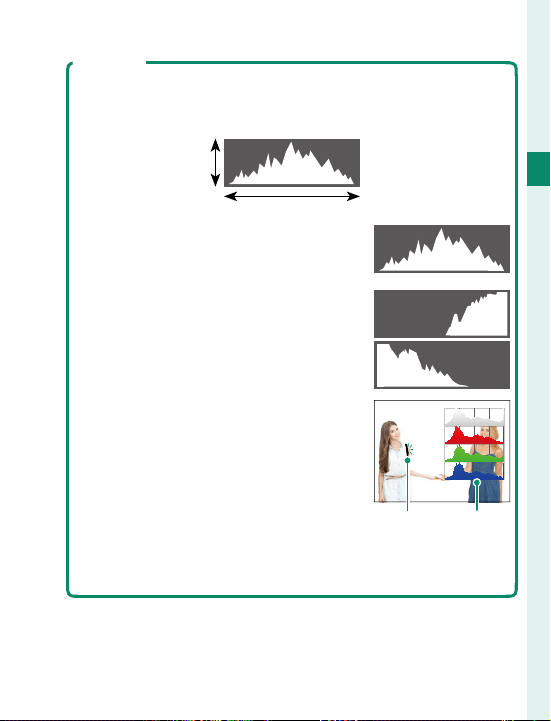
Histograms
Histograms show the distribution of tones in the image.
Brightness is shown by the horizontal axis, the number of pix-
els by the vertical axis.
Number of
pixels
Shadows Highlights
Pixel brightness
•
Optimal exposure: Pixels are distributed
in an even curve throughout the tone
range.
•
Overexposed: Pixels are clustered on the
right side of the graph.
•
Underexposed: Pixels are clustered on the
left side of the graph.
To view separate RGB histograms and a
display showing areas of the frame that
will be overexposed at current settings
superimposed on the view through the
lens, press the function button to which
HISTOGRAM is assigned (
P
226,
254).
A
Overexposed areas blink
B
RGB histograms
AB
Loading ...
Loading ...
Loading ...