Loading ...
Loading ...
Loading ...
Chapter 17: Activities 316
• You can graph the functions again by turning the functions off and then turning them back on
on the Y= editor or by using the FuncOFF and FuncON commands on the home screen.
Finding the Area between Curves
Problem
Find the area of the region bounded by:
Procedure
1. Press z. Select the default mode settings.
2. Press p. Set the viewing window.
3. Press o. Turn off all functions and stat plots. Enter the upper and lower functions.
Y1=300Xà(X
2
+625)
Y2=3cos(.1X)
4. Press y / 5 to select 5:Intersect. The graph is displayed. Select a first curve, second
curve, and guess for the intersection toward the left side of the display. The solution is
displayed, and the value of
X at the intersection, which is the lower limit of the integral, is
stored in
Ans and X.
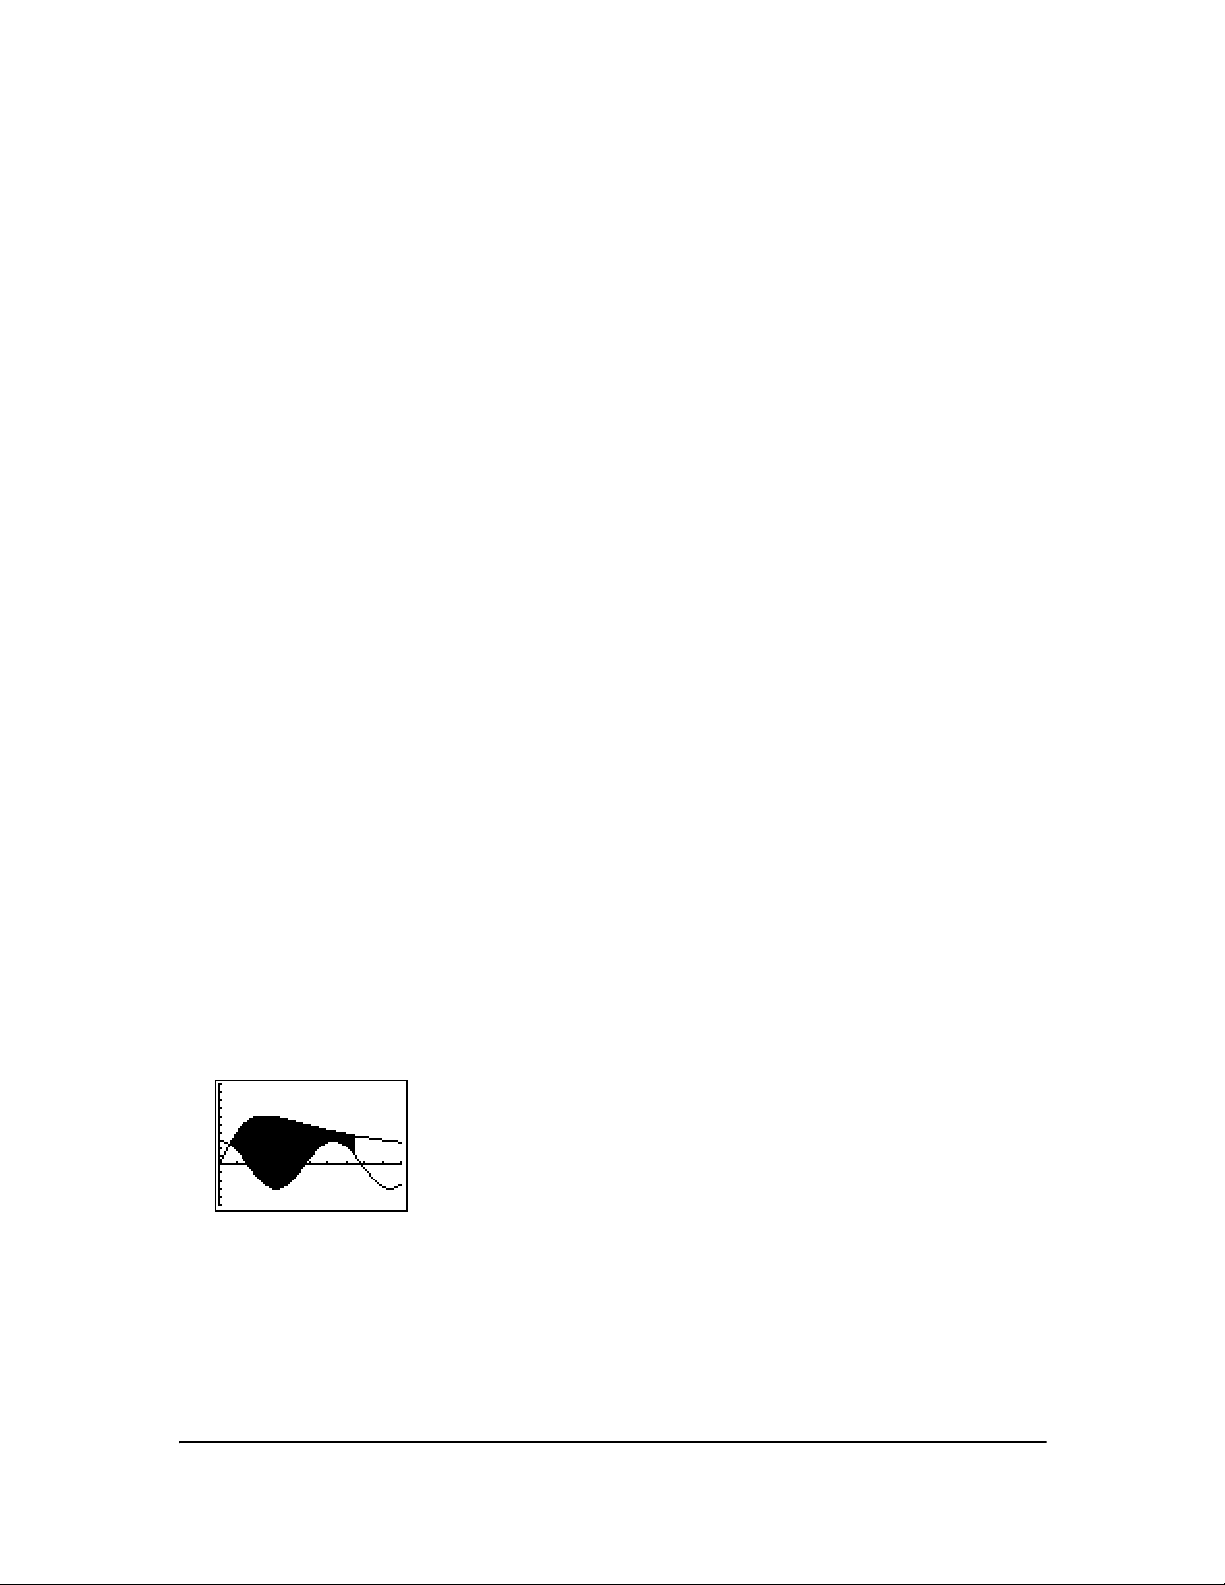
5. Press y 5 to go to the home screen. Press y < 7 and use Shade( to see the area
graphically.
Shade(Y2,Y1,Ans,75)
6. Press y 5 to return to the home screen. Enter the expression to evaluate the integral for
the shaded region.
fnInt(Y1NY2,X,Ans,75)
The area is 325.839962.
f(x)
g(x)
x
=
=
=
300x/ (x
2
+ 625)
3cos(.1x)
75
Xmin=0
Xmax=100
Xscl=10
Ymin=L5
Ymax=10
Yscl=1
Xres=1
Loading ...
Loading ...
Loading ...