Loading ...
Loading ...
Loading ...
Chapter 17: Activities 313
3. Press y 5 to return to the home screen, and then store 2.9 to K.
4. Press p. Set the window variables.
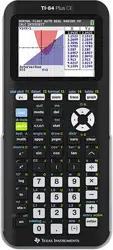
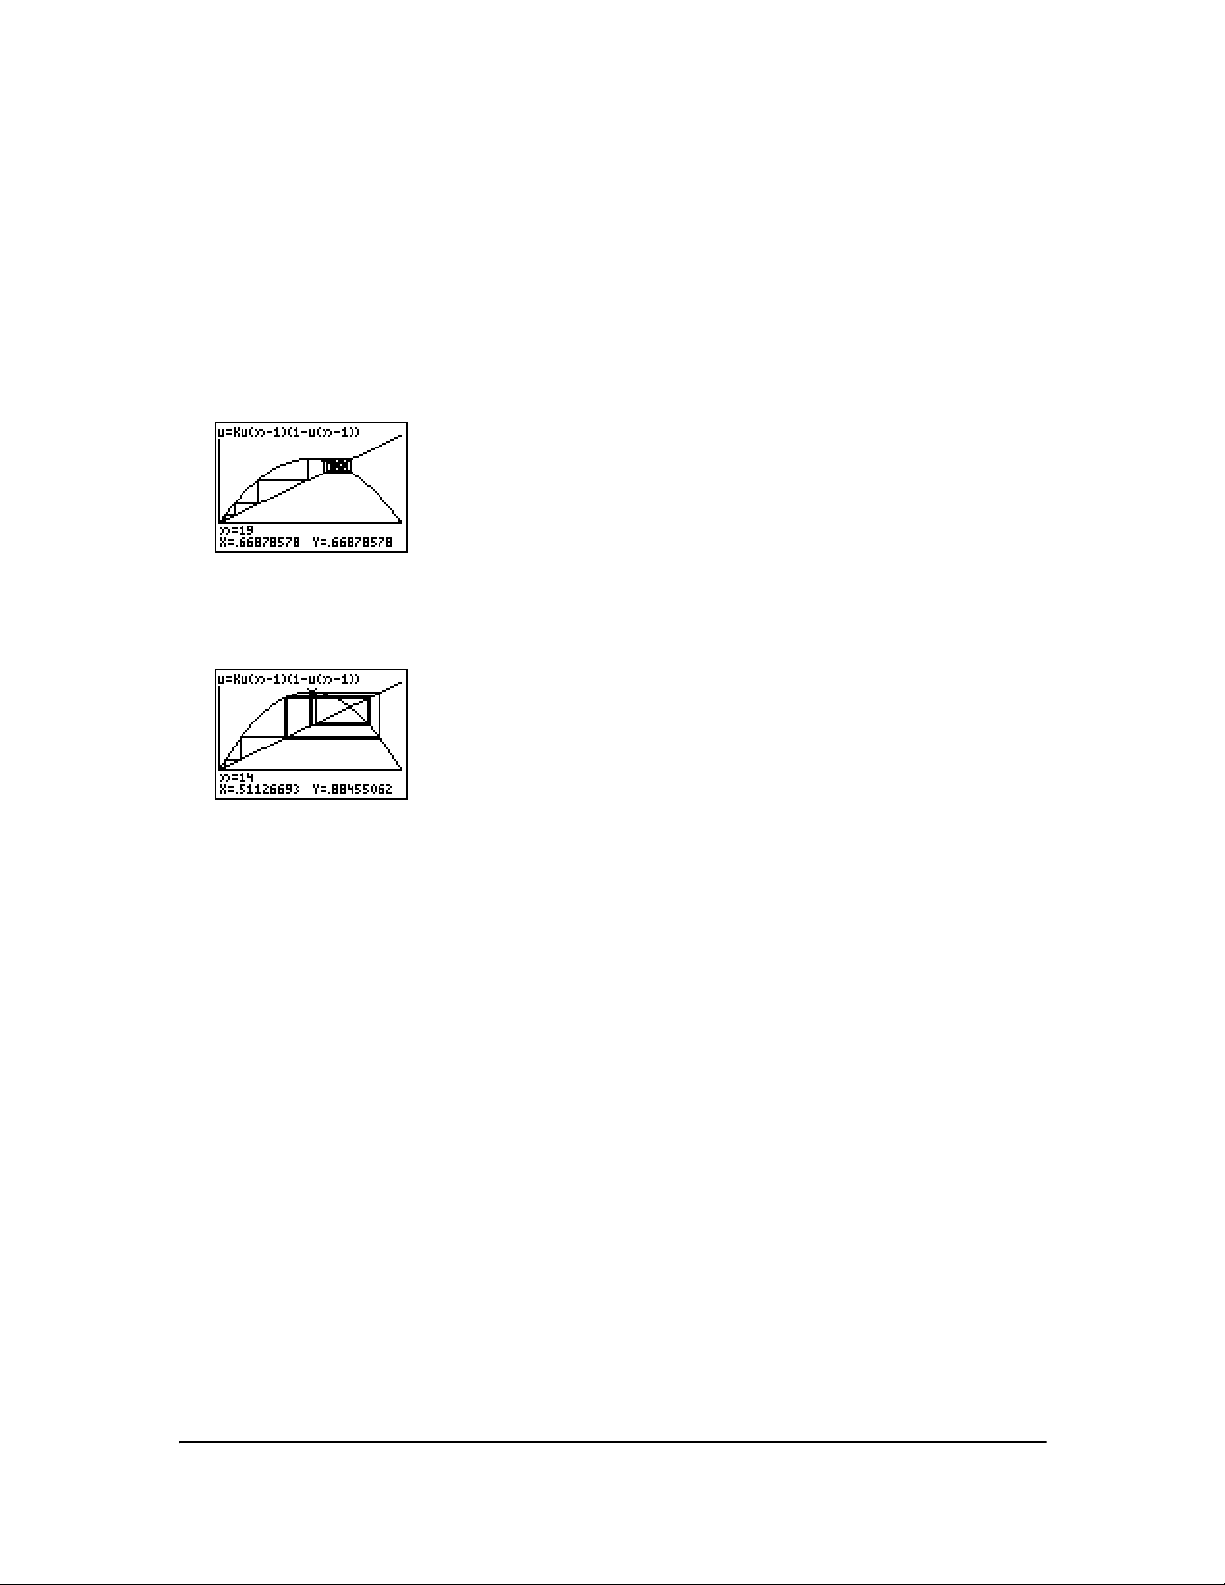
5. Press r to display the graph, and then press ~ to trace the cobweb. This is a cobweb
with one attractor.
6. Change K to 3.44 and trace the graph to show a cobweb with two attractors.
7. Change K to 3.54 and trace the graph to show a cobweb with four attractors.
Using a Program to Guess the Coefficients
Setting Up the Program
This program graphs the function A sin(BX) with random integer coefficients between 1 and 10.
Try to guess the coefficients and graph your guess as C sin(DX). The program continues until your
guess is correct.
Note: This program changes the graph window and graph styles. After you run the program, you
can change individual settings as needed or you can press y L
7 2 2 to return to default
settings.
Programs typically do not restore your settings in MODE, Y=, WINDOW and other locations that
were used by the program. This is dependent on who created the program.
Program
nMin=0
nMax=10
PlotStart=1
PlotStep=1
Xmin=0
Xmax=1
Xscl=1
Ymin=
M.26
Ymax=1.1
Yscl=1
PROGRAM:GUESS
:PlotsOff :Func
:FnOff :Radian
:ClrHome
Loading ...
Loading ...
Loading ...