Loading ...
Loading ...
Loading ...
Chapter 9: Split Screen 141
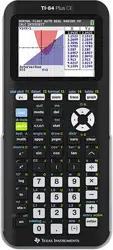
Using TRACE in G-T Mode
As you press | or ~ to move the trace cursor along a graph in the split screen’s left half in
G-T
mode, the table on the right half automatically scrolls to match the current cursor values. If more
than one graph or plot is active, you can press } or † to select a different graph or plot.
Note: When you trace in Par graphing mode, both components of an equation (XnT and YnT) are
displayed in the two columns of the table. As you trace, the current value of the independent
variable
T is displayed on the graph.
Full Screens in G-T Mode
All screens other than the graph and the table are displayed as full screens in
G-T split-screen
mode.
To return to the
G-T split screen from a full screen when in G-T mode, press any key or key
combination that displays the graph or the table.
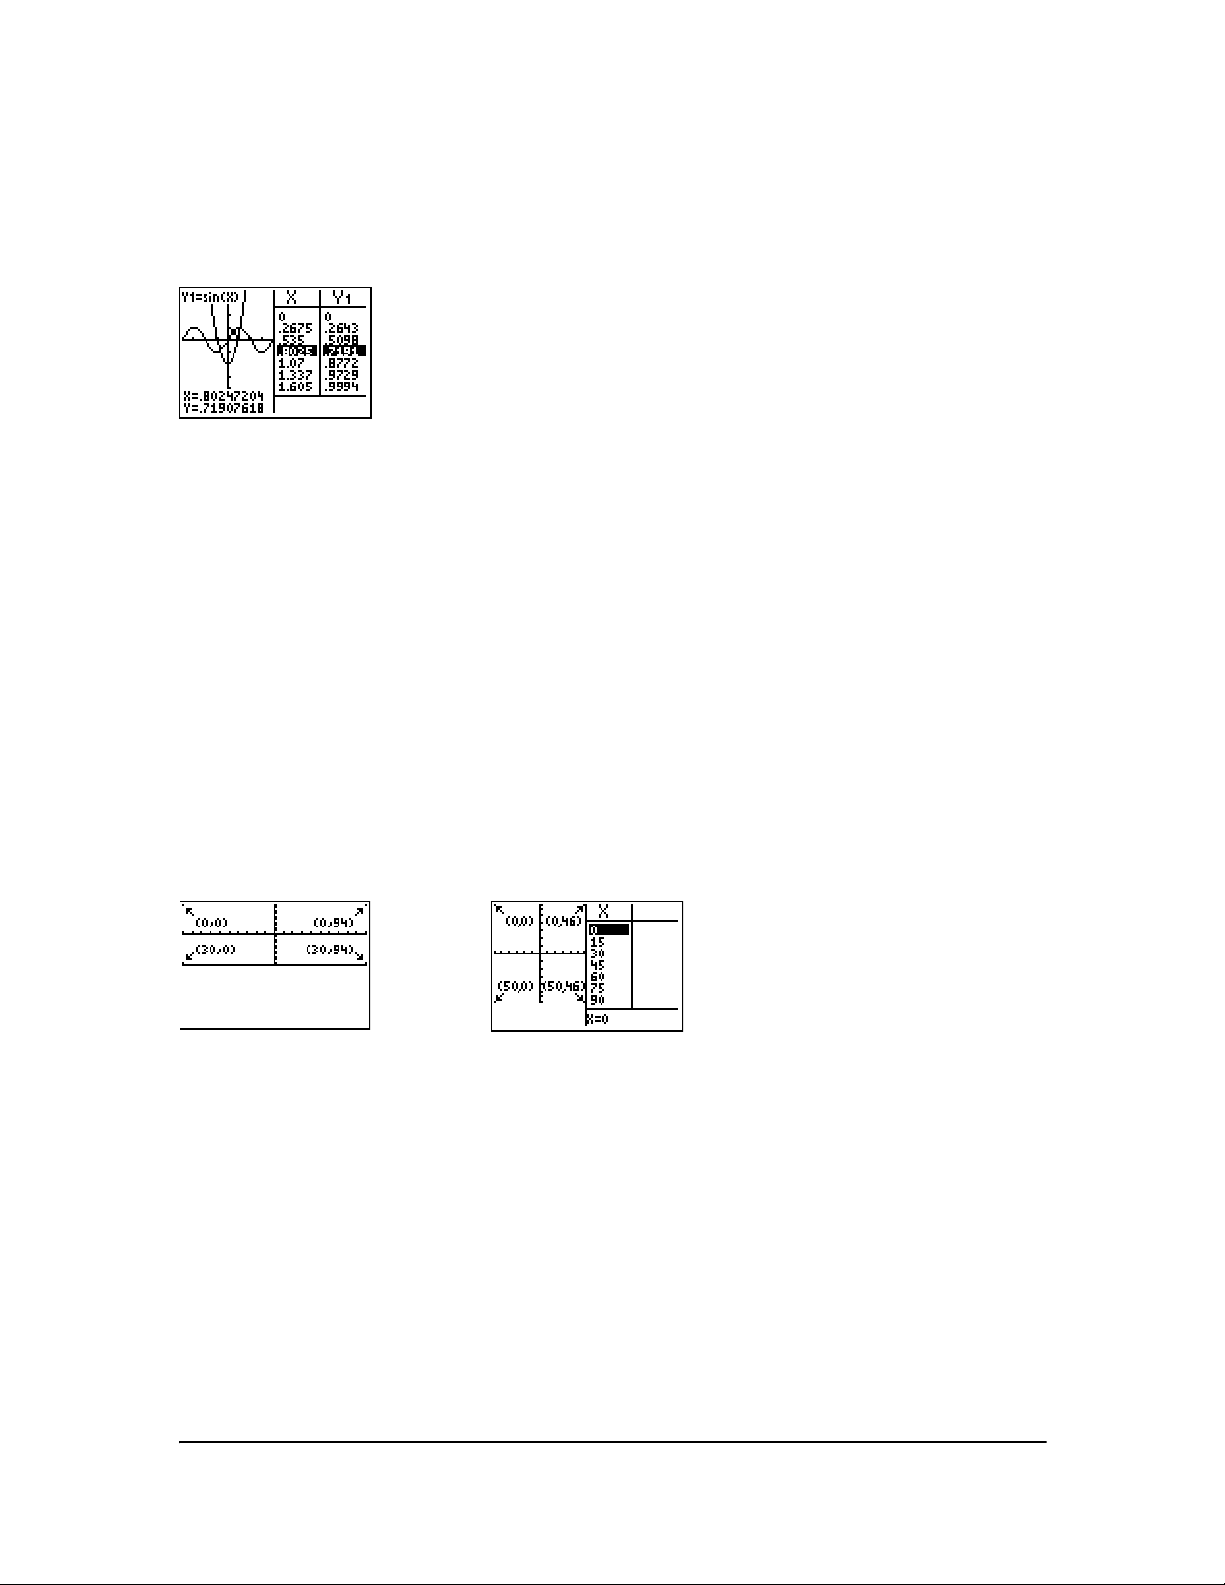
TI-84 Plus Pixels in Horiz and G-T Modes
TI-84 Plus Pixels in Horiz and G-T Modes
Note: Each set of numbers in parentheses above represents the row and column of a corner pixel,
which is turned on.
DRAW POINTS Menu Pixel Instructions
For
Pxl-On(, Pxl-Off(, Pxl-Change(, and pxl-Test(:
•In
Horiz mode, row must be {30; column must be {94.
•In
G-T mode, row must be {50; column must be {46.
Pxl-On(row,column)
Loading ...
Loading ...
Loading ...