Loading ...
Loading ...
Loading ...
Chapter 6: Sequence Graphing 102
Chapter 6:
Sequence Graphing
Getting Started: Forest and Trees
Note: Getting Started is a fast-paced introduction. Read the chapter for details.
A small forest of 4,000 trees is under a new forestry plan. Each year 20 percent of the trees will be
harvested and 1,000 new trees will be planted. Will the forest eventually disappear? Will the forest
size stabilize? If so, in how many years and with how many trees?
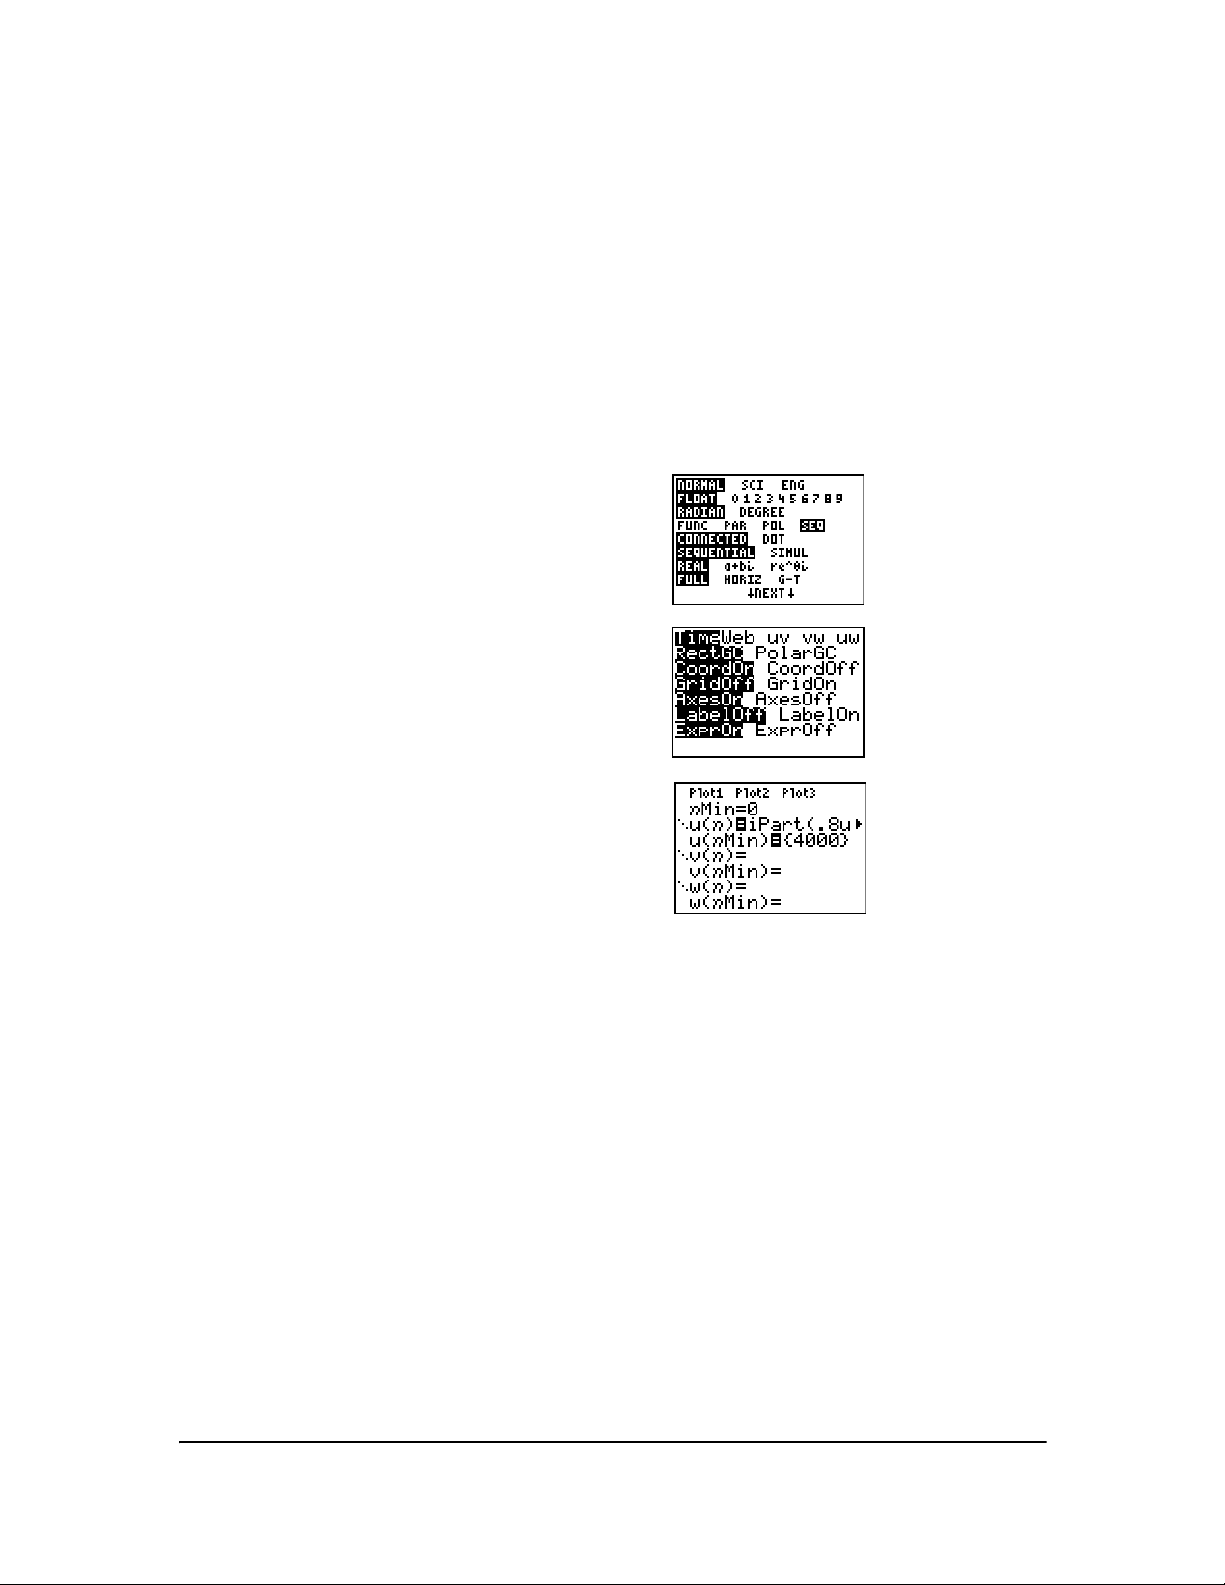
1. Press z. Press † † † ~ ~ ~ Í to select
Seq graphing mode.
2. Press y . and select
Time axes format
and
ExprOn format if necessary.
3. Press o. If the graph-style icon is not ç (dot),
press | |, press Í until ç is displayed, and
then press ~ ~.
4. Press ~
3 to select iPart( (integer part)
because only whole trees are harvested. After
each annual harvest, 80 percent (.80) of the trees
remain.
Press Ë
8 y [u] £ „ ¹ 1 ¤ to define the
number of trees after each harvest. Press Ã
1000
¤ to define the new trees. Press †
4000 to define
the number of trees at the beginning of the
program.
Note: Be sure to press y [u], not t [U]. [u] is
the second function of the ¬
key.
5. Press p
0 to set nMin=0. Press † 50 to set
nMax=50. nMin and nMax evaluate forest size over
50 years. Set the other window variables.
PlotStart=1 Xmin=0 Ymin=0
PlotStep=1 Xmax=50 Ymax=6000
Xscl=10 Yscl=1000
Loading ...
Loading ...
Loading ...