Loading ...
Loading ...
Loading ...

Chapter 11: Lists 172
Using Select( to Select Data Points from a Plot
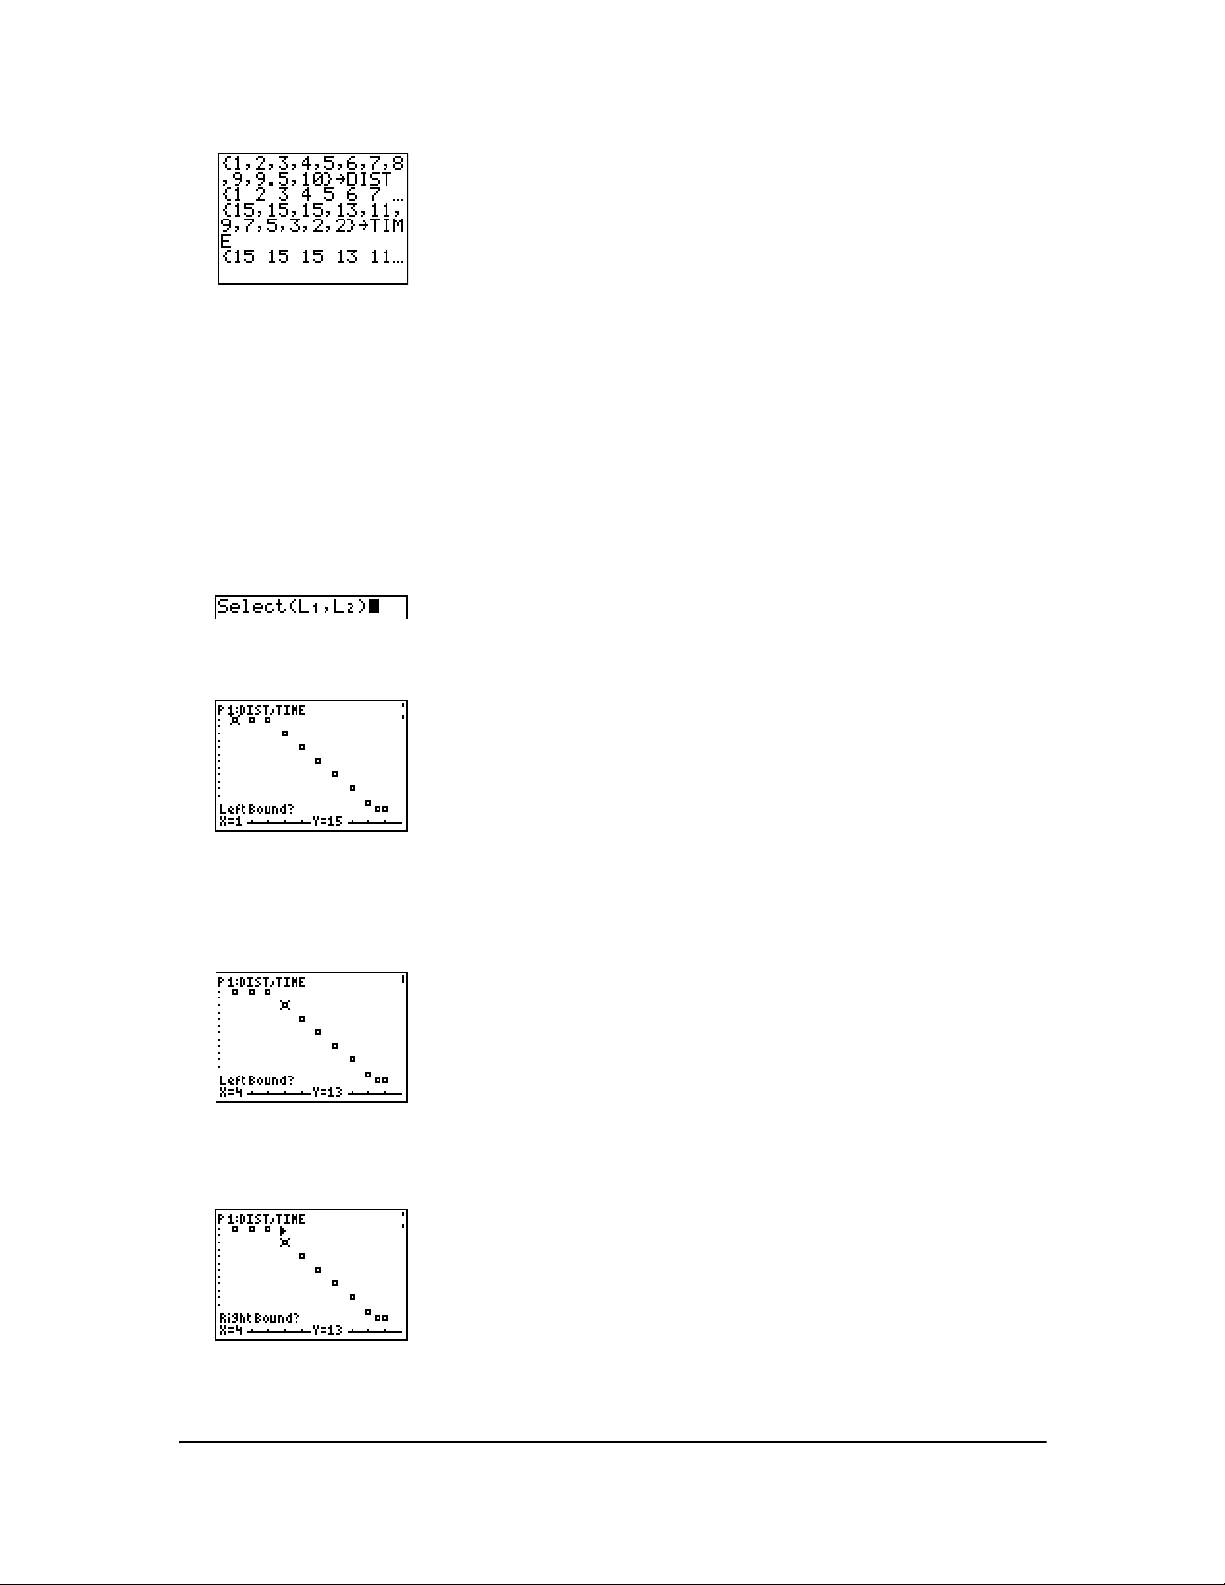
To select data points from a scatter plot or xyLine plot, follow these steps.
1. Press y 9 ~ 8 to select 8:Select( from the LIST OPS menu. Select( is pasted to the home
screen.
2. Enter xlistname, press ¢, enter ylistname, and then press ¤ to designate list names into which
you want the selected data to be stored.
3. Press Í. The graph screen is displayed with Left Bound? in the bottom-left corner.
4. Press } or † (if more than one stat plot is selected) to move the cursor onto the stat plot from
which you want to select data points.
5. Press | and ~ to move the cursor to the stat plot data point that you want as the left bound.
6. Press Í. A 4 indicator on the graph screen shows the left bound. Right Bound? is
displayed in the bottom-left corner.
Classic
Loading ...
Loading ...
Loading ...
