Loading ...
Loading ...
Loading ...
Chapter 12: Statistics 200
Each element in
freqlist must be ‚ 0, and at least one element must be > 0.
Noninteger
freqlist elements are valid. This is useful when entering frequencies expressed as
percentages or parts that add up to 1. However, if
freqlist contains noninteger frequencies, Sx and
Sy are undefined; values are not displayed for Sx and Sy in the statistical results.
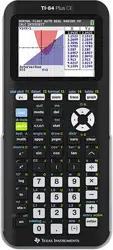
1-Var Stats
1-Var Stats (one-variable statistics) analyzes data with one measured variable. Each element in
freqlist is the frequency of occurrence for each corresponding data point in Xlistname. freqlist
elements must be real numbers > 0.
1-Var Stats [Xlistname,freqlist]
2-Var Stats
2-Var Stats (two-variable statistics) analyzes paired data. Xlistname is the independent variable.
Ylistname is the dependent variable. Each element in freqlist is the frequency of occurrence for each
data pair (
Xlistname,Ylistname).
2-Var Stats [Xlistname,Ylistname,freqlist]
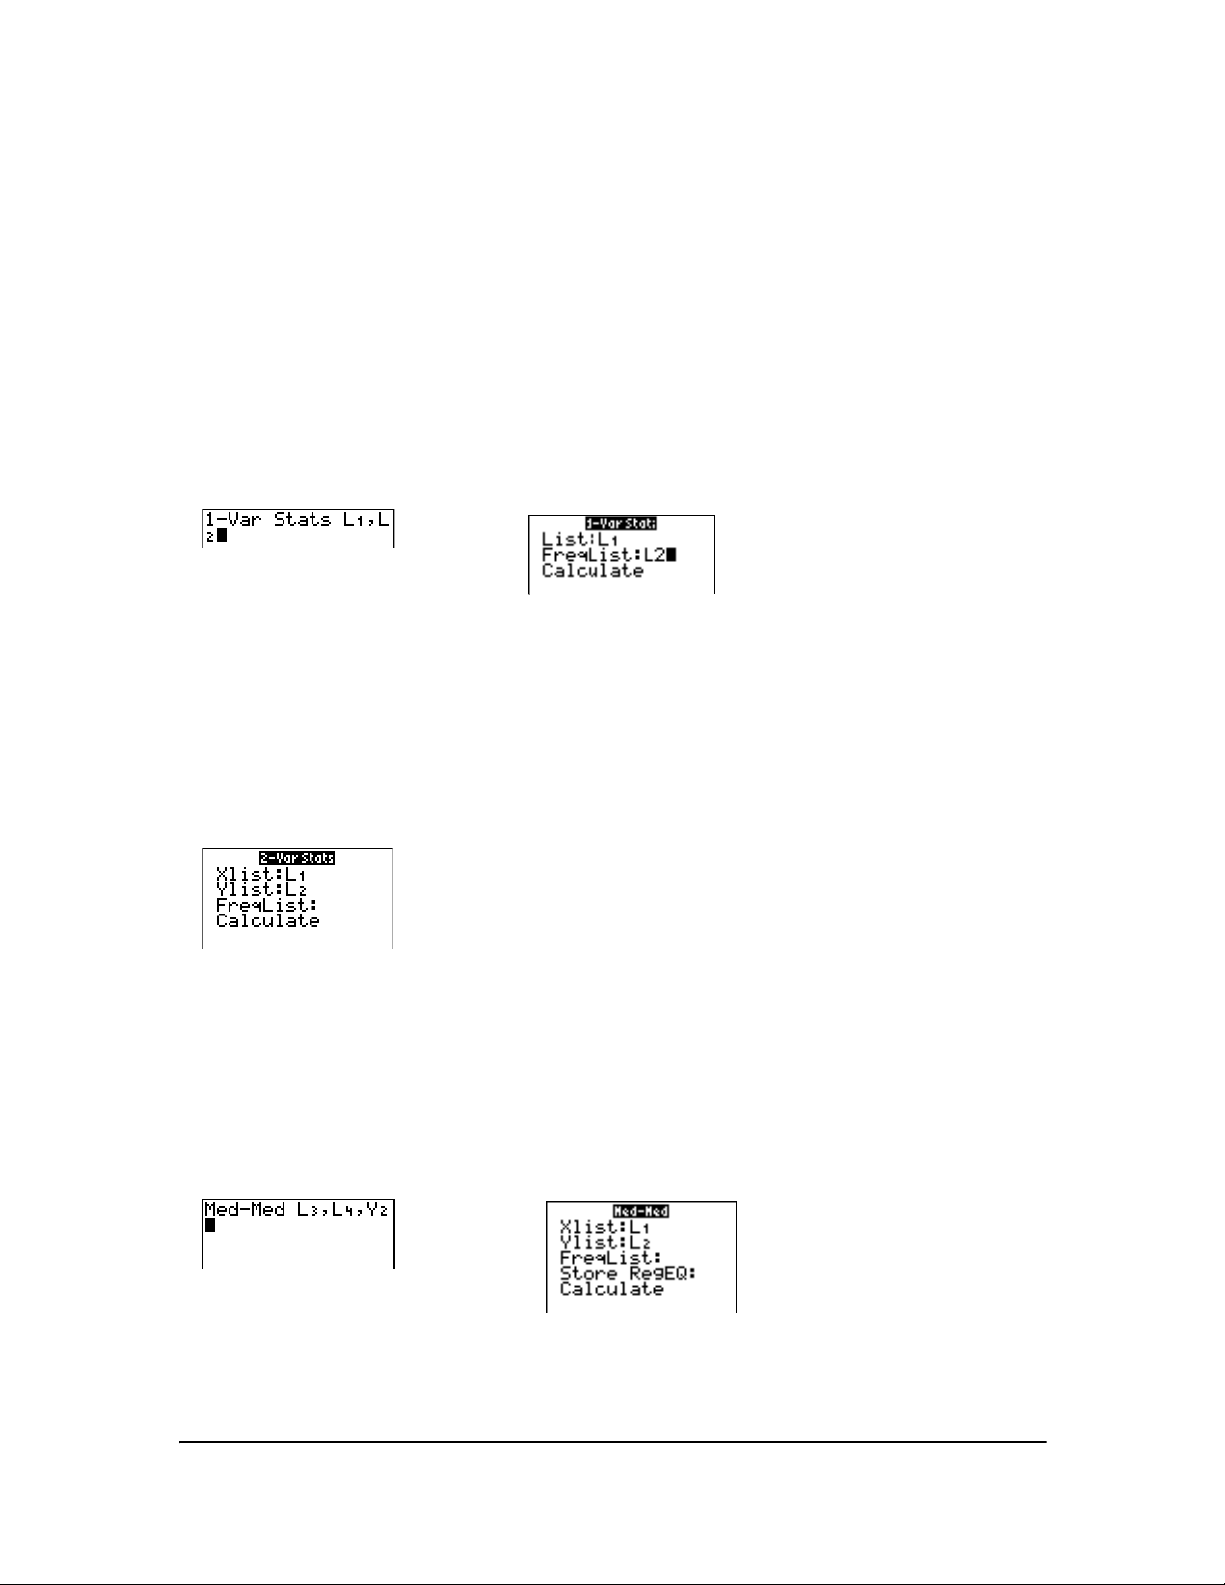
Med-Med (ax+b)
Med-Med (median-median) fits the model equation y=ax+b to the data using the median-median
line (resistant line) technique, calculating the summary points x1, y1, x2, y2, x3, and y3.
Med-Med
displays values for a (slope) and b (y-intercept).
Med-Med [Xlistname,Ylistname,freqlist,regequ]
Loading ...
Loading ...
Loading ...