
Loading ...
Loading ...
Loading ...
Chapter 12: Statistics 180
The regression line appears to fit the central portion of the scatter plot well. However, a residual
plot may provide more information about this fit.
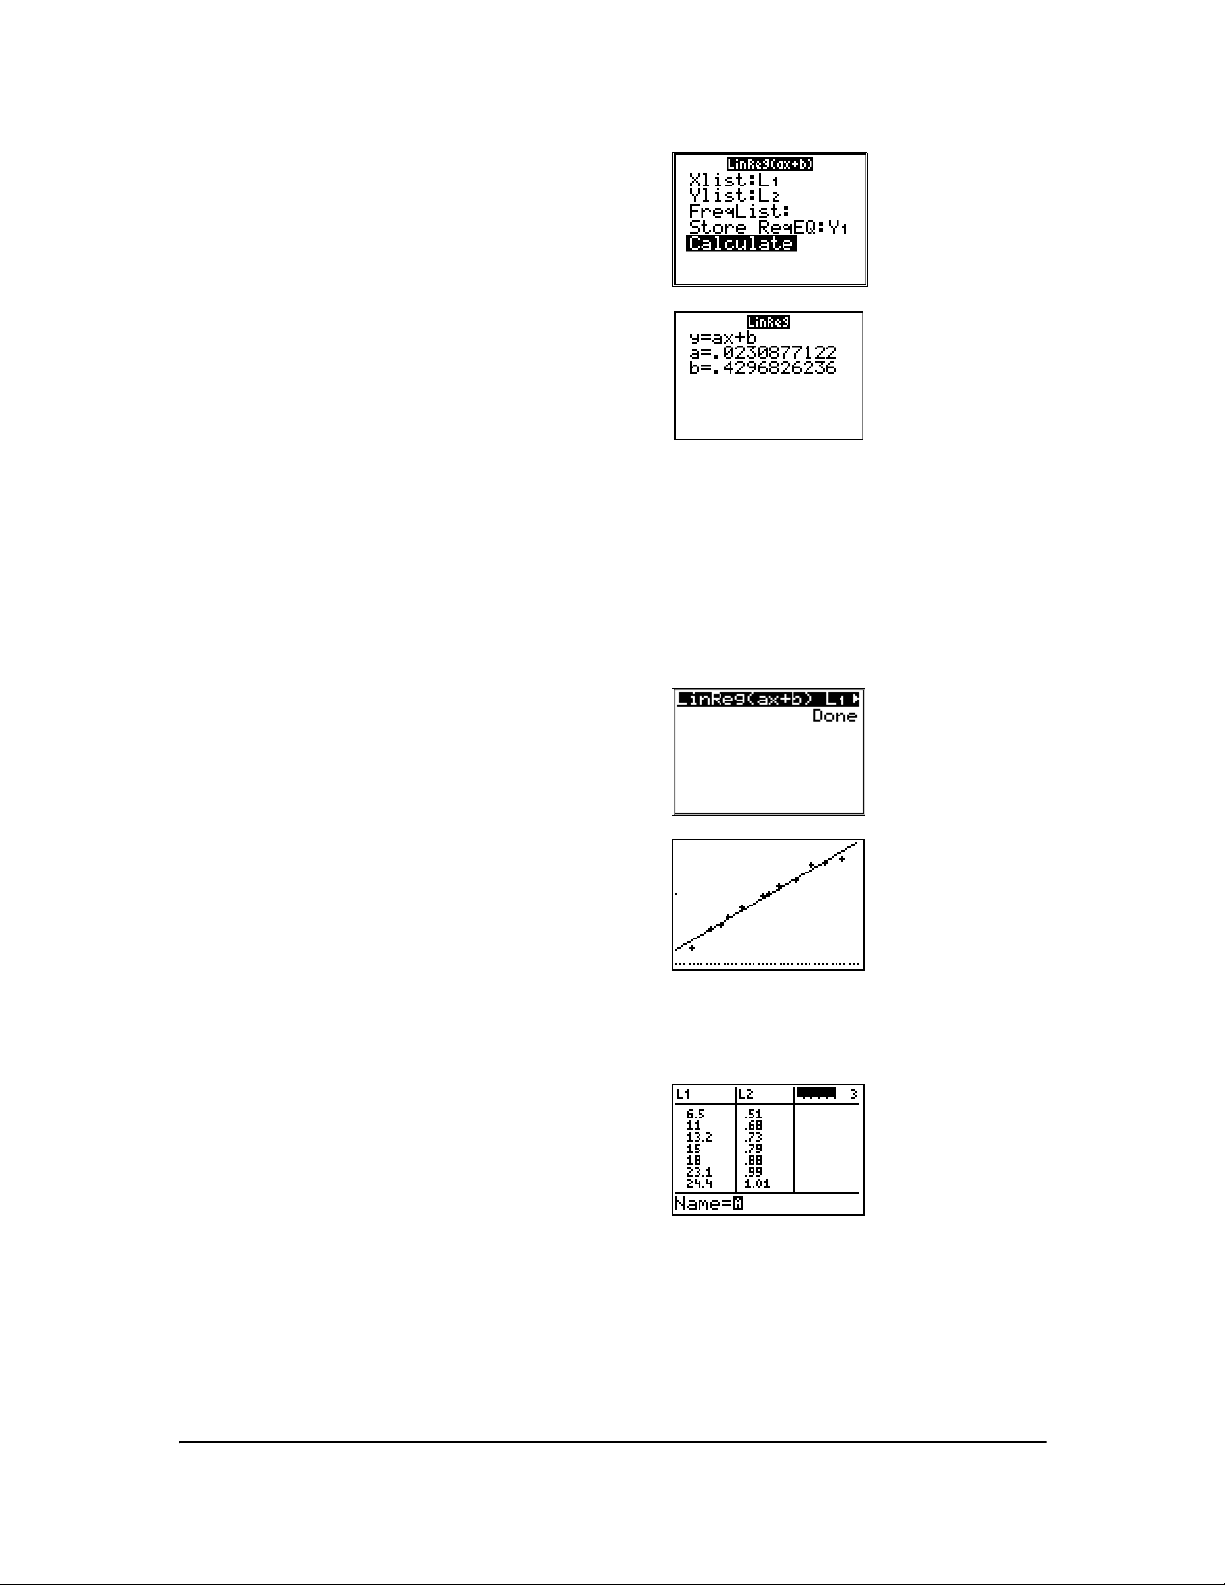
11. Fill in each argument in the stat wizard displayed.
Press y d (for
Xlist:), and † y e (for Ylist:),
Press † † (to
Store ReqEQ:)and then press
t a Í to paste
Y1. Press † (to select
Calculate).
12. Press Í to execute LinReg(ax+b). The linear
regression for the data in
L1 and L2 is calculated.
Values for
a and b are displayed in a temporary
result screen. The linear regression equation is
stored in
Y1. Residuals are calculated and stored
automatically in the list name
RESID, which
becomes an item on the
LIST NAMES menu.
Note:
- You can control the number of decimal places
displayed by changing the decimal mode setting.
- The statistics reported are not stored in the history on
the home screen.
-Press
5 ~ ~ ~ to access the statistical
variables.
- Press
‘ to return to the home screen.
13. The stat wizard pastes the populated command in
the home screen history for repeated use, if
needed (press ‘ } } to view the home
screen history as show in the screen).
14. Press s. The regression line and the scatter
plot are displayed.
15. Press …
1 to select 1:Edit. The stat list editor is
displayed.
Press ~ and } to move the cursor onto
L3.
Press y 6. An unnamed column is displayed
in column 3;
L3, L4, L5, and L6 shift right one
column. The
Name= prompt is displayed in the
entry line, and alpha-lock is on.
Loading ...
Loading ...
Loading ...