Loading ...
Loading ...
Loading ...
63
End Time: The date and time will end. Use the calendar and time boxes to enter an end time range.
Flow Direction: These checkboxes can be used as filters for the report to show only certain criteria such as how
many “Enters”, “Exits”, or “Display No.” Display No.” All 3 options are enabled by default.
Report Type: The type of report that will be generated (Bar chart or Line chart).
Search: Used to search and generate the report.
Export: Allows the user to export an image of the people counting report to their computer.
Reading a Bar Chart
A bar chart can be generated which will display the number of people who enter or exit a certain area based on a
daily, monthly, or yearly report.
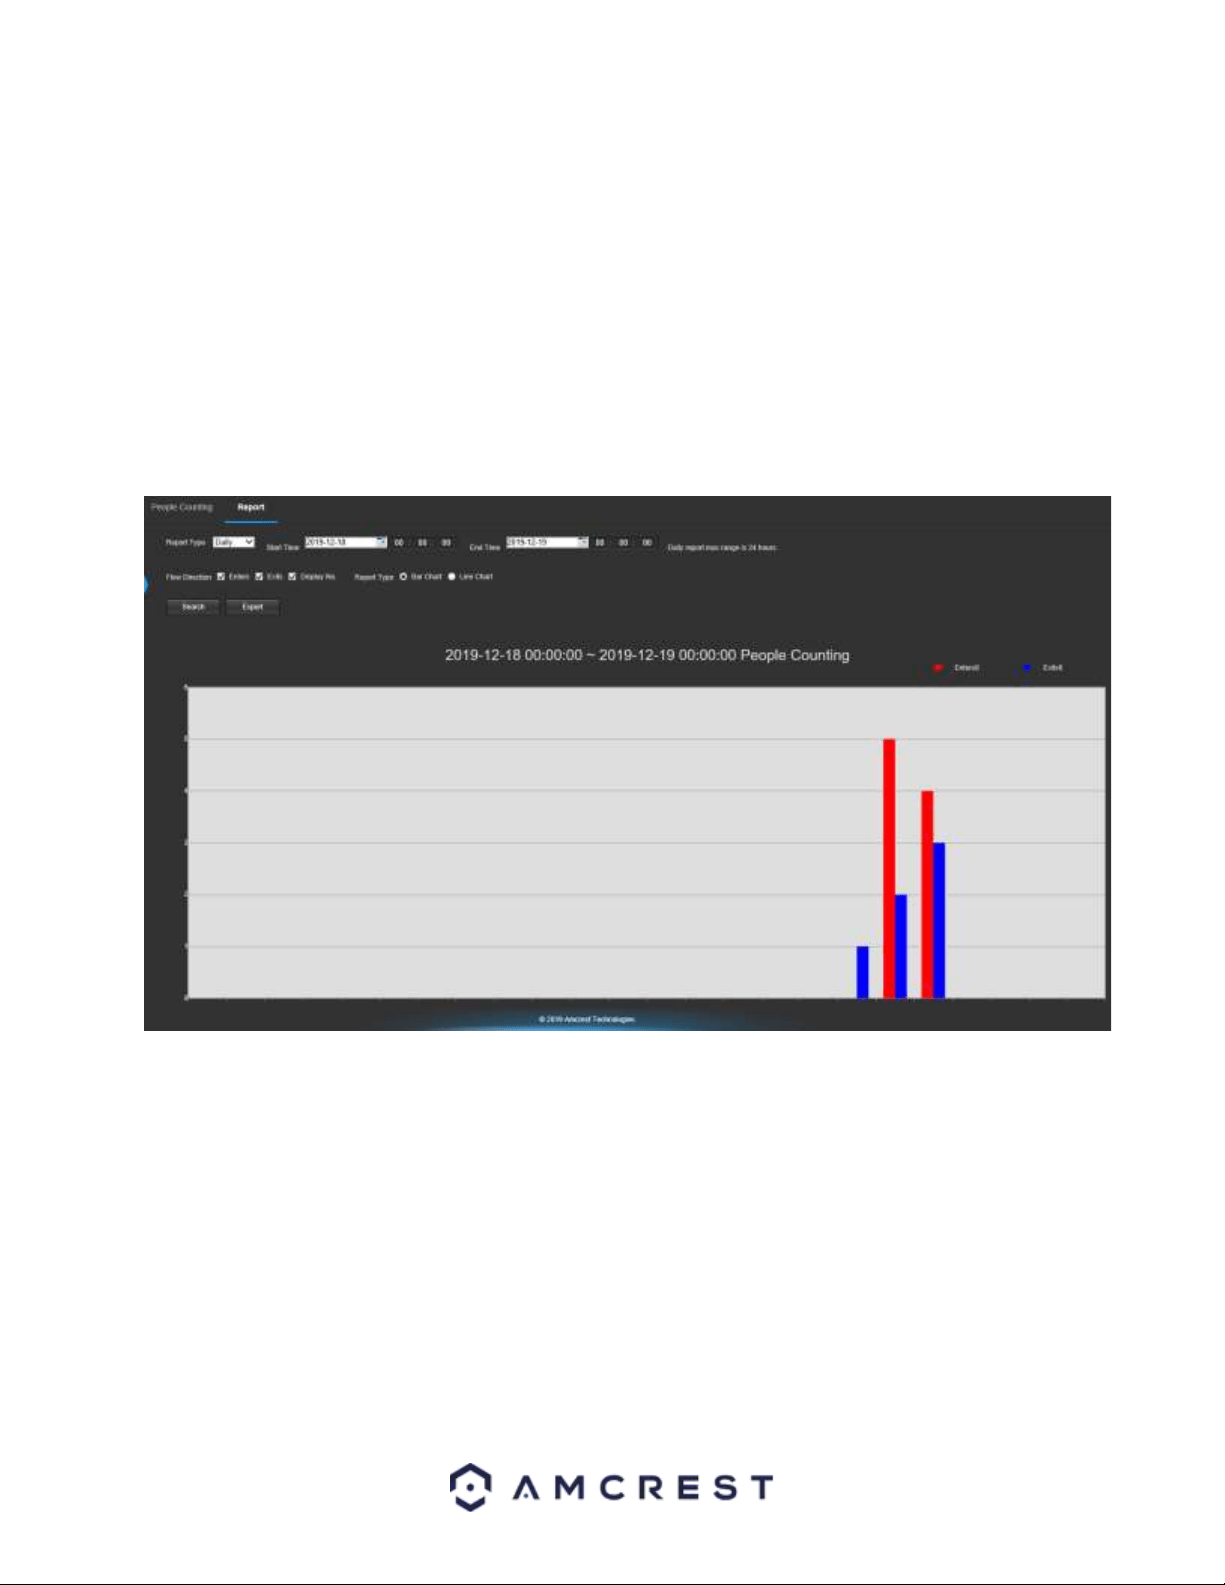
Below is an example of a generated bar chart:
The date and time range will be displayed on the top of the chart as well as a color-coded display and legend of the
enters and exit statistics will be displayed as well. The left side of the chart will display the range of people that
were reported. The blue bar represents the amount of exits in the chart and the red bar represents the amount of
people who entered.
Reading a Line Chart
A line chart can be generated which will display the number of people who enter or exit a certain area based on a
daily, monthly, or yearly report.
Below is an example of a generated line chart:
Loading ...
Loading ...
Loading ...