Loading ...
Loading ...
Loading ...
7.Demonstration
69
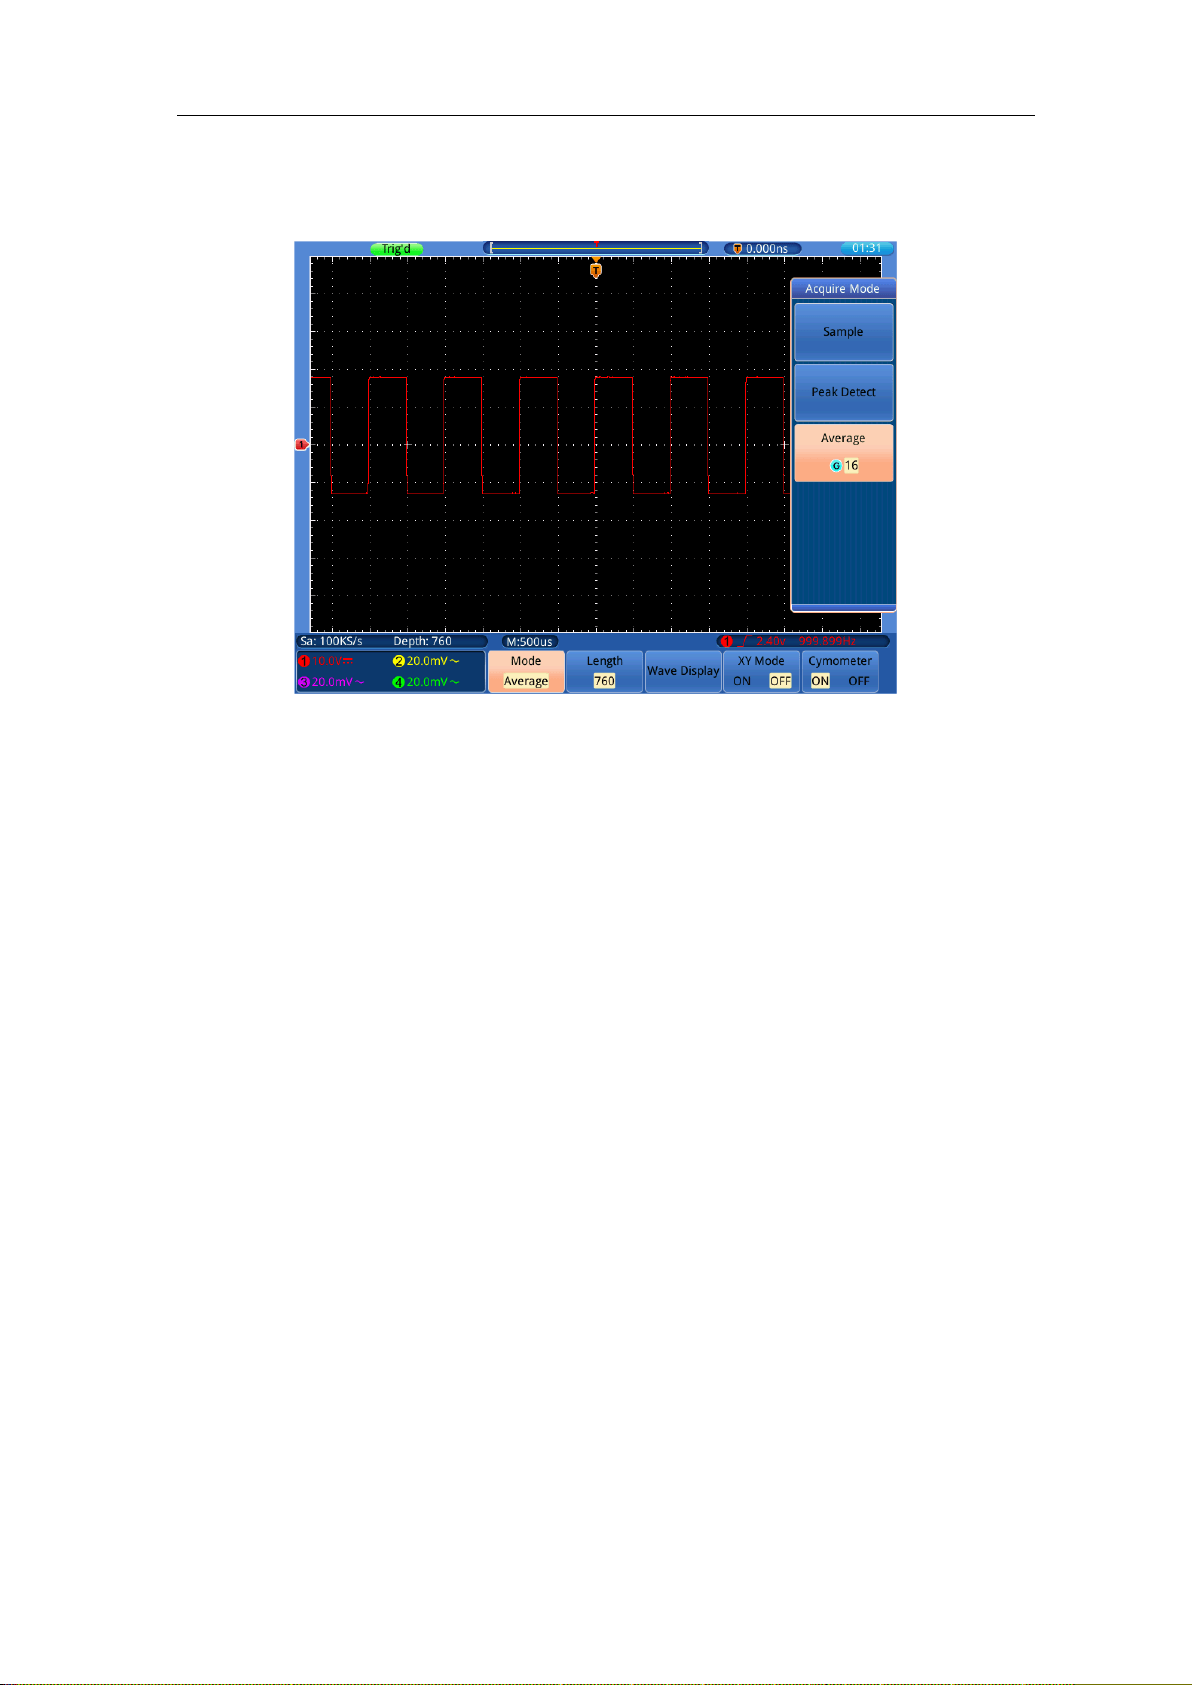
User would see a much reduced random noise level and make it easy to see more
details of the signal itself. After applying Average, user can easily identify the burrs
on the rising and falling edges of some part of the signal (see Figure 7-5).
Figure 7-5 Reduce Noise level by using Average function
Example 5: Application of X-Y Function
Examine the Phase Difference between Signals of two Channels
Example: Test the phase change of the signal after it passes through a circuit network.
X-Y mode is a very useful when examining the Phase shift of two related signals.
This example takes you step by step to check out the phase change of the signal after
it passes a specified circuit. Input signal to the circuit and output signal from circuit
are used as source signals.
For the examination of the input and output of the circuit in the form of X-Y
coordinate graph, please operate according to the following steps:
(1) Set the probe menu attenuation coefficient for 10X and that of the switch in the
probe for 10X (see "How to Set the Probe Attenuation Coefficient" on P13).
(2) Connect the probe of channel 1 to the input of the network and that of Channel 2
to the output of the network.
(3) Turn on CH1 and CH2, turn off CH3 and CH4 using the CH1
~
CH4 keys.
(4) Push down the Autoset button, with the oscilloscope turning on the signals of the
two channels and displaying them in the screen.
(5) Turn the VOLTS/DIV knob, making the amplitudes of two signals equal in the
rough.
(6) Press the Acquire button to display menu in the bottom.
Loading ...
Loading ...
Loading ...