Loading ...
Loading ...
Loading ...
Training with Running Dynamics
Before you can view running dynamics, you must put on a running dynamics accessory, such as the HRM-Pro
accessory, and pair it with your device (Pairing Your Wireless Sensors, page 95).
1 Hold MENU.
2 Select Activities & Apps.
3 Select an activity.
4 Select the activity settings.
5 Select Data Screens > Add New.
6 Select a running dynamics data screen.
NOTE: The running dynamics screens are not available for all activities.
7 Go for a run (Starting an Activity, page 5).
8 Select UP or DOWN to open a running dynamics screen to view your metrics.
Color Gauges and Running Dynamics Data
The running dynamics screens display a color gauge for the primary metric. You can display cadence, vertical
oscillation, ground contact time, ground contact time balance, or vertical ratio as the primary metric. The color
gauge shows you how your running dynamics data compare to those of other runners. The color zones are
based on percentiles.
Garmin has researched many runners of all different levels. The data values in the red or orange zones are
typical for less experienced or slower runners. The data values in the green, blue, or purple zones are typical for
more experienced or faster runners. More experienced runners tend to exhibit shorter ground contact times,
lower vertical oscillation, lower vertical ratio, and higher cadence than less experienced runners. However, taller
runners typically have slightly slower cadences, longer strides, and slightly higher vertical oscillation. Vertical
ratio is your vertical oscillation divided by stride length. It is not correlated with height.
Go to www.garmin.com/runningdynamics for more information on running dynamics. For additional theories
and interpretations of running dynamics data, you can search reputable running publications and websites.
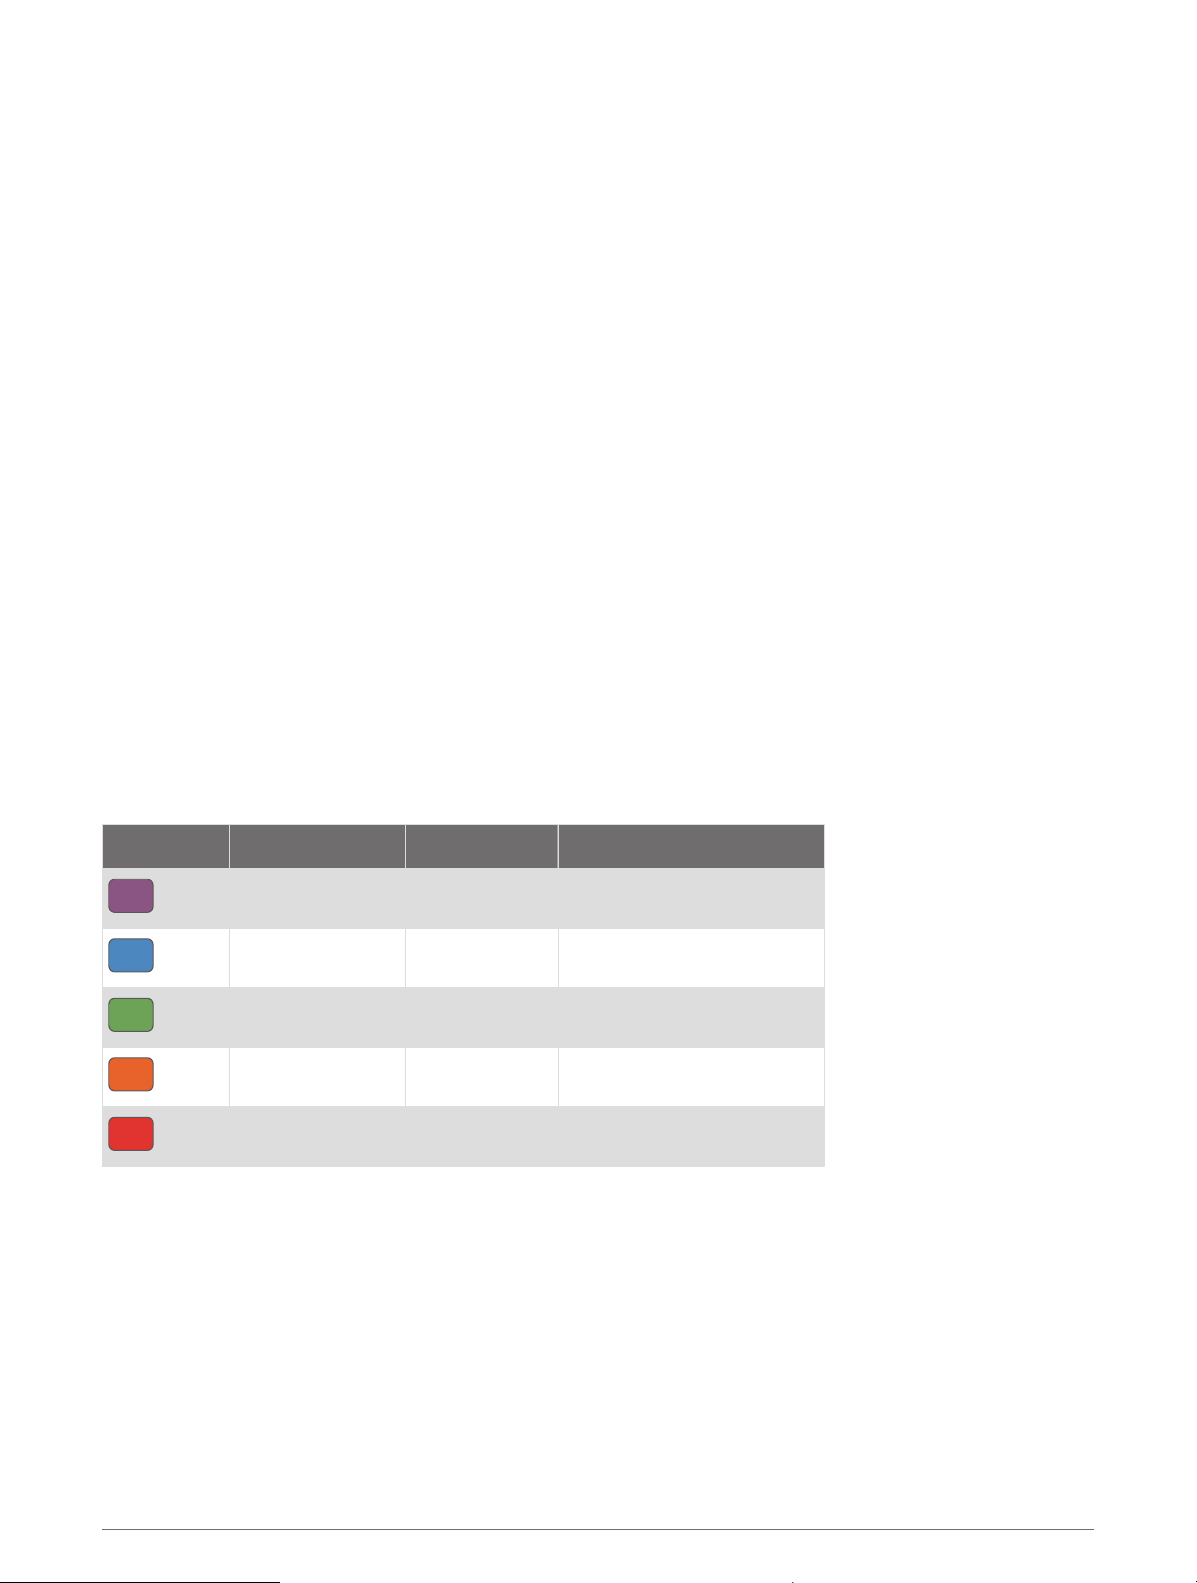
Color Zone Percentile in Zone Cadence Range Ground Contact Time Range
Purple
>95 >183 spm <218 ms
Blue
70–95 174–183 spm 218–248 ms
Green
30–69 164–173 spm 249–277 ms
Orange
5–29 153–163 spm 278–308 ms
Red
<5 <153 spm >308 ms
Heart Rate Features 35
Loading ...
Loading ...
Loading ...