Loading ...
Loading ...
Loading ...
Type the values of your choice over the current values for x-min, x-max, y-min, y-
max, Xscale, and Yscale and click OK.
7. Press b > View > Hide Axes (b 2 1) to hide or show the axes.
• If the axes are shown on the page, selecting this tool hides them.
• If the axes are hidden on the page, selecting this tool redisplays them.
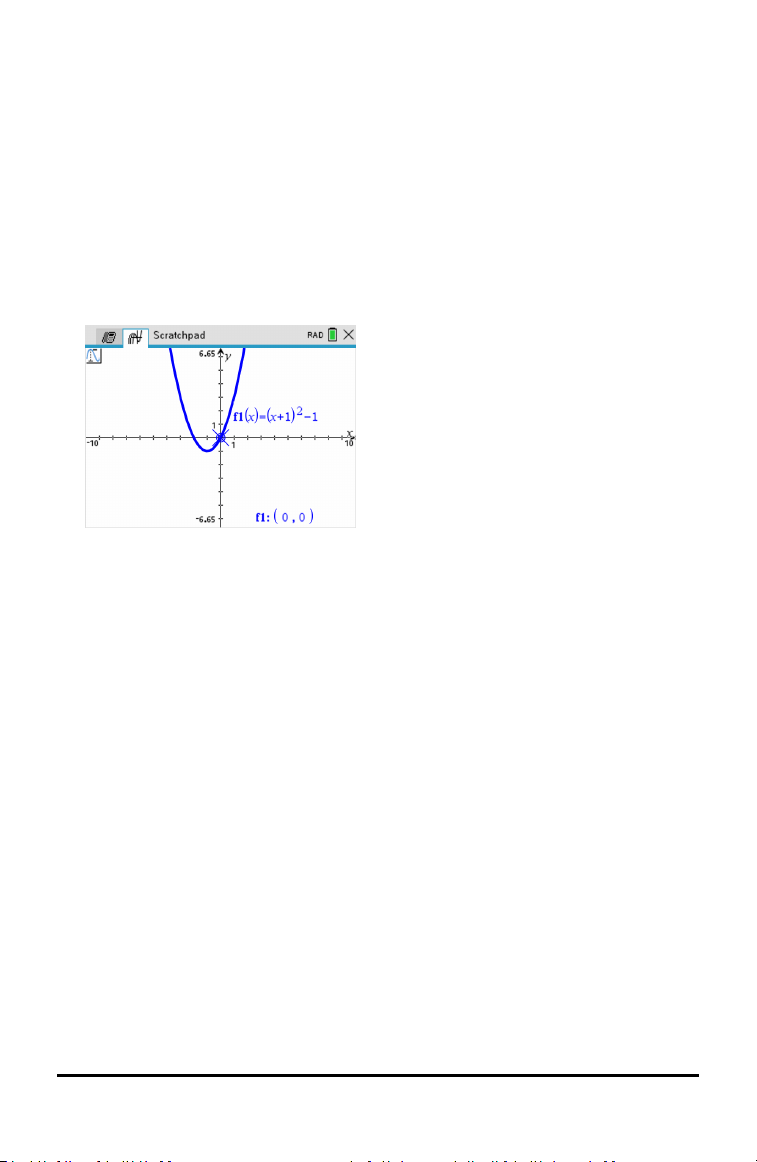
Tracing a Plot
Graph Trace moves through the points of a graphed function, parametric, polar,
sequence, or scatter plot. To enable the trace tool:
1. Press b > Trace > Graph Trace (b 5 1) to move across the plot in Trace
mode.
2. (Optional) To change the trace step increment for tracing, press b 5 3.
After you type a different step increment, the Graph Trace tool moves across the
graph in steps of that size.
3. Use Graph Trace to explore a plot in the following ways:
• Move to a point and hover to move the trace cursor to that point.
• Press ¡or¢ to move from point to point on the function’s graph. The
coordinates of each point traced are displayed.
• Press £or¤ to move from one plot to another. The point’s coordinates
update to reflect the new location of the trace. The trace cursor is positioned
on the point of the new graph or plot with the closest x value to the last point
identified on the previously traced function or graph.
• Type a number and press · to move the trace cursor to the point on the plot
with independent coordinates nearest the typed value.
• Create a persistent point that remains on the graph by pressing · when the
trace point reaches the point you want to label. The point remains after you
exit Graph Trace mode.
Notes:
Using the Scratchpad 23
Loading ...
Loading ...
Loading ...