Loading ...
Loading ...
Loading ...
6.Demonstration
90
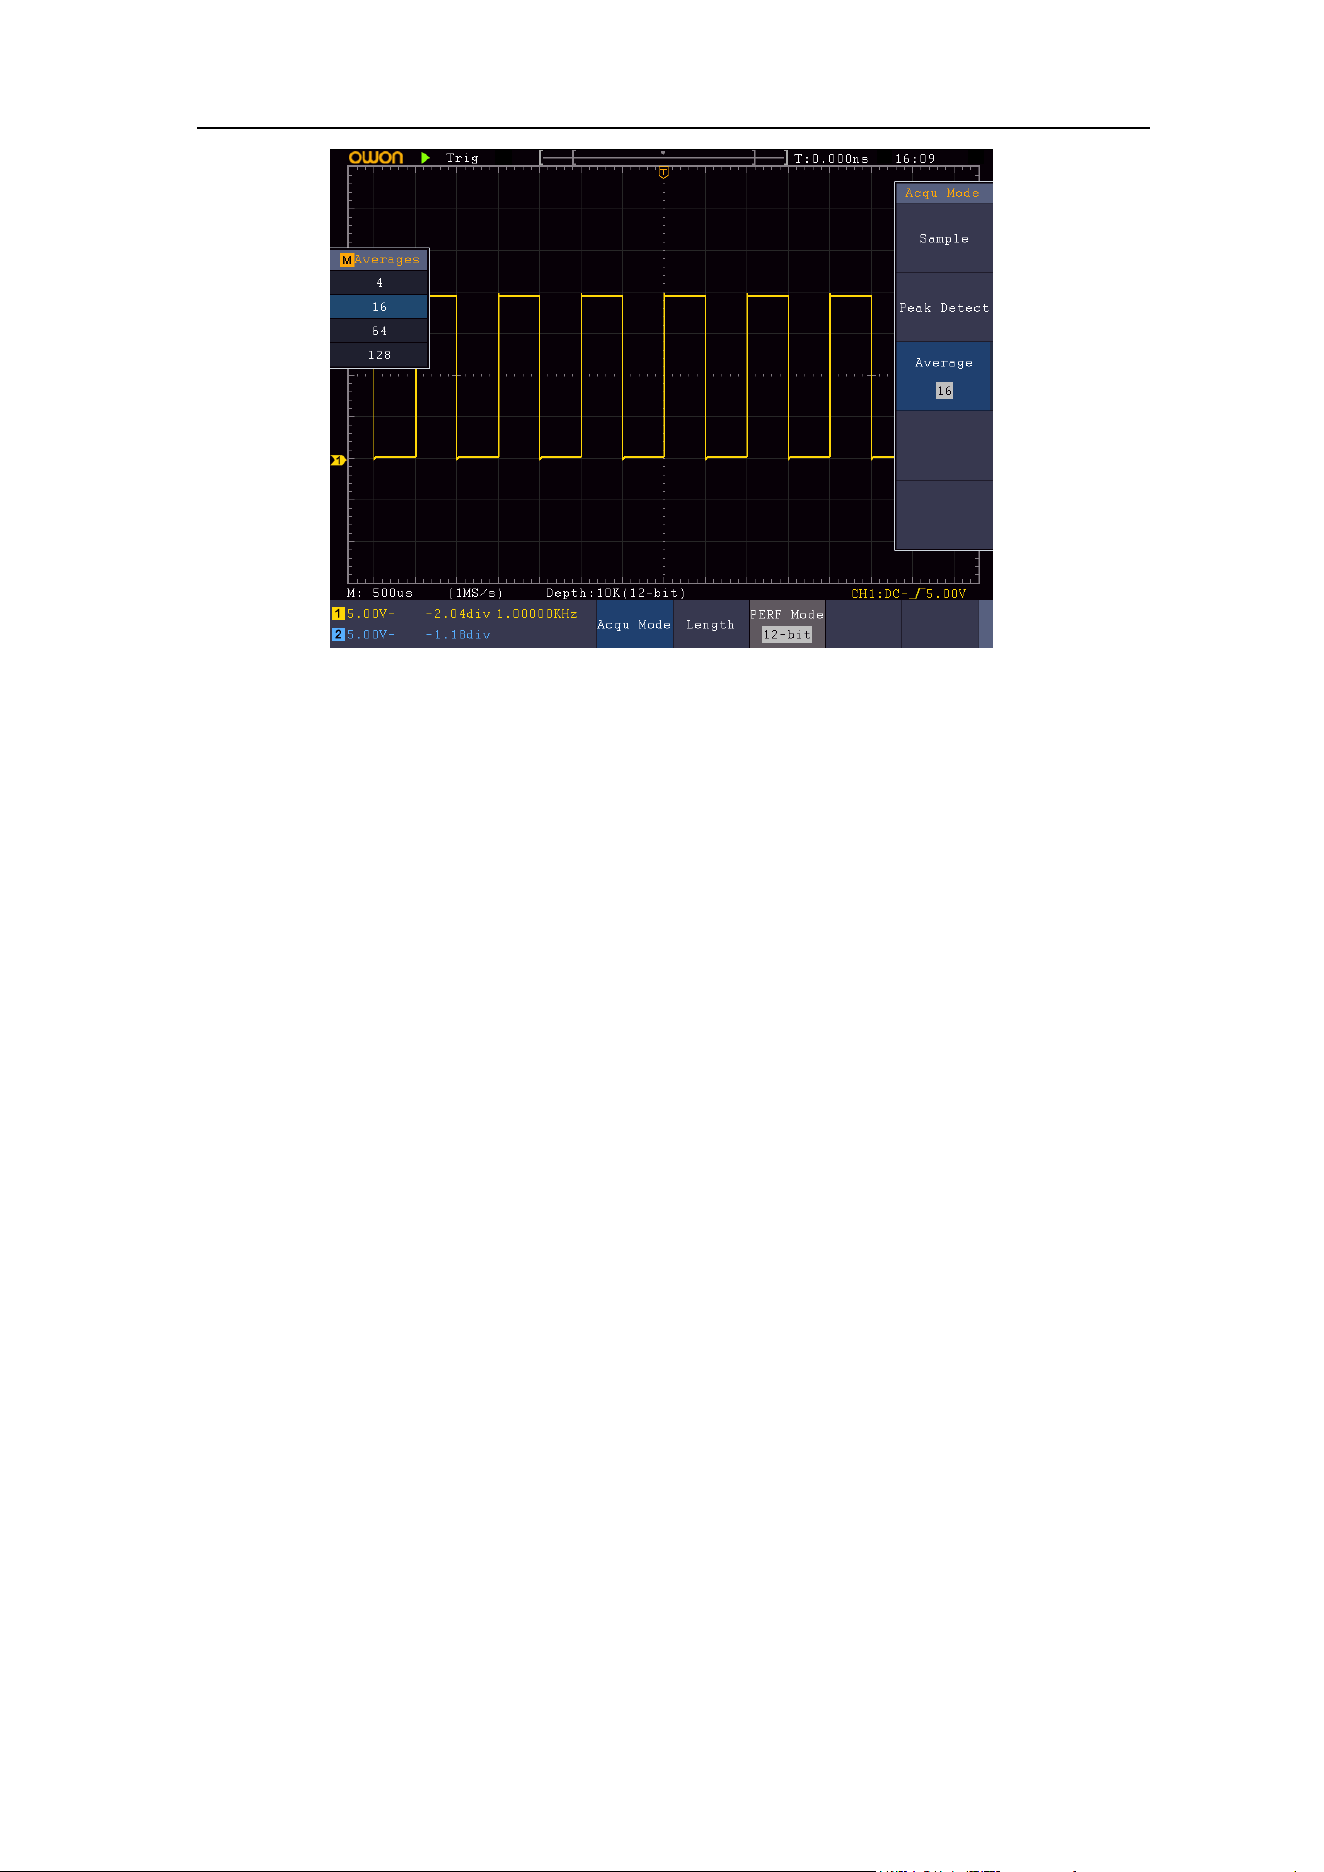
Figure 6-5 Reduce Noise level by using Average function
Example 5: Application of X-Y Function
Examine the Phase Difference between Signals of two Channels
Example: Test the phase change of the signal after it passes through a circuit network.
X-Y mode is a very useful when examining the Phase shift of two related signals.
This example takes you step by step to check out the phase change of the signal after
it passes a specified circuit. Input signal to the circuit and output signal from circuit
are used as source signals.
For the examination of the input and output of the circuit in the form of X-Y
coordinate graph, please operate according to the following steps:
(1) Set the probe menu attenuation coefficient for 10X and that of the switch in the
probe for 10X (see "How to Set the Probe Attenuation Coefficient" on P12).
(2) Connect the probe of channel 1 to the input of the network and that of Channel 2
to the output of the network.
(3) Push the Autoset button, with the oscilloscope turning on the signals of the two
channels and displaying them in the screen.
(4) Turn the Vertical Scale knob, making the amplitudes of two signals equal in the
rough.
(5) Push the Display button and recall the Display menu.
(6) Select XY Mode in the bottom menu. Select Enable as ON in the right menu.
The oscilloscope will display the input and terminal characteristics of the network
in the Lissajous graph form.
(7) Turn the Vertical Scale and Vertical Position knobs, optimizing the waveform.
Loading ...
Loading ...
Loading ...