Loading ...
Loading ...
Loading ...
32 Working with Graphs
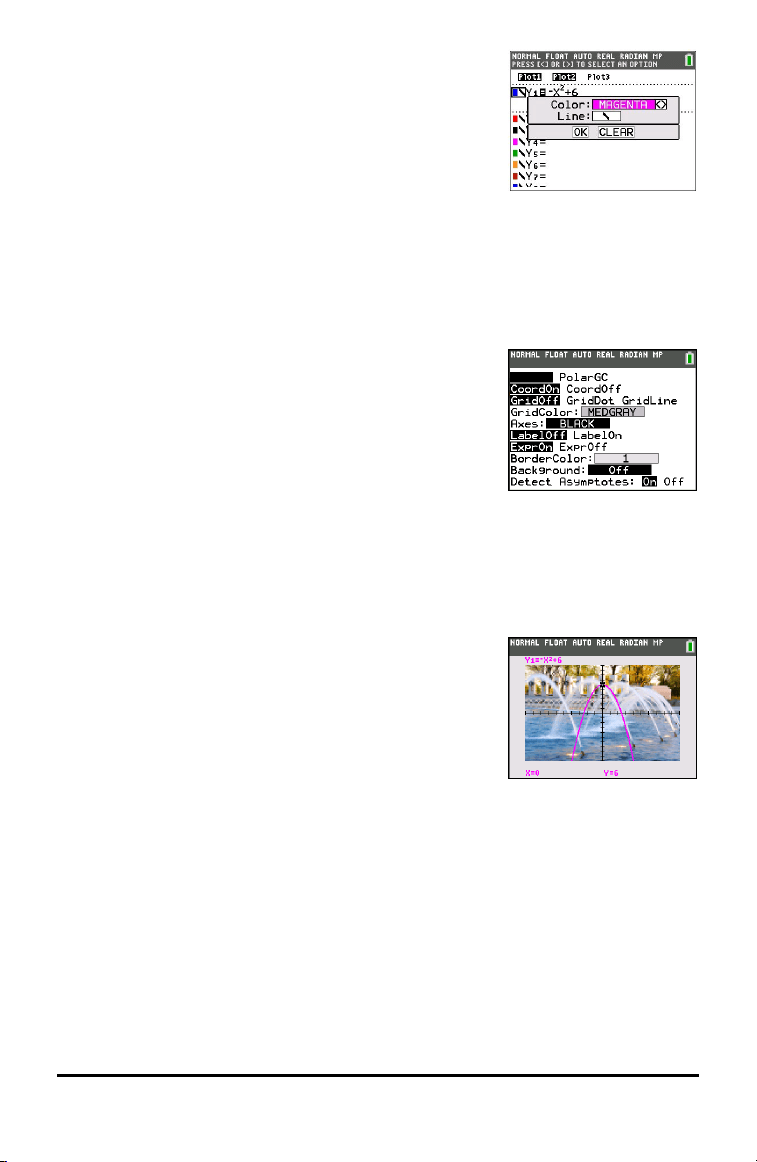
1. Press | to highlight the colored box.
2. Press Í.
3. Press y ~ ~ ~ to place the cursor box on the color
and line style at the left of the screen and press Í.
The spinner box displays. Notice the second line in the
status bar, which displays hints.
4. Press ~ ~ ~ to select magenta.
5. Press †.
Note: The thick line style is the default. It can be changed by pressing | or ~.
6. Press ~ to highlight OK and then press Í.
To set a Background Image:
1. Press y ..
Set grid color, axes, and border color as desired.
2. Press } or † as necessary to highlight Background.
The spinner dialog box becomes active.
3. Press ~ as necessary to select the desired Background Image or color.
Note: Your pre-loaded Image Var may be different than the one displayed.
Note: To create Background Image Vars, use the free TIConnect™ CE software to
convert and send images to your TI-84 Plus CE graphing calculator.
4. Press r to see the graph and trace points.
Note: You can manipulate the graph to “fit” an object in
the Background Image Var. You can also use QuickPlot and
Fit Equation to fit an equation to a shape. (See QuickPlot .)
Using QuickPlot and Fit Equation
QuickPlot and Fit Equation allows you to drop points on a graph screen and model a
curve to those points using regression functions. You can select color and line style,
draw points on a graph, and choose an equation to fit the drawn points. You can then
store the results of the plot and equation.
QuickPlot and Fit Equation is an option in the … / menu.
Prior to starting the QuickPlot and Fit Equation interactive feature on the graph area,
be sure to set your Background Image Var and other graph settings from the FORMAT
screen. Also set your WINDOW or ZOOM settings.
Loading ...
Loading ...
Loading ...