Loading ...
Loading ...
Loading ...
SDS1000X HD Series User Manual
196 i nt.si gle nt.co m
26.4 Data Analysis
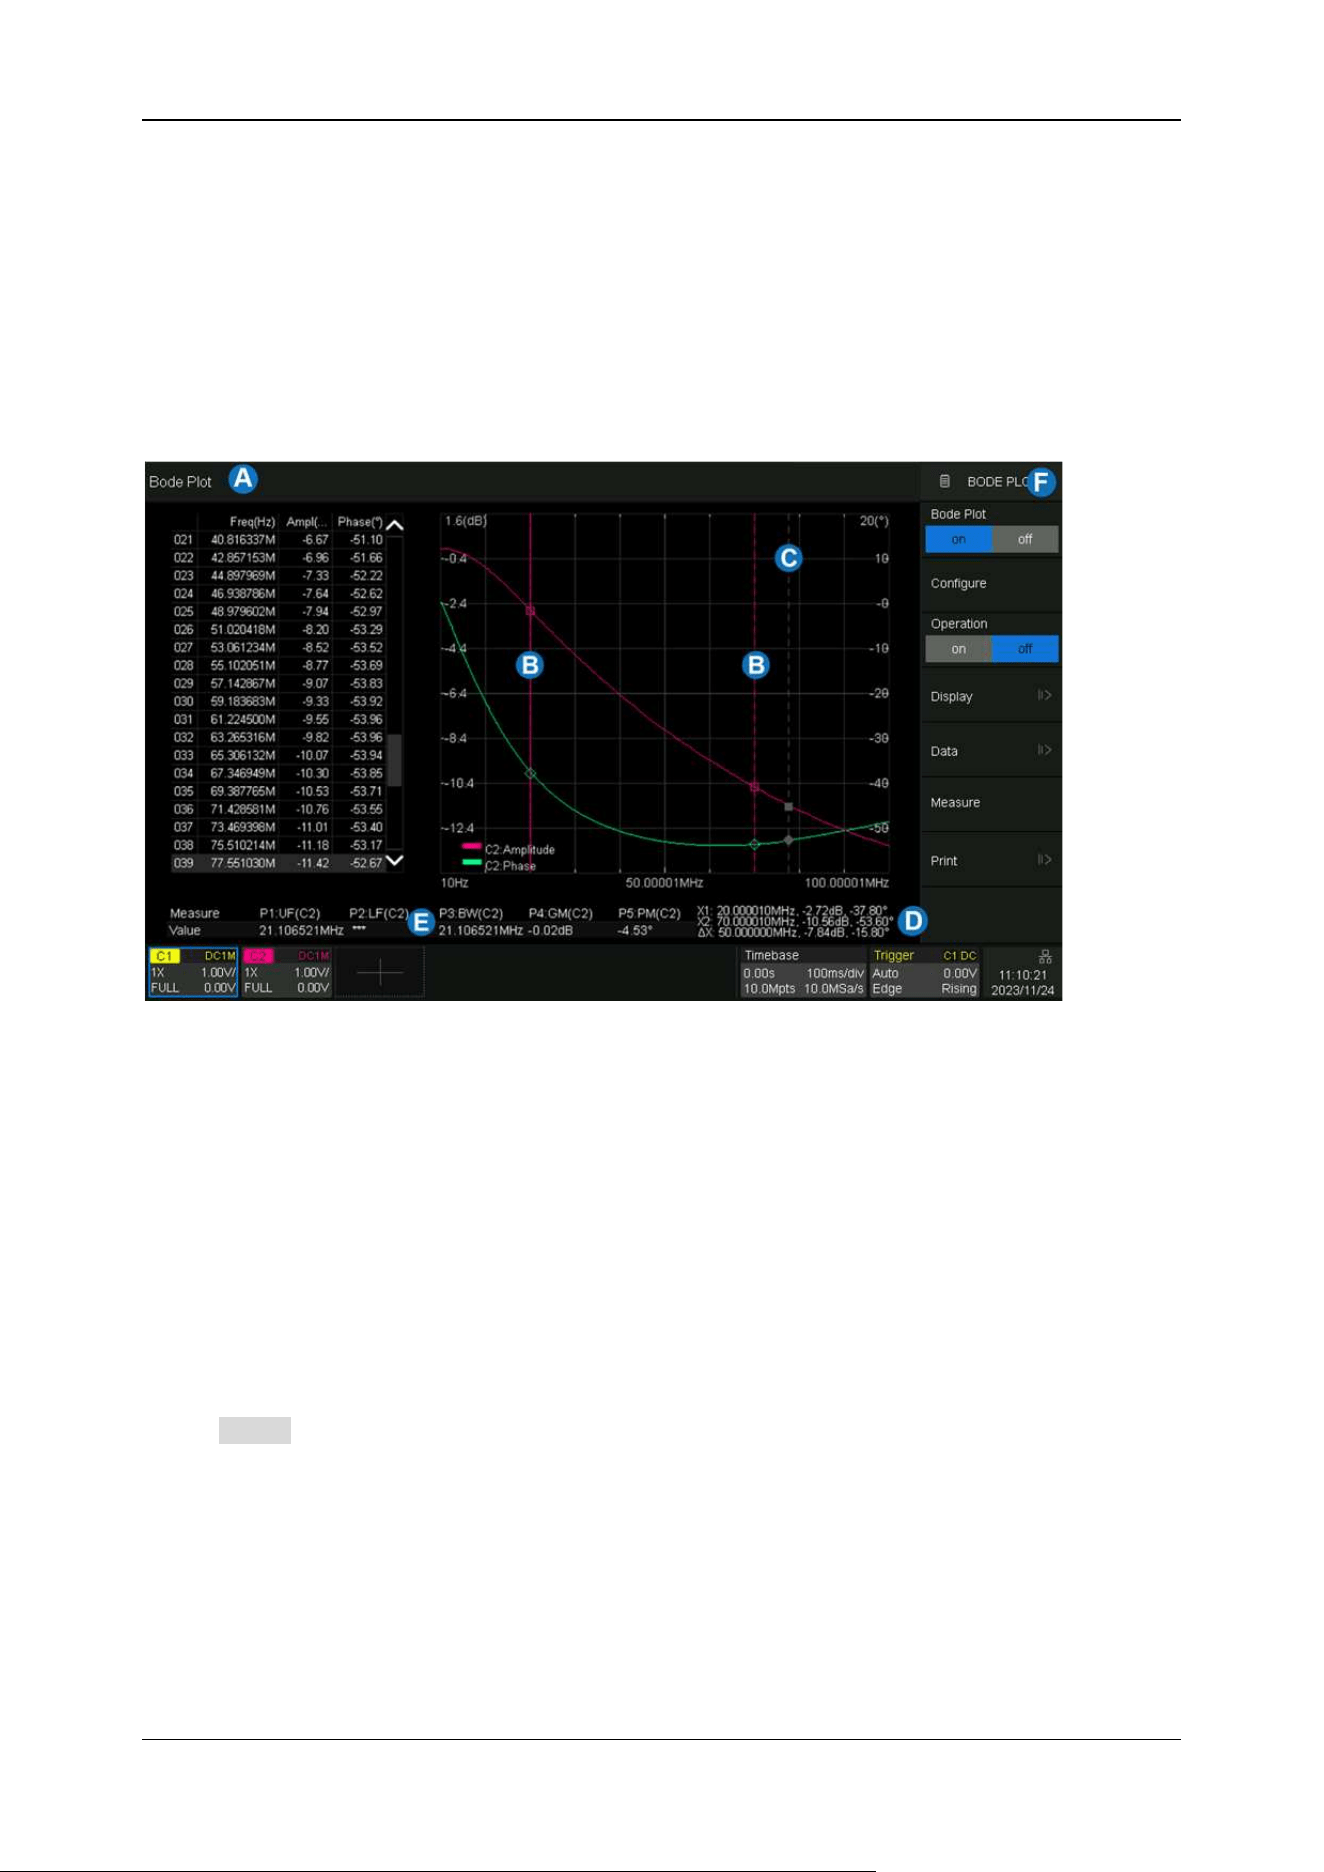
With the data list, cursor measurement, and automatic measurement functions, the Bode plot curve
can be analyzed in detail. The data list provides the information of each scanning point. The cursors
can be used to flexibly measure the change of each position of the curve. The automatic measurement
function can be used to measure the five parameters of the Bode plot curve: upper cut-off frequency
(UF), lower cut-off frequency (LF), bandwidth (BW), gain margin (GM), phase margin (PM).
A. Data list display area
B. Cursors
C. Data point location line
D. Cursor information display area
E. Measurement parameters display area
F. Bode plot dialog box
Data List
Touch Data to recall the data setting dialog box:
Loading ...
Loading ...
Loading ...