Loading ...
Loading ...
Loading ...
Performance and curves diagrams
Domestic air conditioner
11.Performence and curves diagrams
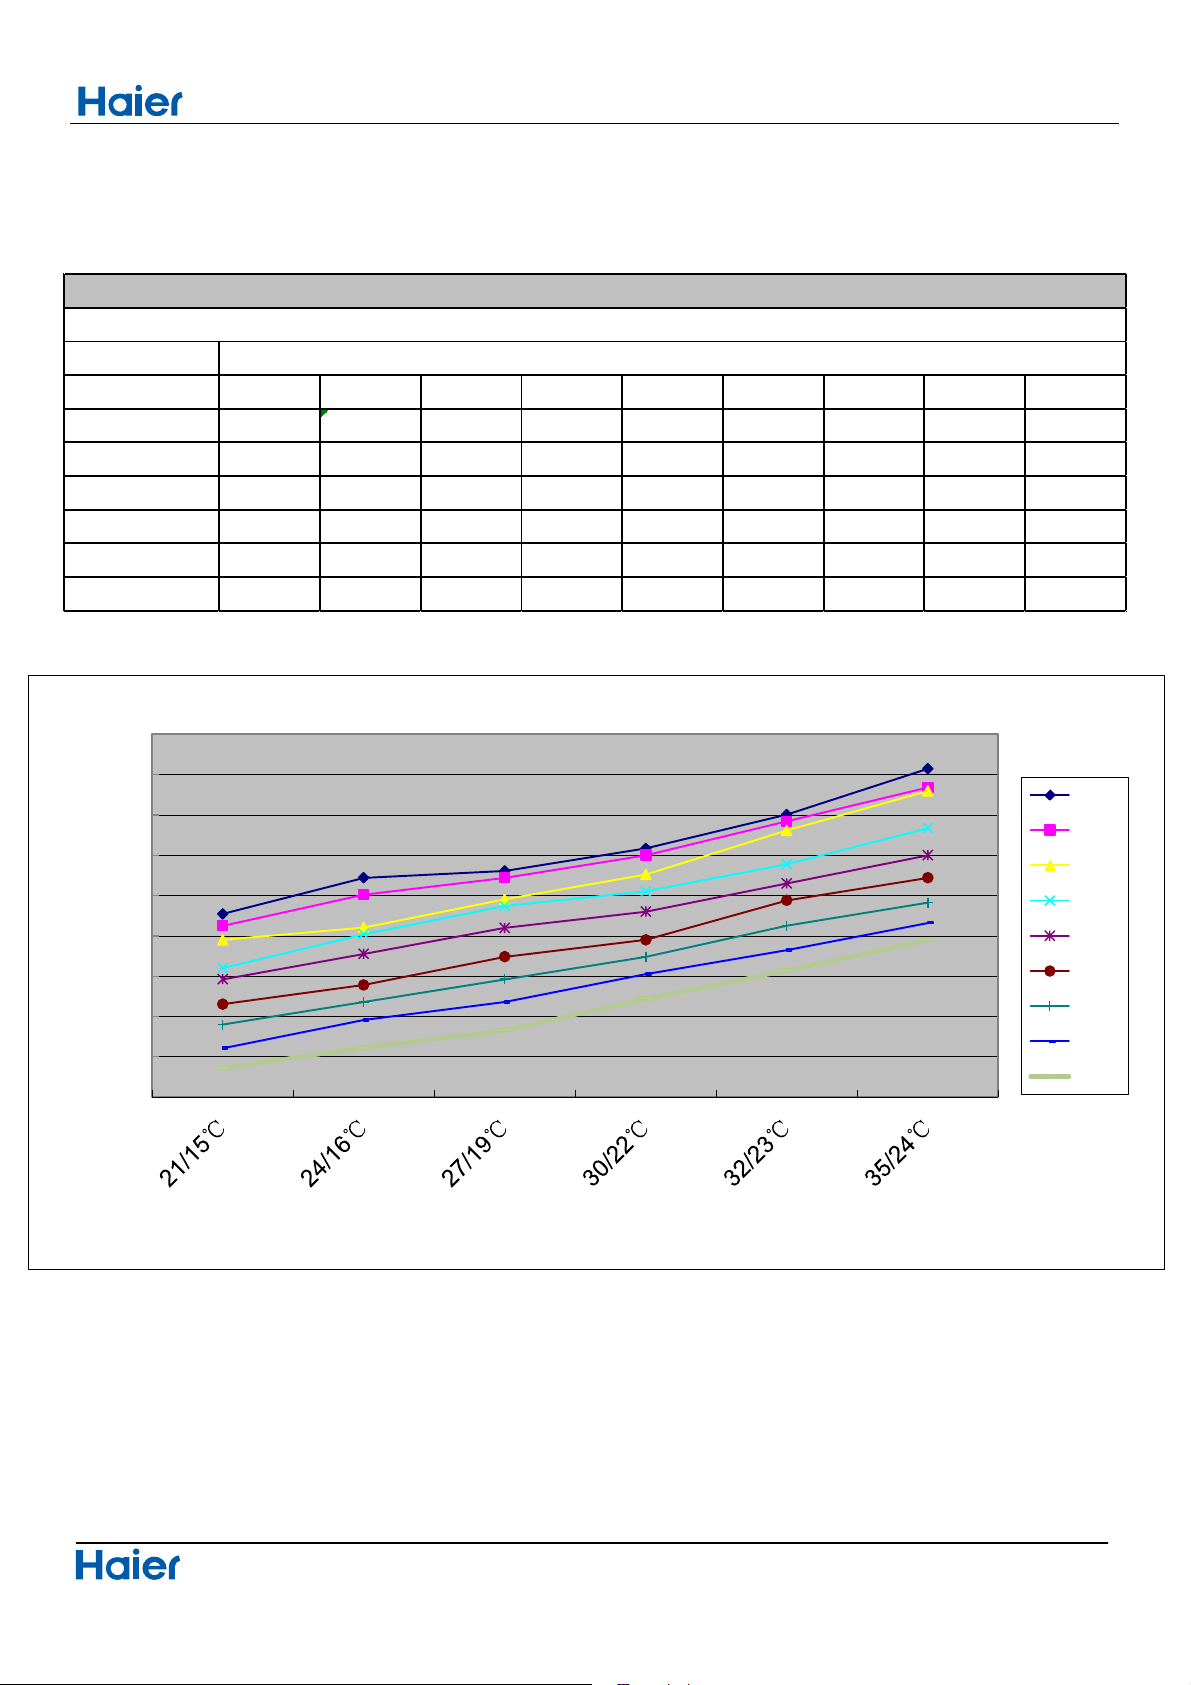
11.1 Cooling capacity-temperature curves
45
indoor temp.
DB/WB 10℃ 15℃ 20℃ 25℃ 30℃ 35℃ 38℃ 40℃ 43℃
21/15℃
6272 6124.8 5950 5600 5460 5152 4900 4606 4360
24/16℃
6720 6510 6104 6020 5776.4 5390 5180 4956 4610
27/19℃
6804 6720 6454 6370 6098.4 5740 5460 5180 4830
30/22℃
7084 7000 6762 6552 6300 5950 5740 5524.4 5220
32/23℃
7504 7420 7308 6888 6650 6440 6126.4 5824 5570
35/24℃
8072 7840 7798 7336 7000 6720 6412 6160 5950
performance curves
cooling value-temerature table
outdoor temp
4000
4500
5000
5500
6000
6500
7000
7500
8000
8500
cooling capacity (W)
cooling capacity and indoor/outdoor temp.curves
10℃
15℃
20℃
25℃
30℃
35℃
38℃
40℃
43℃
Loading ...
Loading ...
Loading ...