Loading ...
Loading ...
Loading ...
Can I use the cardio activity outdoors?
You can use the cardio activity and turn on GPS for outdoor use.
1
Select START > Cardio > Options > GPS.
2
Select an option.
3
Go outside, and wait while the device locates satellites.
4
Select START to start the activity timer.
GPS stays on for the selected activity until you turn it off.
Tips for Existing Garmin Connect Users
1
From the Garmin Connect app, select or .
2
Select Garmin Devices > Add Device.
Maximizing Battery Life
You can do several things to extend the life of the battery.
• Reduce the backlight timeout (Changing the Backlight
Settings, page 14).
• Turn off Bluetooth wireless technology when you are not
using connected features (Turning Off the Bluetooth
Smartphone Connection, page 6).
• Turn off activity tracking (Activity Tracking Settings, page 13).
• Use a watch face that is not updated every second.
For example, use a watch face without a second hand
(Customizing the Watch Face, page 13).
• Limit the smartphone notifications the device displays
(Managing Notifications, page 6).
• Stop broadcasting heart rate data to paired Garmin devices
(Broadcasting Heart Rate Data to Garmin Devices, page 7).
• Turn off wrist-based heart rate monitoring (Turning Off the
Wrist-based Heart Rate Monitor, page 8).
NOTE: Wrist-based heart rate monitoring is used to calculate
vigorous intensity minutes and calories burned.
How can I manually pair ANT+ sensors?
You can use the device settings to manually pair ANT+ sensors.
The first time you connect a sensor to your device using ANT+
wireless technology, you must pair the device and sensor. After
they are paired, the device connects to the sensor automatically
when you start an activity and the sensor is active and within
range.
1
Stay 10 m (33 ft.) away from other ANT+ sensors while
pairing.
2
If you are pairing a heart rate monitor, put on the heart rate
monitor.
The heart rate monitor does not send or receive data until
you put it on.
3
Hold UP.
4
Select > Sensors & Accessories > Add New.
5
Select an option:
• Select Search All.
• Select your sensor type.
After the sensor is paired with your device, a message
appears. Sensor data appears in the data page loop or a
custom data field.
Appendix
Data Fields
Some data fields require ANT+ accessories to display data.
Average Pace: The average pace for the current activity.
Average Speed: The average speed for the current activity.
Cadence: Running. The steps per minute (right and left).
Cadence: Cycling. The number of revolutions of the crank arm.
Your device must be connected to a cadence accessory for
this data to appear.
Calories: The amount of total calories burned.
Distance: The distance traveled for the current track or activity.
Heart Rate: Your heart rate in beats per minute (bpm). Your
device must have wrist-based heart rate or be connected to a
compatible heart rate monitor.
HR Zone: The current range of your heart rate (1 to 5). The
default zones are based on your user profile and maximum
heart rate (220 minus your age).
Lap Distance: The distance traveled for the current lap.
Lap Pace: The average pace for the current lap.
Lap Speed: The average speed for the current lap.
Lap Time: The stopwatch time for the current lap.
Pace: The current pace.
Speed: The current rate of travel.
Steps: The number of steps during the current activity.
Time of Day: The time of day based on your current location
and time settings (format, time zone, daylight saving time).
Timer: The stopwatch time for the current activity.
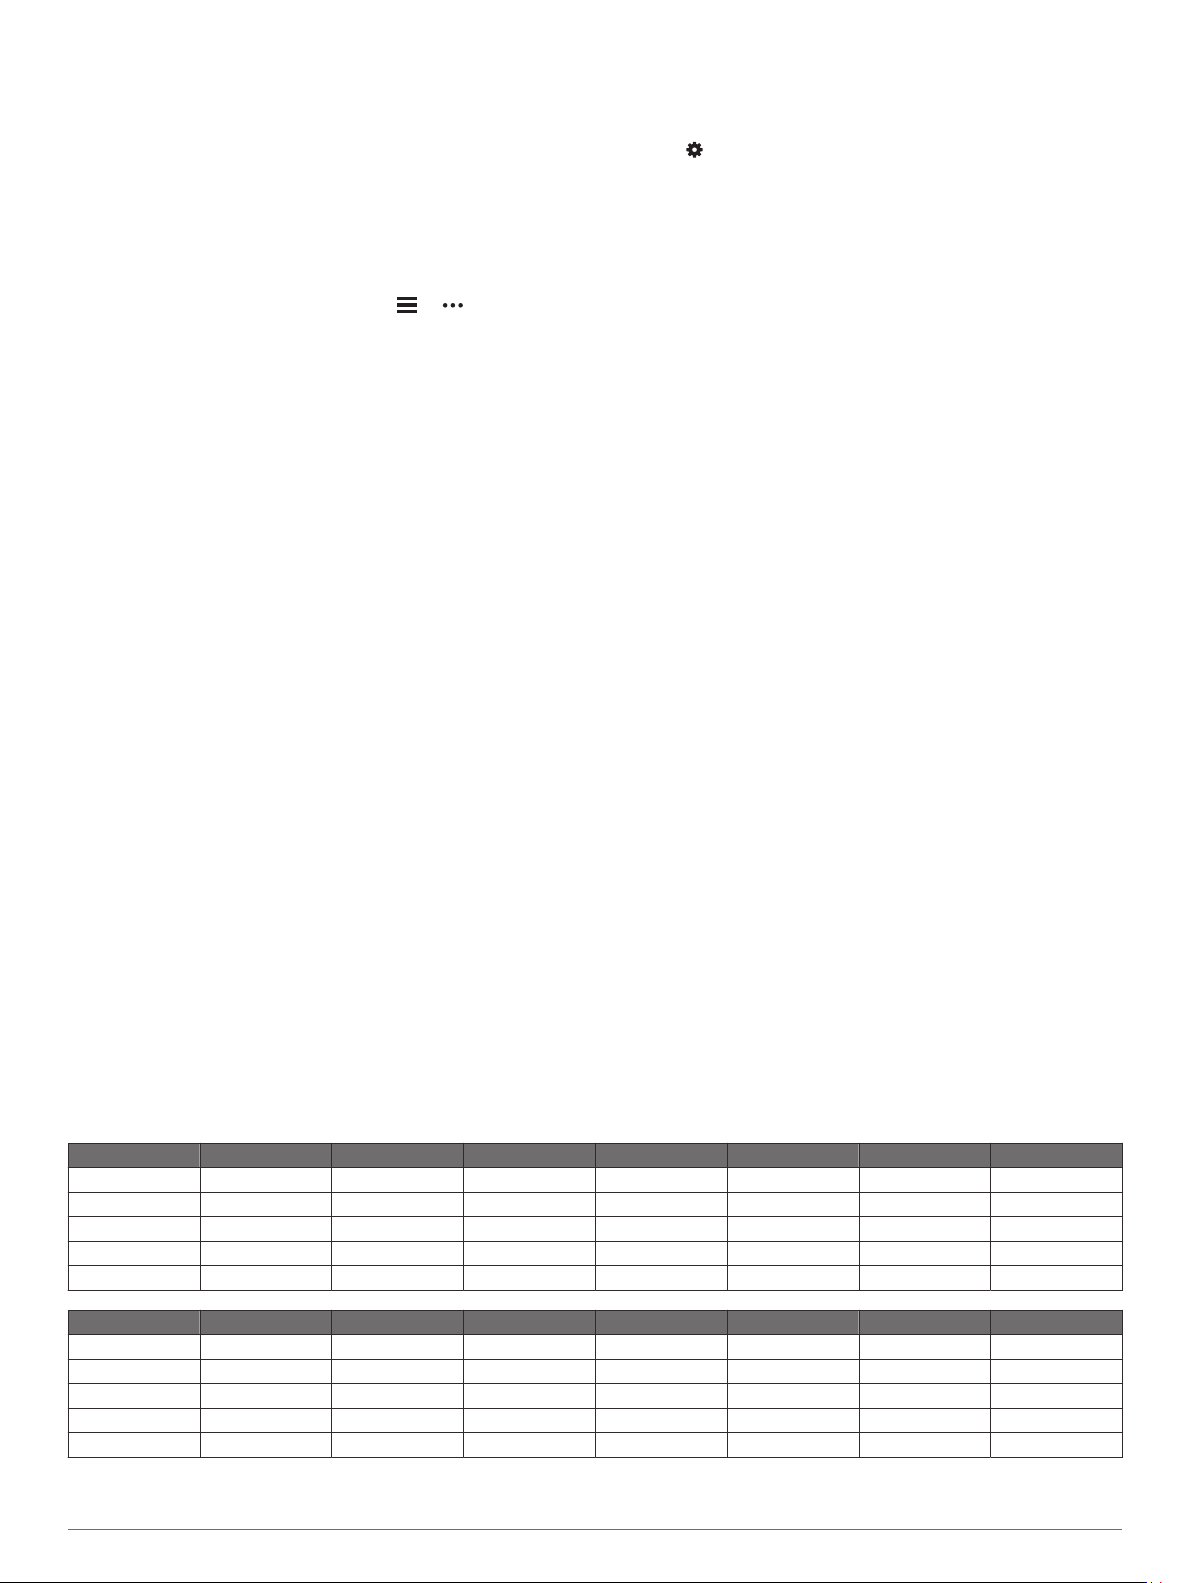
VO2 Max. Standard Ratings
These tables include standardized classifications for VO2 max. estimates by age and gender.
Males Percentile 20–29 30–39 40–49 50–59 60–69 70–79
Superior 95 55.4 54 52.5 48.9 45.7 42.1
Excellent 80 51.1 48.3 46.4 43.4 39.5 36.7
Good 60 45.4 44 42.4 39.2 35.5 32.3
Fair 40 41.7 40.5 38.5 35.6 32.3 29.4
Poor 0–40 <41.7 <40.5 <38.5 <35.6 <32.3 <29.4
Females Percentile 20–29 30–39 40–49 50–59 60–69 70–79
Superior 95 49.6 47.4 45.3 41.1 37.8 36.7
Excellent 80 43.9 42.4 39.7 36.7 33 30.9
Good 60 39.5 37.8 36.3 33 30 28.1
Fair 40 36.1 34.4 33 30.1 27.5 25.9
Poor 0–40 <36.1 <34.4 <33 <30.1 <27.5 <25.9
Data reprinted with permission from The Cooper Institute. For more information, go to www.CooperInstitute.org.
Appendix 17
Loading ...
Loading ...
Loading ...