Loading ...
Loading ...
Loading ...
37
EN
Application
CycloMeter
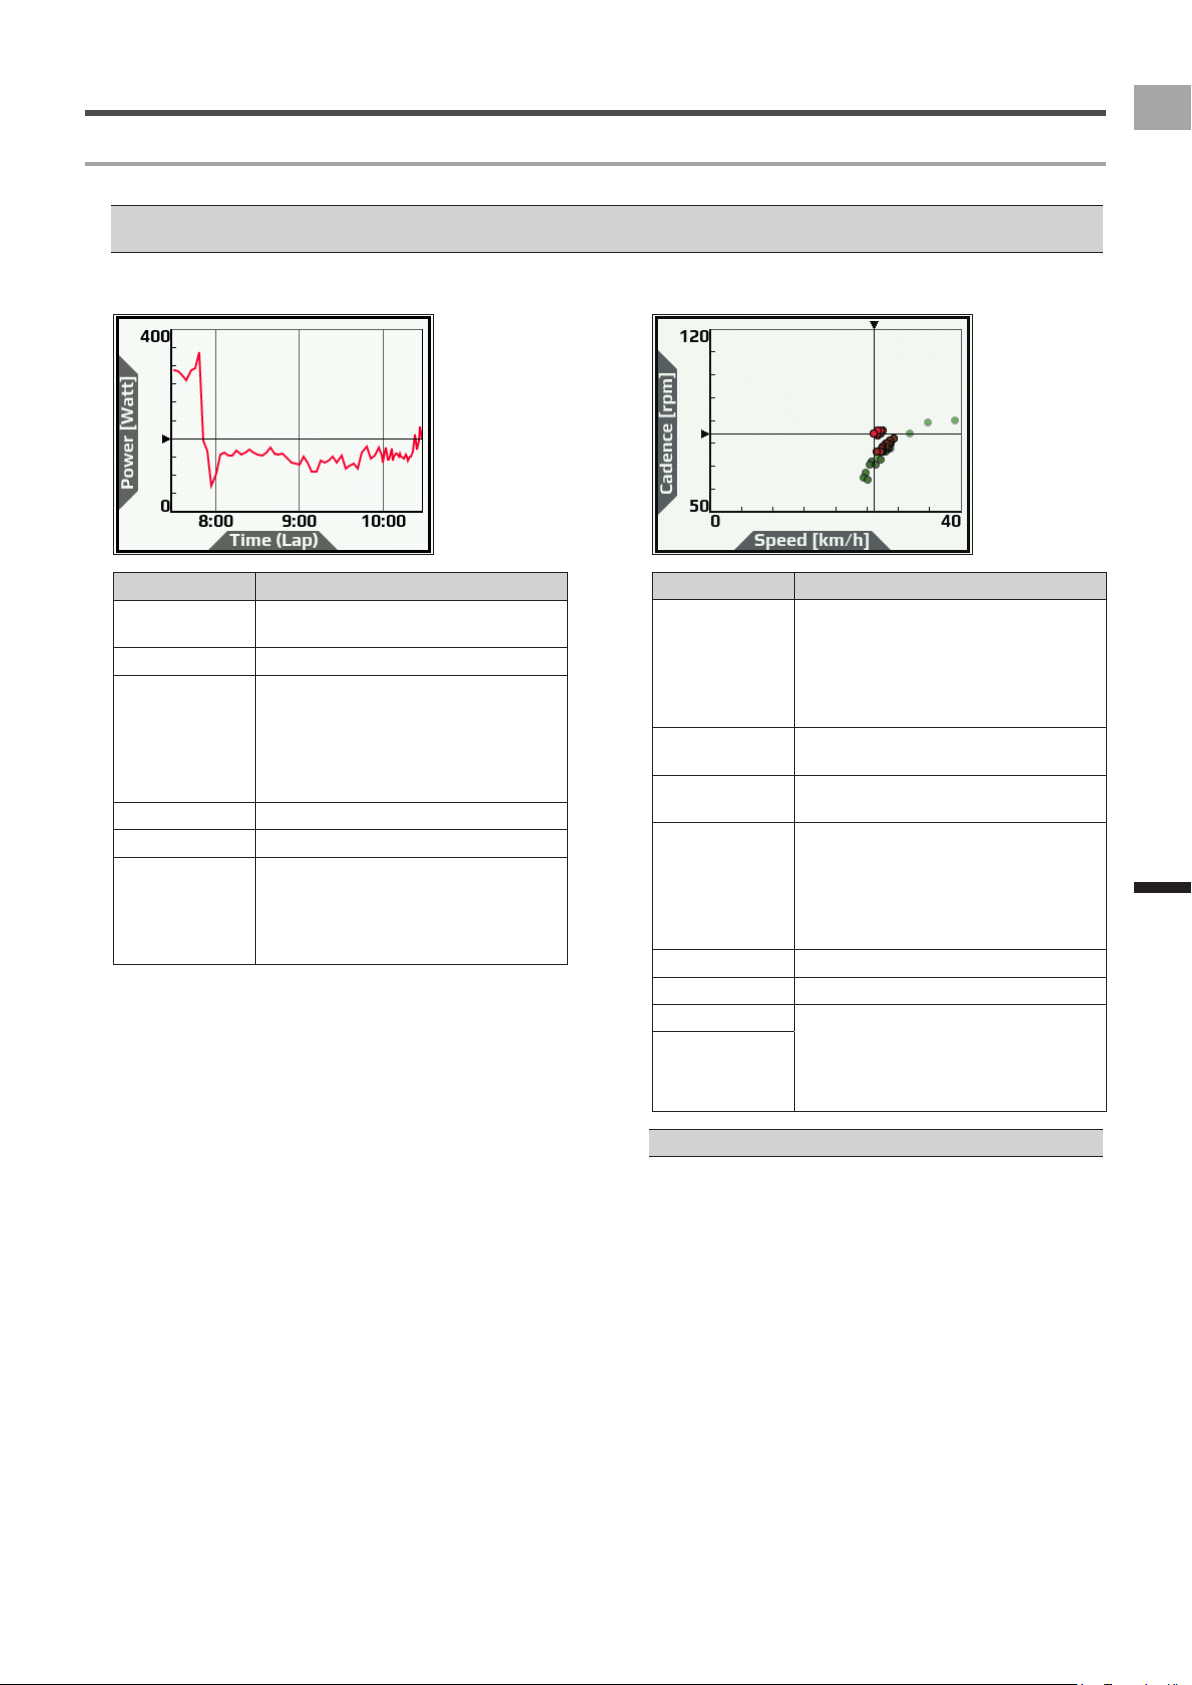
Time Series Graph
■
Item Parameter
X Axis Workout Time•
Lap Time•
X Range (Select from 1 to 120 minutes.)
Y Axis Speed•
Cadence•
HeartRate•
Power•
Altitude•
Temperature•
Y Axis Max Value (Depends on parameter set for the Y-axis.)
Y Axis Min Value (Depends on parameter set for the Y-axis.)
Line Color Red•
Green•
Blue•
Violet•
Orange•
Scatter Chart
■
Item Parameter
X Axis Speed•
Cadence•
HeartRate•
Power•
Altitude•
Temperature•
X Axis Max Value (Depends on parameter set for the
X-axis.)
X Axis Min Value (Depends on parameter set for the
X-axis.)
Y Axis Speed•
Cadence•
HeartRate•
Power•
Altitude•
Temperature•
Y Axis Max Value (Depends on parameter set for the Y-axis.)
Y Axis Min Value (Depends on parameter set for the Y-axis.)
Old Dot Color Red•
Green•
Blue•
Violet•
Orange•
New Dot Color
You cannot set the same items for X axis and Y axis.•
Graph type
There are six types of graph type data elds, which are shown below. Items that can be specied depend on the graph type.
The graph type data eld may be limited to the size of the data eld that can be inserted.•
Ü
Layout Pattern List (page 32)
Loading ...
Loading ...
Loading ...