Loading ...
Loading ...
Loading ...
22 Navigation System
Getting Started
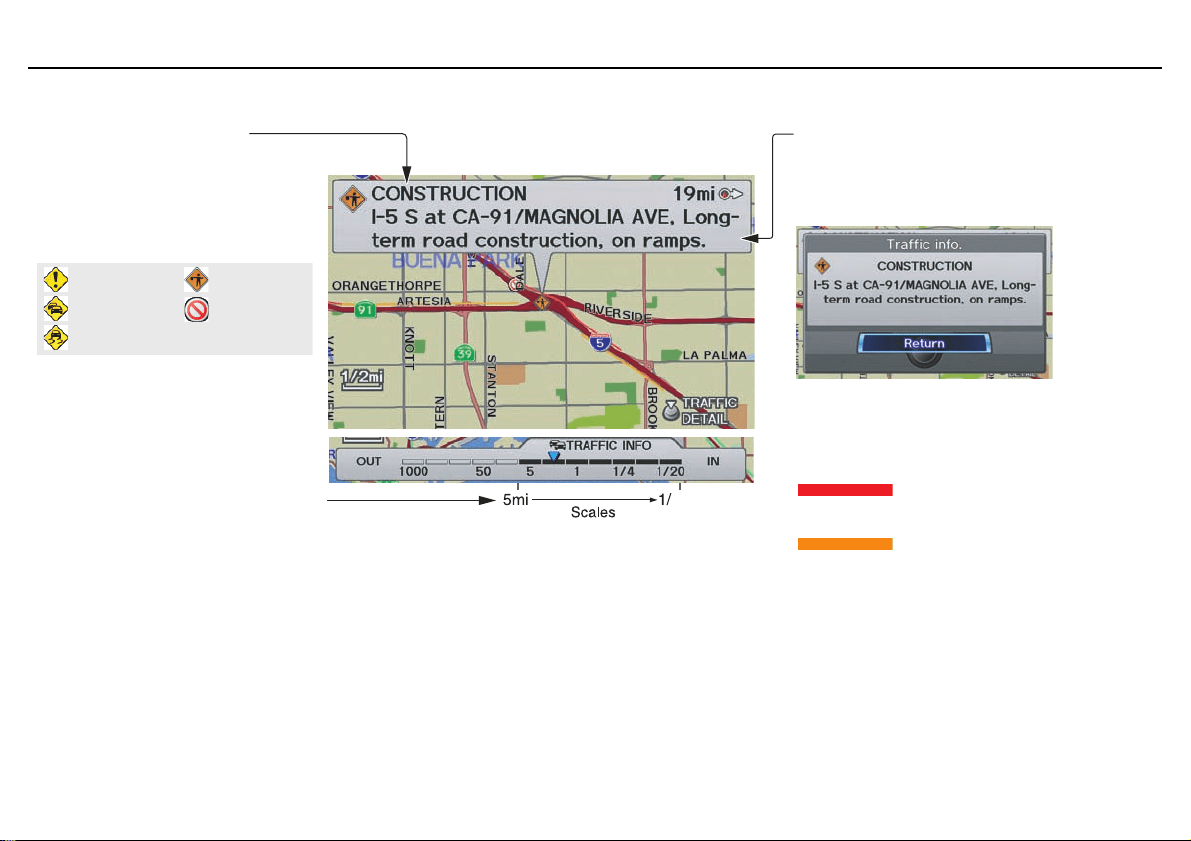
Traffic Display Legend
20mi
Incident (other)
Congestion
Weather
Construction
Road Closed
Viewing Incident Details:
To view incident details, use the
Interface Dial to position the cursor
(round red circle) over an incident
icon and push in.
Incident Icons
Incident Icon Update Details:
• Typically M–F, 5:00 AM – 7:00
PM (varies by metropolitan area)
• Continuously updated
Map Scale
Traffic flow and incident icons are
displayed on the 5 mile (8 km) or
less map scale
NOTE:
When driving to a destination on freeways that have traffic flow data, the route line is used
to display moderate and heavy traffic flow status instead of the colored bands on the side
of the road. The route line color indicates the following conditions:
• Moderate Traffic Flow - A section of the route line will change to orange.
• Heavy Traffic Flow - A section of the route line will change to red.
• Unknown Traffic Flow - A section of the route will not be bordered with traffic flow.
Hearing Incident Details:
If this screen is displayed, the system will
start reading incident details.
To view the message on the screen, push
in on the Interface Dial.
To return to current position, say or select
Return.
Traffic Flow Data
(colored lines parallel to road)
Heavy traffic (approx.)
surface: 0 - 20 mph
freeway: 0 - 25 mph
Moderate traffic (approx.)
surface: 21 - 30 mph
freeway: 25 - 52 mph
(shown for both sides of the freeway where
available)
Traffic Flow Data Update Details:
• Available 24 hours a day, 7 days a week
• Continuously updated
Loading ...
Loading ...
Loading ...