Loading ...
Loading ...
Loading ...
36
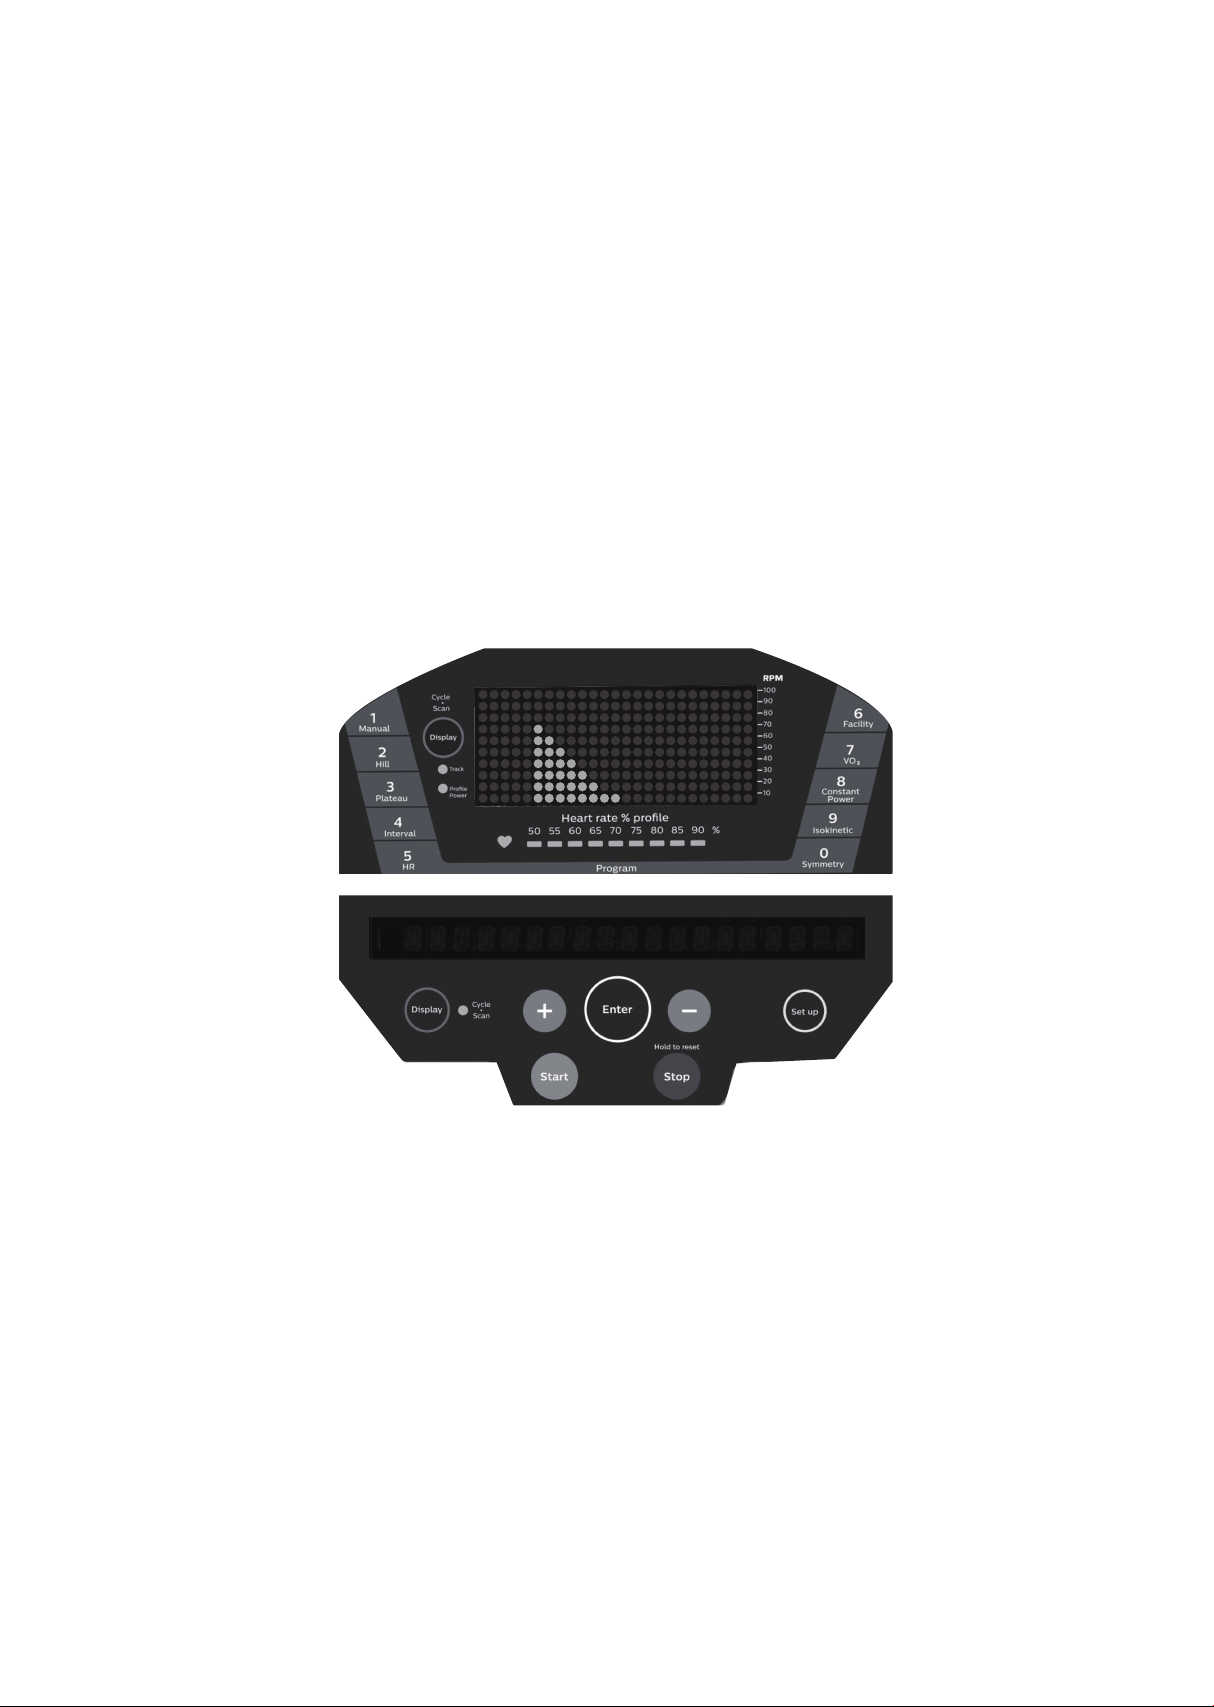
Biofeedback measurements and graph
Below is a sample picture showing the symmetry graph. In the
message window there is an average watt measurement and it is
indicating that the left leg is producing more power than the right leg,
41 vs. 34 watts. The graph reects the higher wattage of the left leg. If
the power is equal in both legs only two dots would be lit on the
bottom center of the graphic screen.
To view the Symmetry Index number press the Display key located
under the message window. The Symmetry Index number is the
percentage of dierence between the left and right leg power. If the
left and right legs are producing the same power the Symmetry Index
will be 0%.
Note: The Symmetry program employs a proprietary algorithm using
a power table and velocity calculations to generate the watt read-
ings; they are not from direct force measurements.
3
4
r g
v
w
a t t s l r
4 1
A
Loading ...
Loading ...
Loading ...