Loading ...
Loading ...
Loading ...

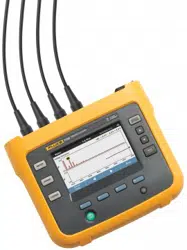
Power Logger
Function Selection Buttons
41
In the "V, A, Hz, +", "Power" and "Energy" screens, use (Show
Menu) or the cursor keys to see a list of available parameters. Use
/ to select a parameter and confirm the selection with .
Tables update with each new average calculation interval at a
maximum of every 5 seconds. Push (Refresh) to update charts
on request.
V, A, Hz, + (Load studies: A, Hz, +)
You can determine the average value measured over the logging
duration as well as minimum/maximum values with high resolution.
Note
+ available with the Logger and the PC software
0 available with the PC software
The algorithm to calculate Voltage min/max values is in accordance to
established power quality standards to detect dips, swells, and
interruptions.
Watch for values exceeding ±15 % of the nominal voltage. This is an
indicator of power quality problems.
High maximum values on Currents can be an indicator for tripping
circuit breakers.
Push
(Graph) to display the measured values in a chart. The
table on the right side of the screen shows the highest and lowest
value of the graph measured with the average calculation interval.
Triangular indicators point to the measurement value.
Power
Note
Not available on load studies without a nominal voltage.
Review the power values in tabular format and as a time chart.
Depending on the power parameter or the average value measured
over the logging duration, additional values are available:
For all power values, except PF and DPF, the three highest values
during the logging session are available. Use
(Reverse
Power/Forward Power) to toggle between Top-3 forward and Top-3
reverse values.
Push (Graph) to display the measured values in a chart. The
table on the right side of the screen shows the highest and lowest
value of the graph measured with the average calculation interval.
Triangular indicators point to the measurement value.
Parameter Min Max Resolution
A++
Sliding half-cycle (typ. 20 ms @
50 Hz, 16.7 ms @ 60 Hz)
V0+
Sliding half-cycle (typ. 10 ms @
50 Hz, 8.3 ms @ 60 Hz)
Hz + +
200 ms
AUX + +
200 ms
THD-V/THD-A 0 +
200 ms
Parameter
Min/M
ax Top 3
Top 3
Forward/Re
verse
Active Power (W)
--
+/+
Apparent Power (VA)
-+
-
Non-active Power (var)
-+
-
Power Factor
+-
-
Active Power fund. (W)
--
+/+
Apparent Power fund. (VA)
-+-
Reactive Power (var)
-- +/+
Displacement Power Factor/cosϕ +- -
w ww. . com
information@itm.com1.800.561.8187
1.888.610.7664 sales@GlobalTestSupply.com
Fluke-Direct.com
Loading ...
Loading ...
Loading ...