Loading ...
Loading ...
Loading ...
15.1.4 To Set the Output Source
The output source indicates the channel that connects the feedback output signal.
Before selecting the output source, connect the signal under test to the analog
channel output terminal of the oscilloscope.
Click or tap the
Out drop-down button to select the desired output source. The
available output channels include CH1-CH4.
15.1.5 To Set the Sweep Type
Click or tap the Sweep Type drop-down button to select “Log” or “Line”.
• Line: the frequency of the swept sine wave varies linearly with the time.
• Log: the frequency of the swept sine wave varies logarithmically with the time.
15.1.6 To Enable or Disable the Filter
Click or tap the FIR Setup on/off switch to enable or disable the digital filter.
15.1.7 To Set the Display Type
Click or tap the Display Type drop-down button to select "Wave" or "Chart".
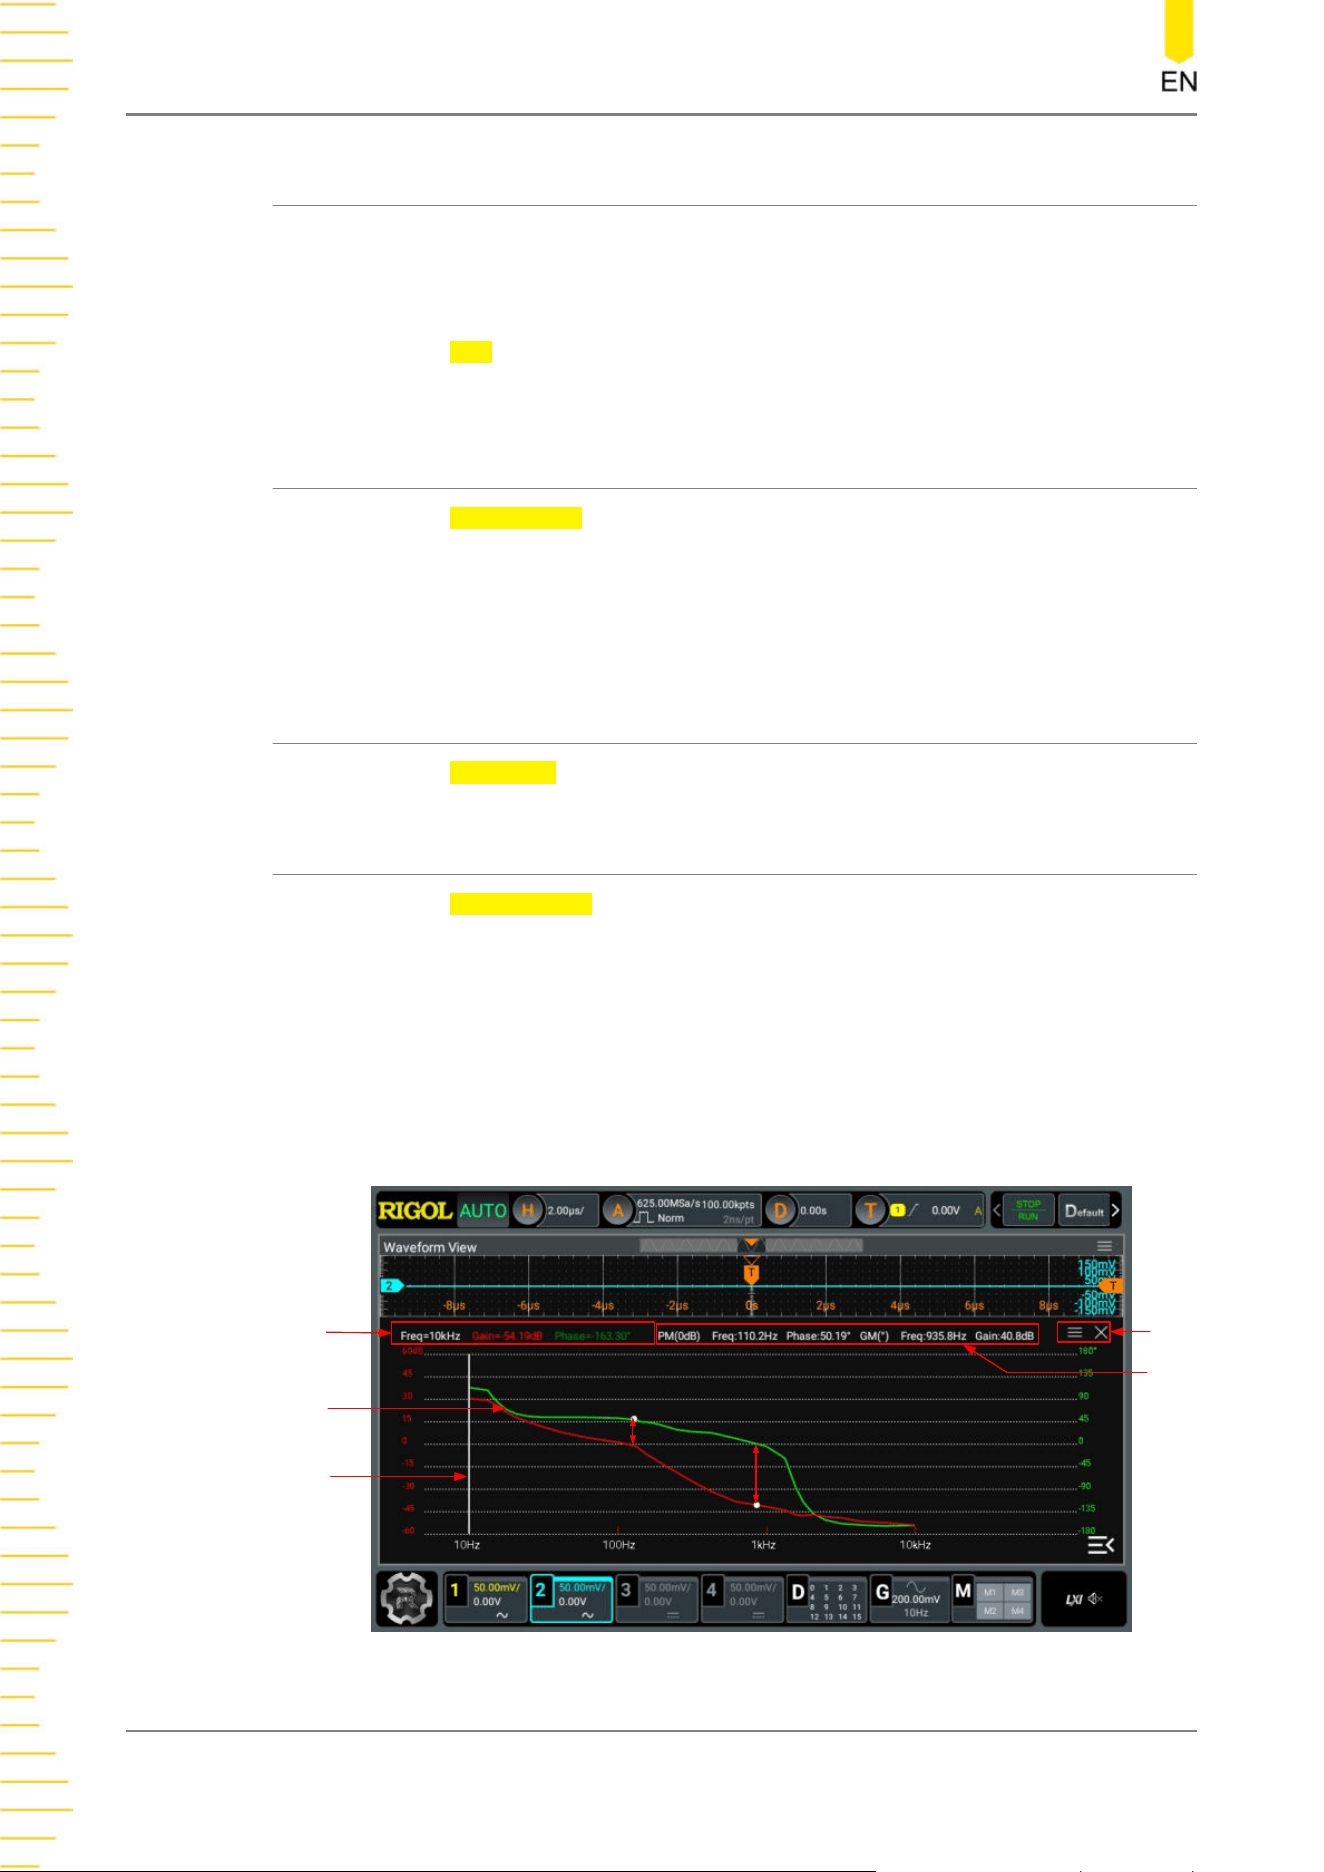
Waveform Display
The bode plot waveform display is as shown in the figure below. The X-axis value in
the bode plot represents the frequency and the Y-axis value represents the gain (red)
and phase (green). The magnitude-frequency curve (red) represents the gain between
system input and output. The phase-frequency curve (green) represents the phase
shift between system input and output.
3
4
2
1
5
PM
GM
Figure 15.3 Bode Plot Waveform Display
Bode Plot (for DHO914S and DHO924S only)
DHO900 User Guide
180
Copyright ©RIGOL TECHNOLOGIES CO., LTD. All rights reserved.
Loading ...
Loading ...
Loading ...