
Loading ...
Loading ...
Loading ...
Network Video Recorder User Manual
132
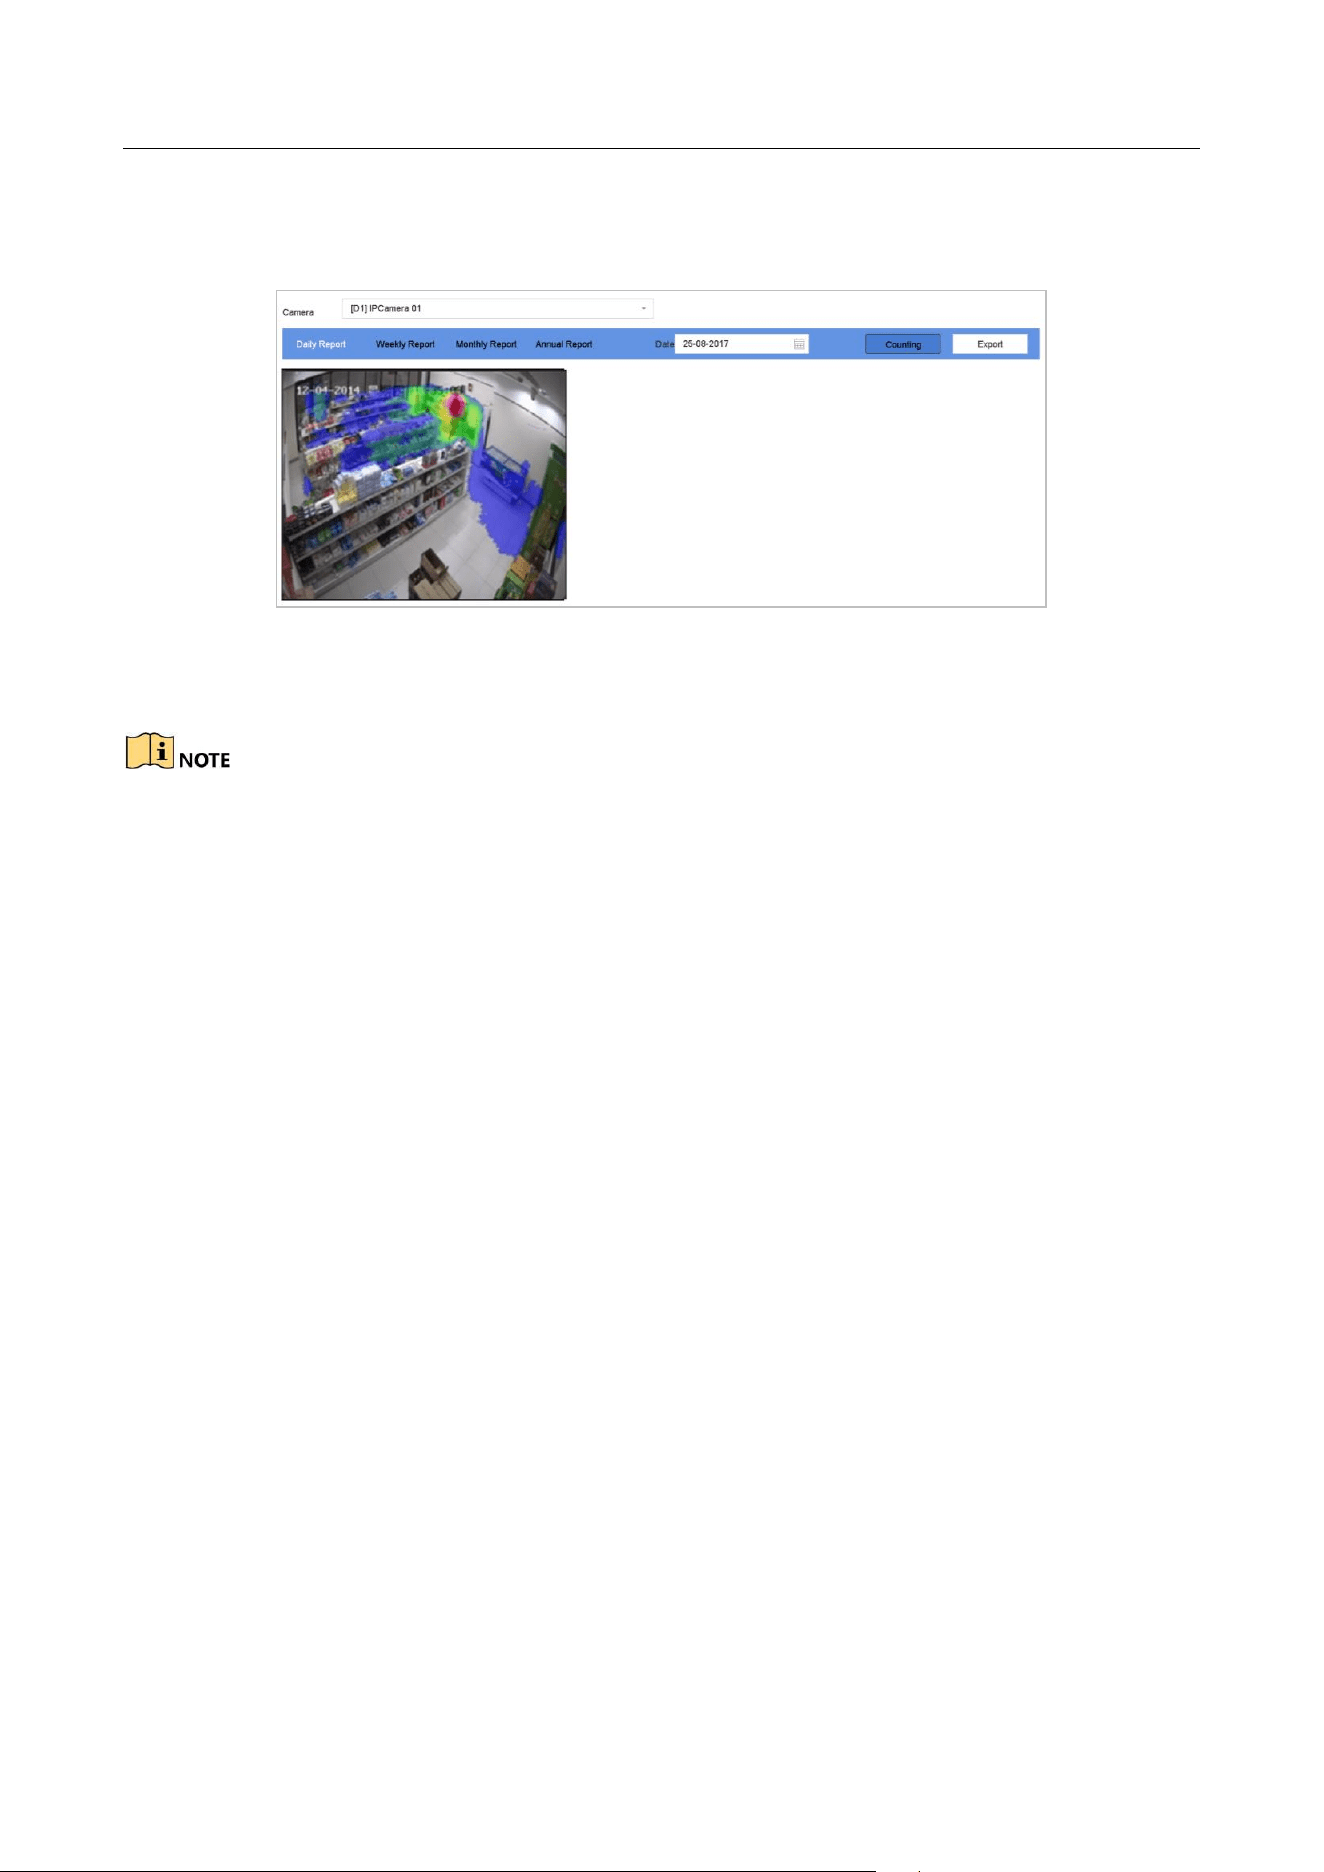
Step 3 Select the report type as Daily Report, Weekly Report, Monthly Report, or Annual Report.
Step 4 Set the Data to analyze.
Figure 13-2 Heat Map Interface
Step 5 Click Counting. Then the results displayed in graphics marked in different colors will show.
As shown in the figure above, red color block (255, 0, 0) indicates the most welcome area, and blue
color block (0, 0, 255) indicates the less-popular area.
Step 6 (Optional) Click Export to export the statistics report in excel format.
Loading ...
Loading ...
Loading ...