Loading ...
Loading ...
Loading ...
Recovery Heart Rate
If you are training with wrist-based heart rate or a compatible
chest heart rate monitor, you can check your recovery heart rate
value after each activity. Recovery heart rate is the difference
between your exercising heart rate and your heart rate two
minutes after the exercise has stopped. For example, after a
typical training run, you stop the timer. Your heart rate is
140 bpm. After two minutes of no activity or cool down, your
heart rate is 90 bpm. Your recovery heart rate is 50 bpm (140
minus 90). Some studies have linked recovery heart rate to
cardiac health. Higher numbers generally indicate healthier
hearts.
TIP: For best results, you should stop moving for two minutes
while the device calculates your recovery heart rate value. You
can save or discard the activity after this value appears.
Pulse Oximeter
The Forerunner device has a wrist-based pulse oximeter to
gauge the peripheral saturation of oxygen in your blood.
Knowing your oxygen saturation can help you determine how
your body is acclimating to high altitudes for alpine sport and
expedition.
You can manually begin a pulse oximeter reading by viewing the
pulse oximeter widget (Getting Pulse Oximeter Readings,
page 18). You can also turn on all-day readings (Turning On
All-Day Acclimation Mode, page 18). When you remain
motionless, your device analyzes your oxygen saturation and
your elevation. The elevation profile helps indicate how your
pulse oximeter readings are changing, relative to your to
elevation.
On the device, your pulse oximeter reading appears as an
oxygen saturation percentage and color on the graph. On your
Garmin Connect account, you can view additional details about
your pulse oximeter readings, including trends over multiple
days.
For more information about pulse oximeter accuracy, go to
garmin.com/ataccuracy.
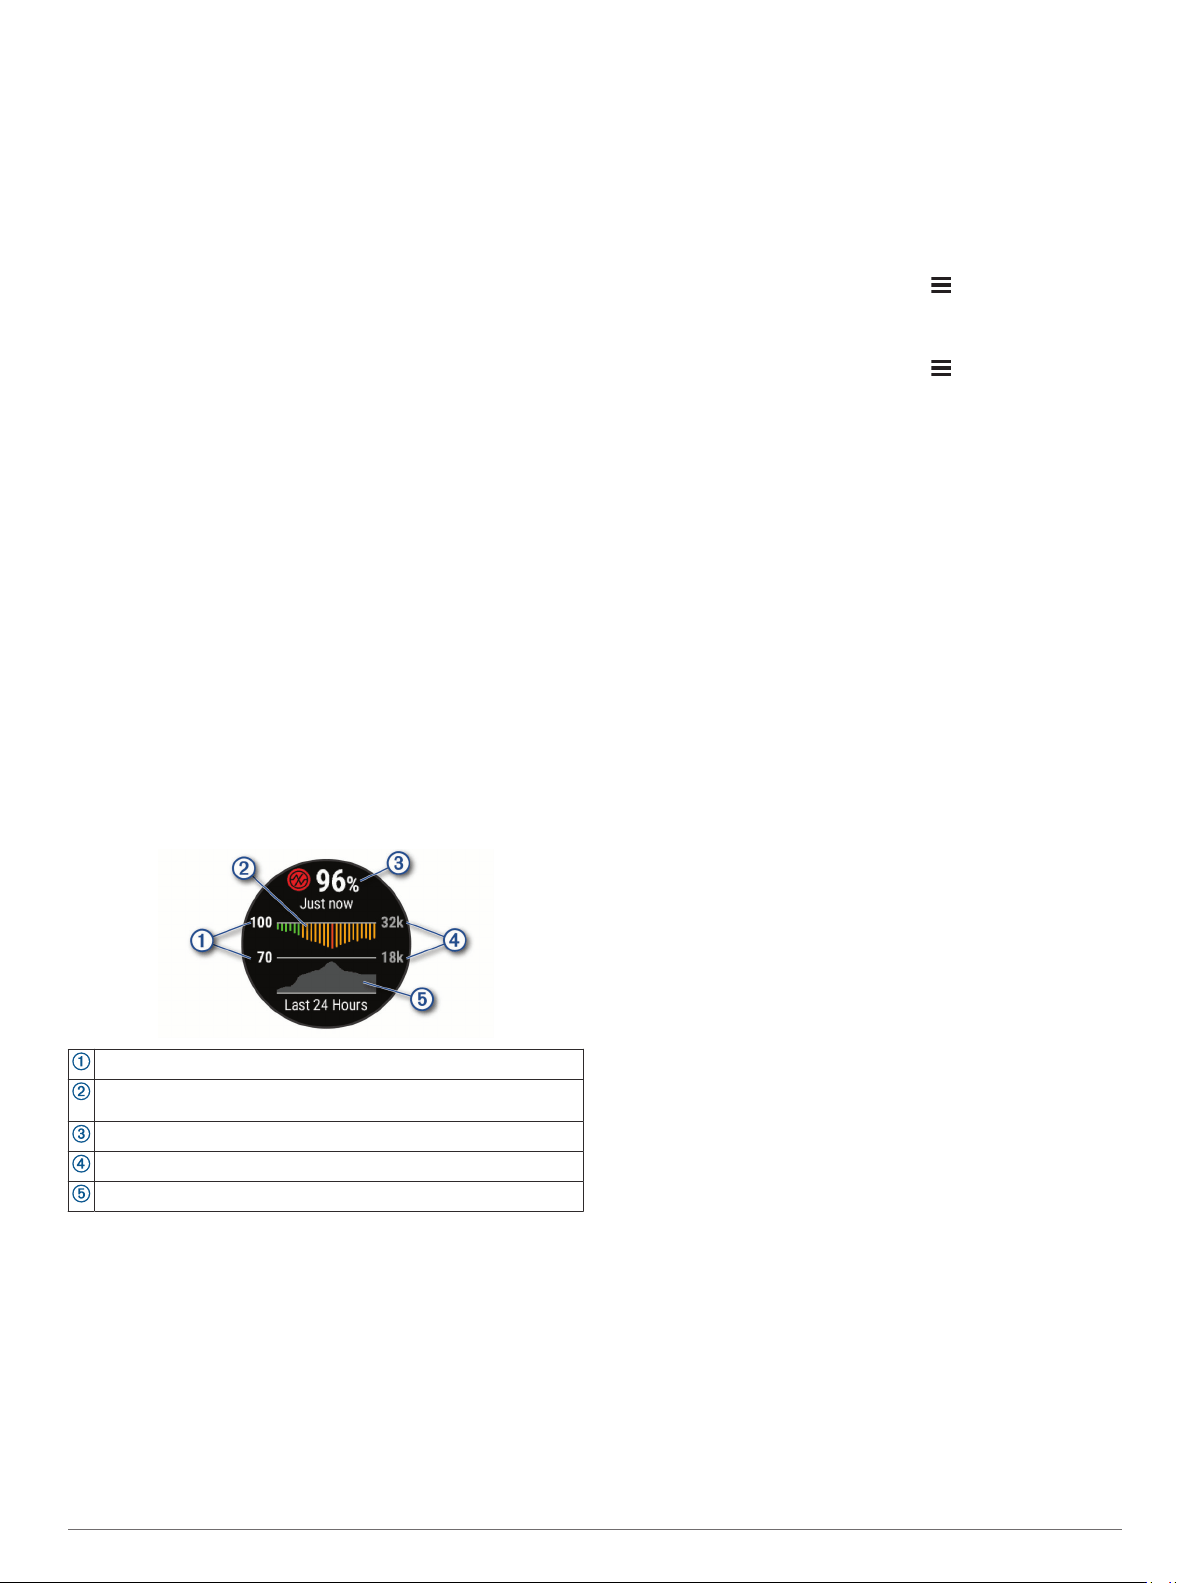
The oxygen saturation percentage scale.
A graph of your average oxygen saturation readings for the last 24
hours.
Your most recent oxygen saturation reading.
The elevation scale.
A graph of your elevation readings for the last 24 hours.
Getting Pulse Oximeter Readings
You can manually begin a pulse oximeter reading by viewing the
pulse oximeter widget. The widget displays your most recent
blood oxygen saturation percentage, a graph of your hourly
average readings for the last 24 hours, and a graph of your
elevation for the last 24 hours.
NOTE: The first time you view the pulse oximeter widget, the
device must acquire satellite signals to determine your elevation.
You should go outside, and wait while the device locates
satellites.
1
While you are sitting or inactive, select UP or DOWN to view
the pulse oximeter widget.
2
Remain stationary for up to 30 seconds.
NOTE: If you are too active for the watch to determine your
oxygen saturation, a message appears instead of a
percentage. You can check your oxygen saturation again
after several minutes of inactivity.
Turning On Pulse Oximeter Sleep Tracking
You can set your device to continuously measure your blood
oxygen saturation while you sleep.
NOTE: Unusual sleep positions can cause abnormally low
sleep-time SpO2 readings.
1
From the pulse oximeter widget, hold .
2
Select Options > Sleep Pulse Ox > Sleep Time.
Turning On All-Day Acclimation Mode
1
From the pulse oximeter widget, hold .
2
Select Options > All Day Mode > On.
The device automatically analyzes your oxygen saturation
throughout the day, when you are not moving.
NOTE: Turning on all-day acclimation mode decreases
battery life.
Tips for Erratic Pulse Oximeter Data
If the pulse oximeter data is erratic or does not appear, you can
try these tips.
• Remain motionless while the device reads your blood oxygen
saturation.
• Wear the device above your wrist bone. The device should
be snug but comfortable.
• Hold the arm wearing the device at heart level while the
device reads your blood oxygen saturation.
• Use a silicone band.
• Clean and dry your arm before putting on the device.
• Avoid wearing sunscreen, lotion, and insect repellent under
the device.
• Avoid scratching the optical sensor on the back of the device.
• Rinse the device with fresh water after each workout.
Viewing Your Heart Rate Variability Stress
Score
Before you can perform the heart rate variability (HRV) stress
test, you must put on a Garmin chest heart rate monitor and pair
it with your device (Pairing Your Wireless Sensors, page 28).
Your HRV stress score is the result of a three-minute test
performed while standing still, where the Forerunner device
analyzes heart rate variability to determine your overall stress.
Training, sleep, nutrition, and general life stress all impact how
you perform. The stress score range is 1 to 100, where 1 is a
very low stress state, and 100 is a very high stress state.
Knowing your stress score can help you decide if your body is
ready for a tough training run or yoga.
TIP: Garmin recommends that you measure your stress score
before you exercise, at approximately the same time, and under
the same conditions every day. You can view previous results
on your Garmin Connect account.
1
Select START > DOWN > HRV Stress > START.
2
Follow the onscreen instructions.
Body Battery
Your device analyzes your heart rate variability, stress level,
sleep quality, and activity data to determine your overall Body
Battery level. Like a gas gauge on a car, it indicates your
amount of available reserve energy. The Body Battery level
range is from 0 to 100, where 0 to 25 is low reserve energy, 26
to 50 is medium reserve energy, 51 to 75 is high reserve energy,
and 76 to 100 is very high reserve energy.
18 Heart Rate Features
Loading ...
Loading ...
Loading ...