Loading ...
Loading ...
Loading ...
54
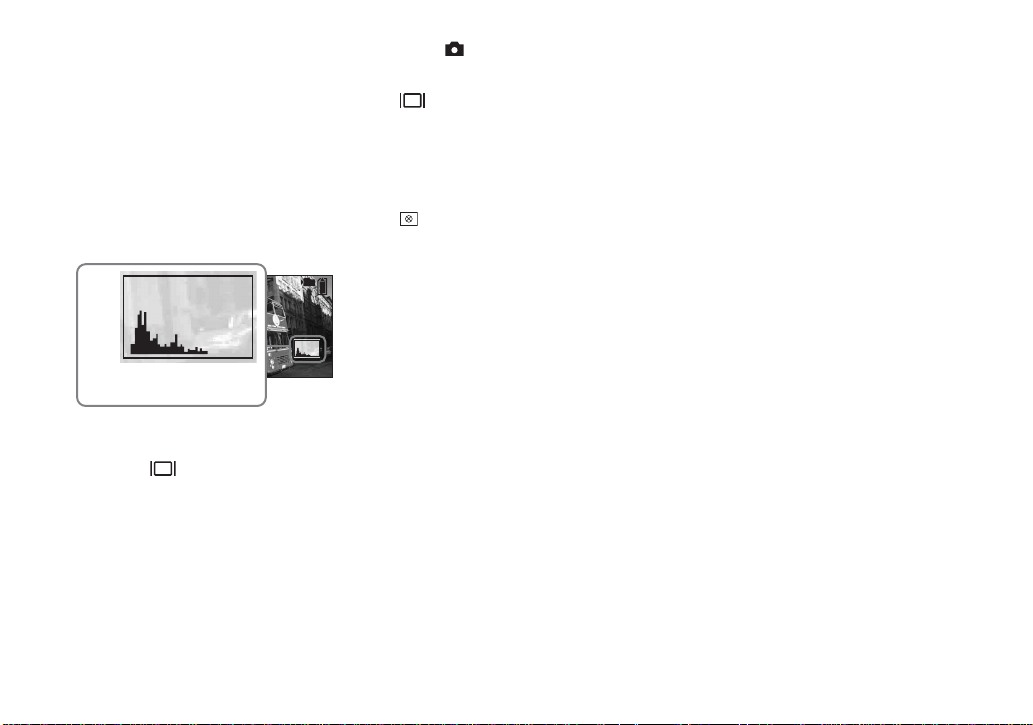
Displaying a histogram
A histogram is a graph showing the
brightness of an image. The horizontal axis
shows the brightness, and the vertical axis
shows the number of pixels. The graph
display indicates a bright image when
skewed to the right side, a dark image when
skewed to the left side.
A histogram can be used to check the
exposure when the screen is difficult to see
during recording and playback.
a Set the mode dial to P or SCN.
b Press to display the
histogram.
c Adjust the exposure based on
the histogram.
• The histogram also appears when the mode dial
is set to or M, but you cannot adjust the
exposure.
• The histogram also appears when you press
while playing back a single image
(page 36) or during Quick Review (page 24).
• The histogram does not appear in the following
cases:
– When the menu is displayed
– When using playback zoom
– When recording or playing back movies
• appears and the histogram does not appear
in the following cases:
– When recording in the digital zoom area
– When the image size is [3:2]
– When playing back Multi Burst images
– When rotating a still image
• The histogram before recording represents the
histogram of the image displayed on the LCD
screen at the time. A difference occurs in the
histogram before and after you press the shutter
button. In this case, check the histogram while
playing back a single-image or during Quick
Review.
In particular a large difference may appear in
the following cases:
– When the flash strobes
– When the shutter speed is slow or high
• The histogram may not appear for images
recorded using other cameras.
80
8M
4
FINE
101
0
EV
Number of pixels
Dark
Bright
Brightness
Loading ...
Loading ...
Loading ...