Loading ...
Loading ...
Loading ...
2
Advanced Keyboard/CALCULUS USING THE SHARP EL-9900
Copyright © 2002, Sharp Electronics Corporation. Permission is granted to photocopy for educational use only.
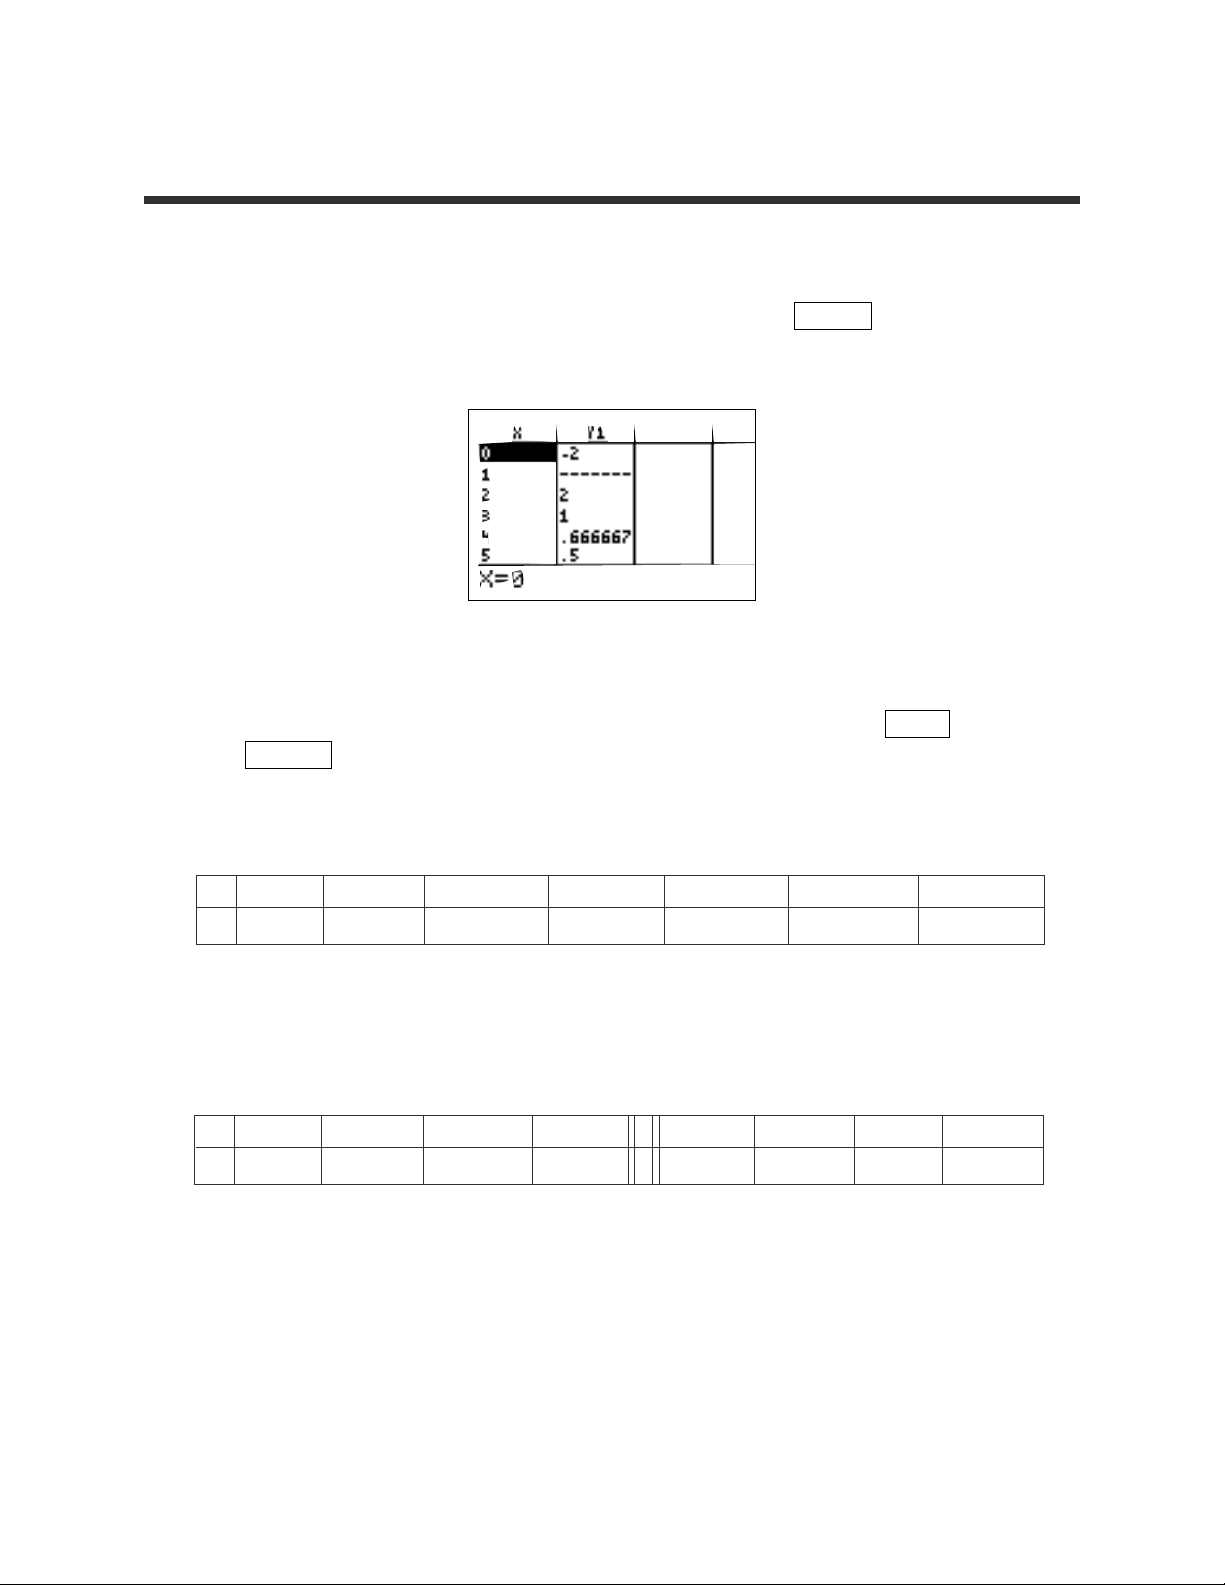
6. Tables of functional values sometimes provide more detailed information
than a graph when investigating limits. The TABLE feature will assist
you in constructing a numerical table of values. Press TABLE to access the
TABLE feature.
7. Notice the table provides the x-values and their corresponding y-values
according to Y1. You can change the table settings by pressing 2ndF
TBLSET . You can change the table start value and the table step value.
Verify the following values using the the TABLE feature.
x gets smaller and smaller→
x
-
10
-
50
-
100
-
250
-
500
-
1000
-
10,000
y
-
.18182
-
.03922
-
.01980 .00797
-
.00399
-
.00200
-
.00020
y = f(x) appears to get closer and closer to 0
This provides evidence that lim f(x) = 0.
x →∞
x approaches -1 from the left x approaches -1 from the right
x
-
1.05
-
1.01
-
1.001
-
1.0001
-
.9999
-
.999
-
.99
-
.90
y
-
.9756
-
.99502
-
.9995
-
.9999
-
1.0001
-
1.0005
-
1.0051
-
1.0526
y = f(x) gets closer and closer to
-
1 from above y = f(x) gets closer and closer to
-
1 from below
This provides evidence that lim f(x) =
-
1.
x →
-
1
EVALUATING LIMITS (continued)
Loading ...
Loading ...
Loading ...