Loading ...
Loading ...
Loading ...
15
Advanced Keyboard/STATISTICS USING THE SHARP EL-9900
Copyright © 2002, Sharp Electronics Corporation. Permission is granted to photocopy for educational use only.
Steps for calculating other regression models
1. Access the data entry screen and delete old data. Enter the following data set:
X Y
610
22 19
34 31
42 39
45 47
48 58
47 66
2. Check the data you have entered and correct any errors you may find.
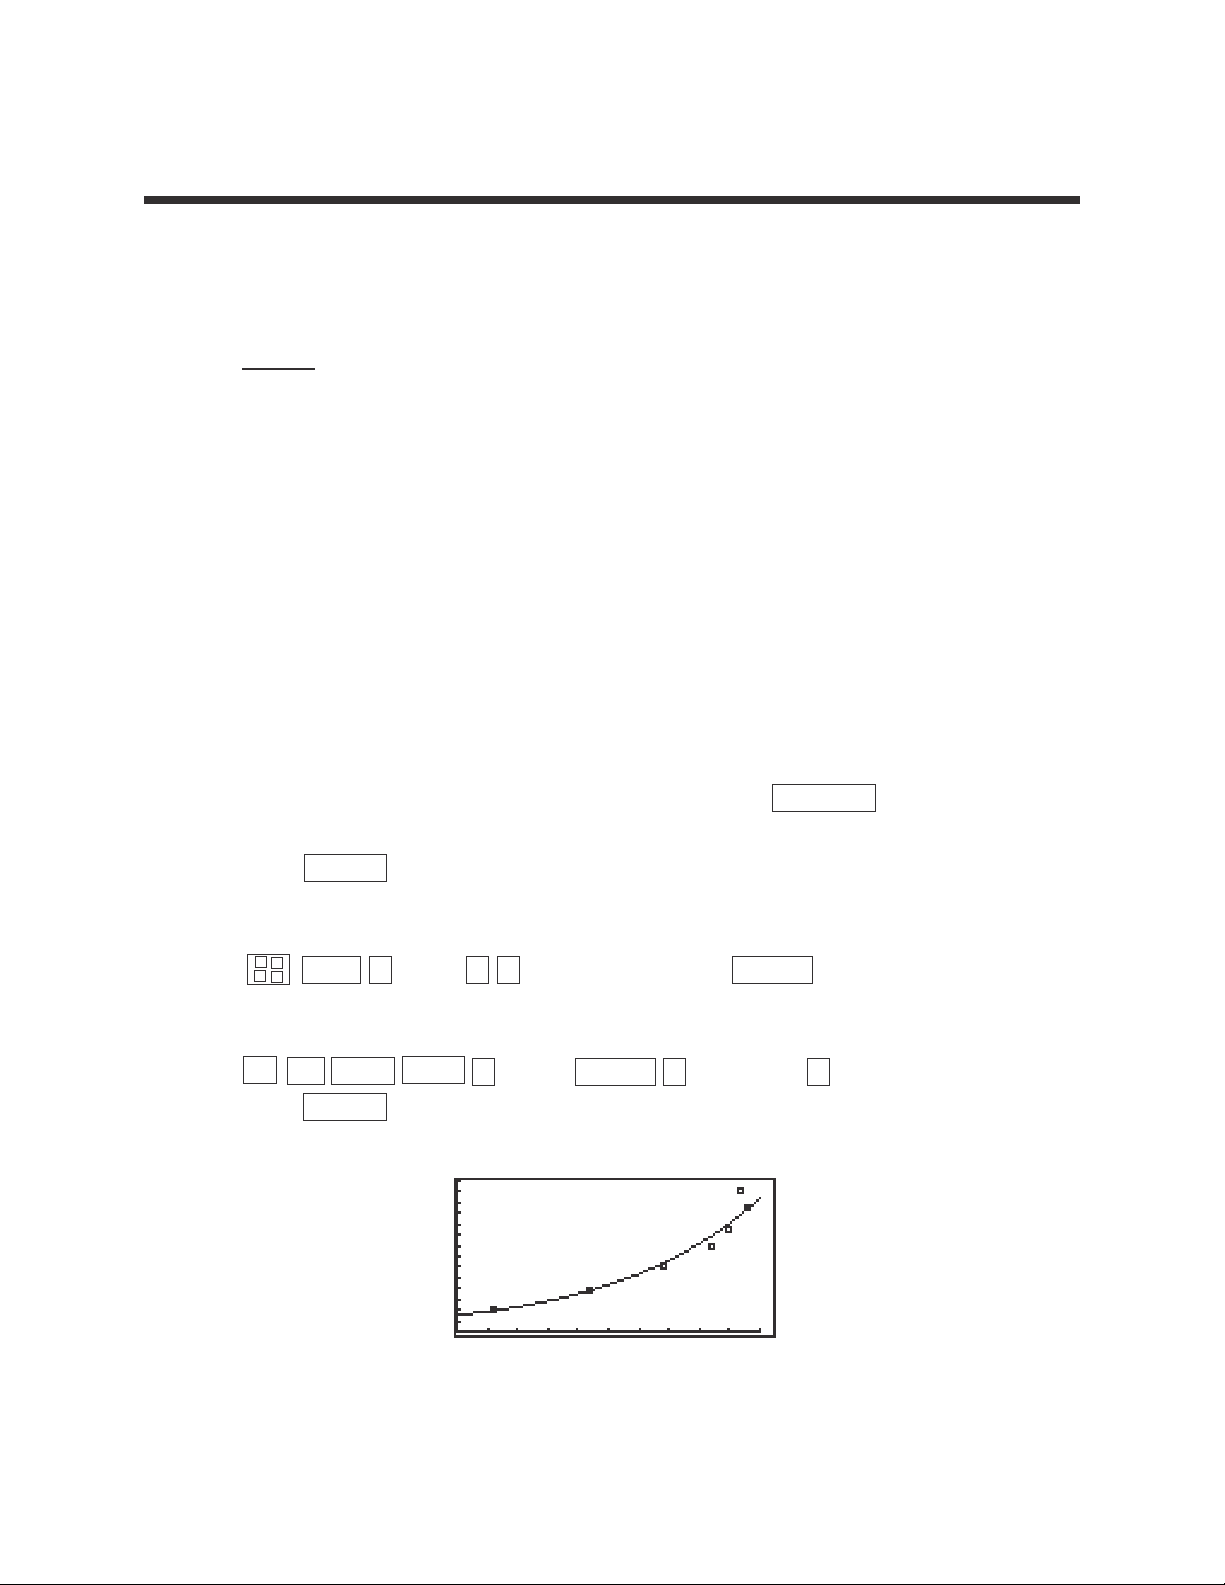
3. Set up the scatter diagram using the STAT PLOT window
4. Display the scatter diagram for the data by pressing WINDOW and
setting Xmin = 0, Xmax = 50, Xscl = 5, Ymin = 0, Ymax = 70, and Yscl = 5.
Press GRAPH to view the scatter diagram.
5. To find the best-fitting exponential curve (Y = a•e
bX
) for the data, press
STAT D (REG) 1 0 (Rg_ae
bx
) and press ENTER .
6. To view the overlay of the regression curve and the scatter diagram, press
Y= CL 2ndF VARS H (STAT) ENTER B (REGEQN) 1 (RegEqn) and
press GRAPH .
7. Repeat this process to find and view other regression models.
OTHER REGRESSIONS
×
+
–
÷
Loading ...
Loading ...
Loading ...