Loading ...
Loading ...
Loading ...
21
EN
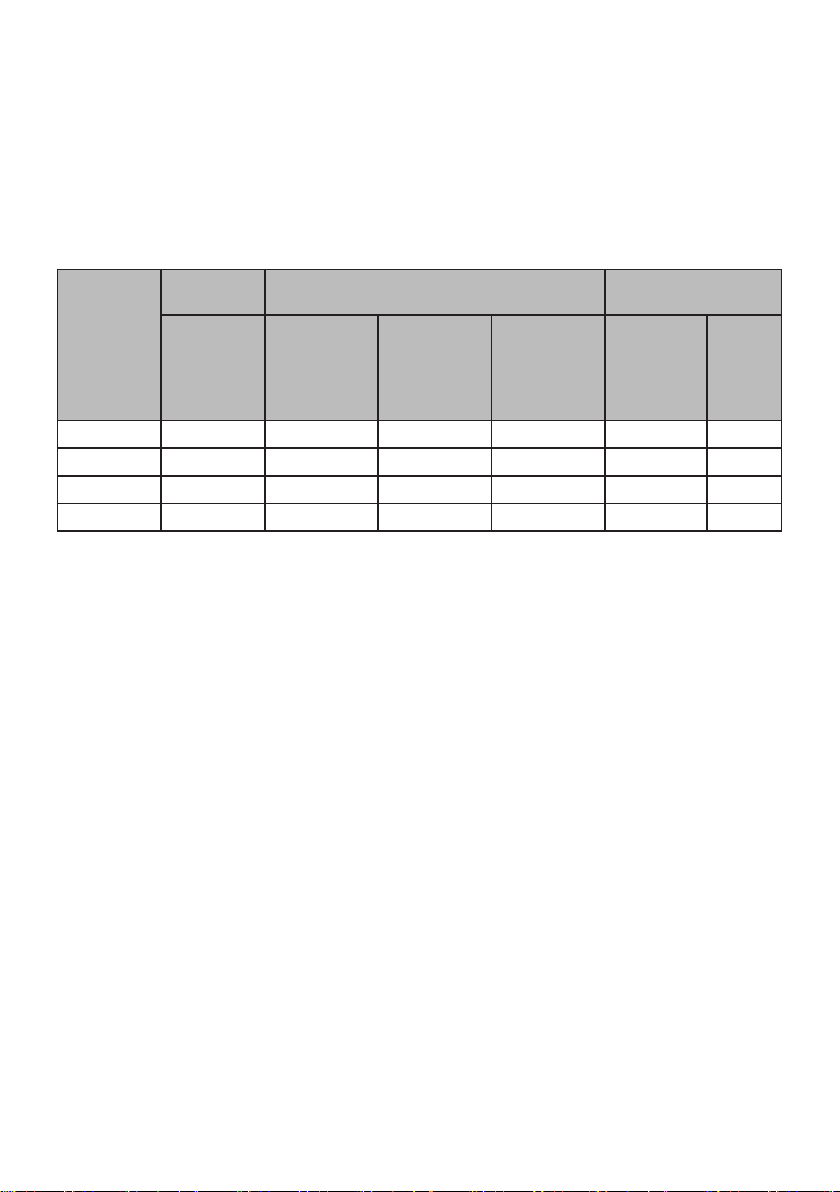
Checking Air Quality
The overall air quality is indicated by the color of the air quality light and in the status display panel.
Overview of the Air Quality
The overall air quality is calculated based on the concentrations of odors and particulates in the air and is
categorized into 4 levels depending on these concentrations.
Colour
Overall Air
Quality
Concentration of PM (μg/m
3
)
Concentration of
Odour
State
PM10
(coarse
particles)
PM2.5
(fine particles)
PM1.0
(particles with
a diameter
between 1.0
and 2.5 μm)
State Level
Red Very Bad 255 or more 56 or more 56 or more Very strong 4
Orange Bad 155 ~ 254 36 ~ 55 36 ~ 55 Strong 3
Yellow Normal 55 ~ 154 13 ~ 35 13 ~ 35 Normal 2
Green Good 54 or less 12 or less 12 or less Weak 1
NOTE
• The color of the air quality light is based on the worst level detected, whether odors or particulates.
• PM (particulate matter) concentration is displayed in increments of 1 unit, from 8 to 999. PM
concentration values are based on the data sheet provided by the sensor manufacturer.
• The PM concentration measurement was tested using LG Electronics’ standard test materials.
• Differences in PM concentration values may be the result of different methods of measuring or
differences in the actual PM concentration levels.
− If the PM concentration is high, there may be a larger difference between the displayed concentration
and the actual concentration.
Loading ...
Loading ...
Loading ...