Loading ...
Loading ...
Loading ...
UTD2000 Series User Manual
17
Chapter II Vertical System
UTD2000 series DSO provides two analog input channels, each channel has an
independent vertical menu. Each channel for UTD2000 series DSO can be set
independently through the vertical system menu. After pressing CH1 or CH2 function key,
the system shall display function menu of CH1 or CH2 channel. See Table 2-1 below for
description.
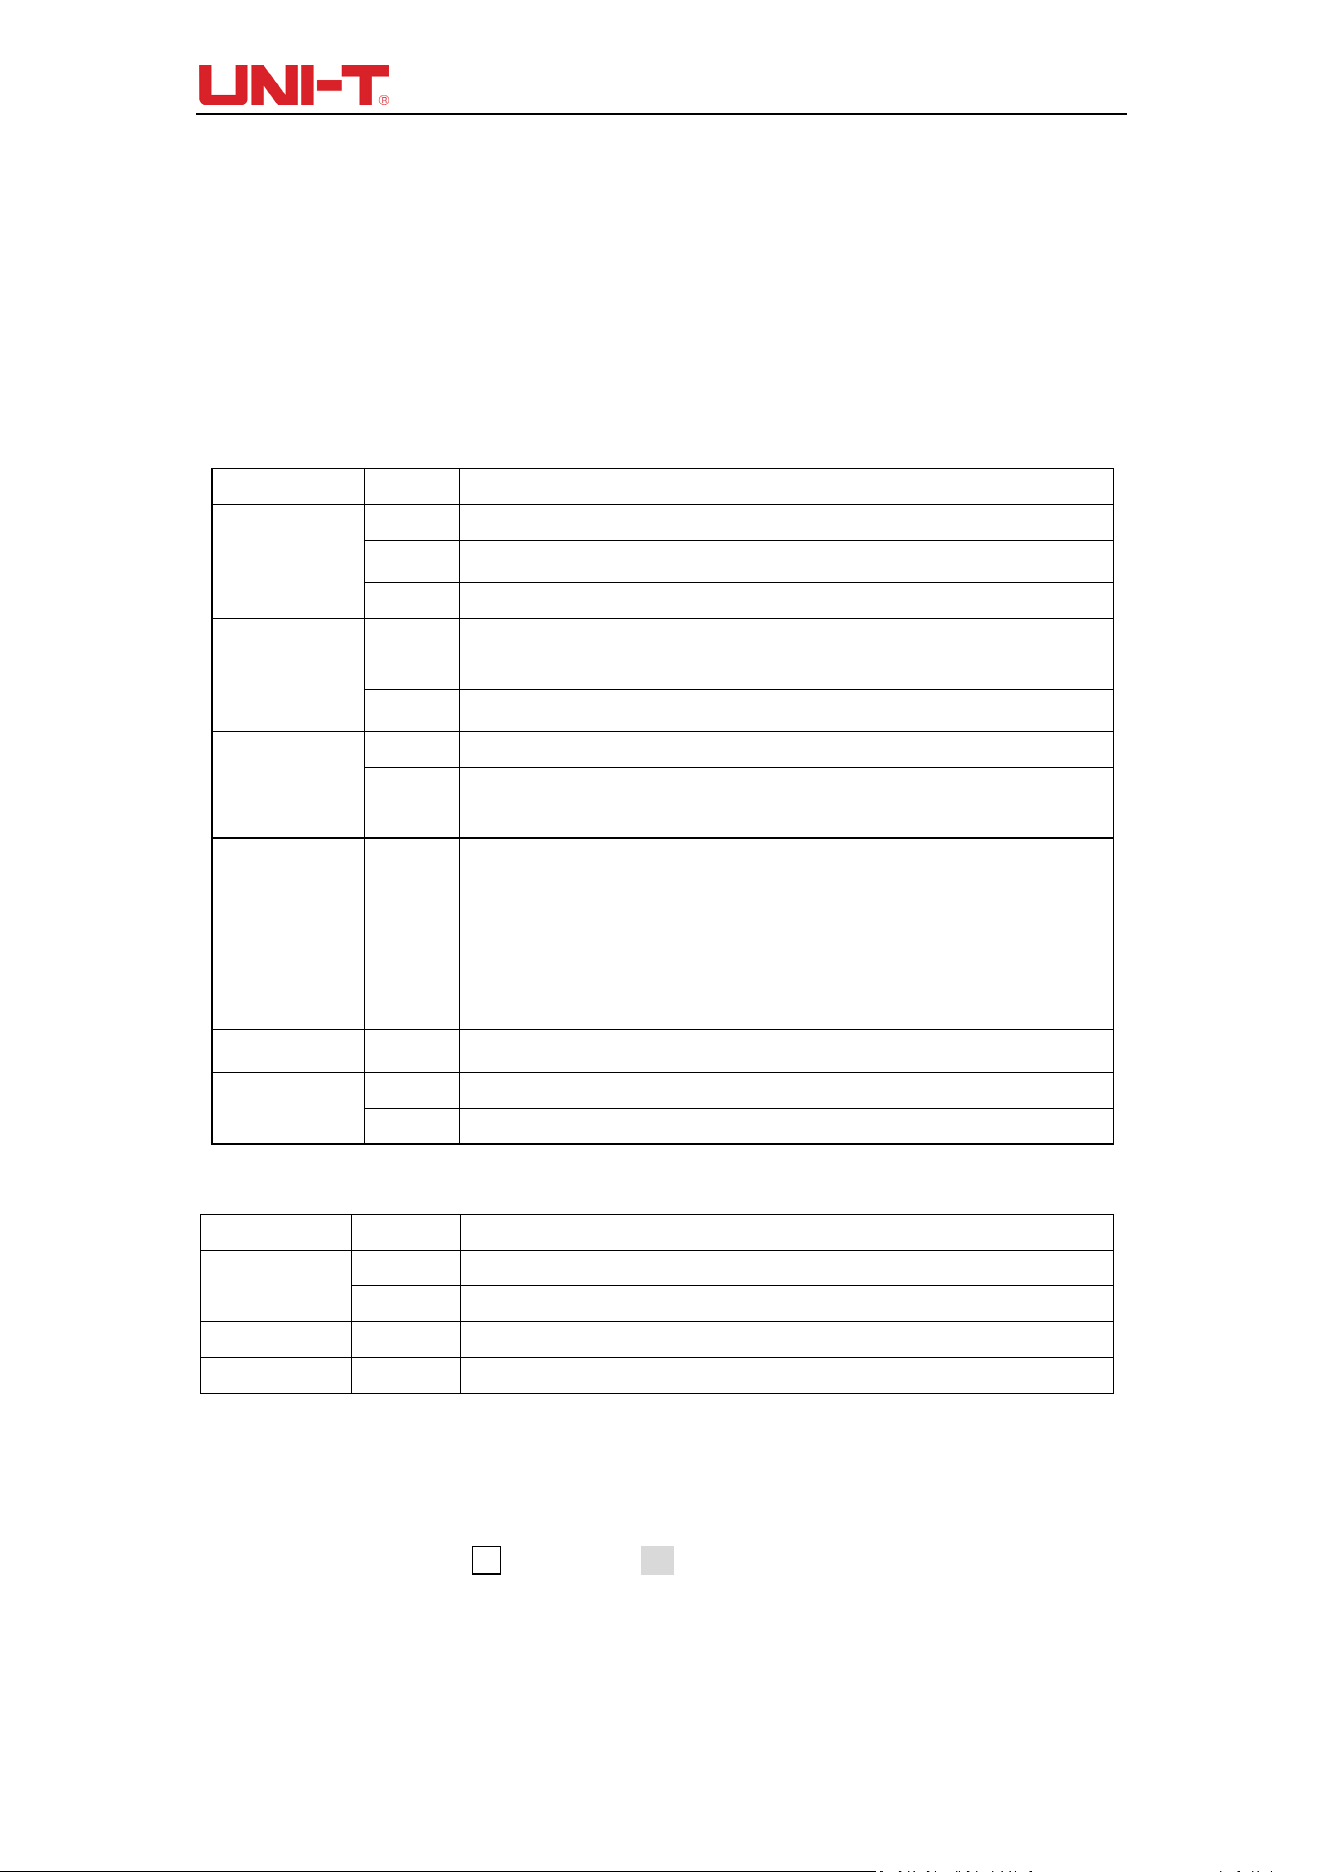
Table 2-1 Channel Menu (Page 1)
Function Menu Setting Description
Coupling
AC Block the DC component of input signal.
DC Pass through DC and AC components of input signal.
GND Display grounding level (Input signal is not disconnected).
BW Limit
20MHz
Limit bandwidth to 20MHz to reduce high-frequency component of detected
signal.
Full BW Turn off bandwidth limit, the DSO runs through full bandwidth.
Volts/Div
Coarse Set vertical scale of current channel based on 1-2-5 scale.
Fine
Fine Volts/Div is within the range of coarse Volts/Div setting, set the vertical scale
of current channel based on 1% step of current Volts/Div scale.
Probe
0.01×
0.02×
...
100×
1000×
Based on probe attenuation coefficient, you select a value to ensure the
consistency of vertical scale reading and actual displayed waveform so that you
don’t need to calculate by multiplying the probe attenuation coefficient.
Next page
——
Go to next page
Invert
ON Activate reverse function of waveform. Waveform will be displayed reversely.
OFF Waveform is displayed normally.
Table 2-2 Channel Menu (Page 2)
Function Menu Setting Description
Invert OFF Display normal waveform
ON Display waveform invert
Unit V,A Display the unit of current channel range
Back to
——
Go back to previous page
2.1 Setting coupling channel
If the measured signal connected to the CH1 channel is a sinusoidal signal containing DC
component. If your press F1 to select as AC coupling, to set the CH1 into AC coupling
mode. Then the DC component of the measured signal is blocked. Waveform display is
shown in figure below.
Loading ...
Loading ...
Loading ...