Loading ...
Loading ...
Loading ...

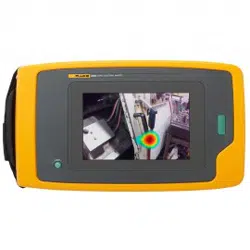
Acoustic Imager
Before You Start
3
Terms to Know
Use this section to familiarize yourself with these terms that are
unique to this Imager and sound pressure measurements.
Decibel (dB) Sound Pressure Level (SPL). The unit of
measurement for changes in sound pressure. Decibel indicates
the level of the sound (against the reference level of sound in air)
and is expressed in terms of dB SPL.
Distance to target. The distance between the leak source and the
acoustic sensor is critical. The decibel level that the Imager can
measure decreases with the square of this distance.
Sound Frequency / Acoustic Frequency / Frequency Band.
The frequency corresponds to the number of sound vibrations/
second and is expressed as Hertz (Hz) or thousands of Hertz
(kHz).
Frequency Range
Audible (up to 20 kHz). The range that human ear can
perceive sounds.
Ultrasonic (above 20 kHz). Certain issues (leaks, electrical
discharges, mechanical failures) generate sound signatures in
ultrasonic ranges. The human ear cannot perceive the
ultrasonic range that the Imager can detect.
Frequency Selection / Frequency Filtering / Selected
Frequency Band. Select a frequency band for measurement and
visualization of sound. When a frequency band is selected, any
sound outside of that range is filtered and not shown or
considered.
Background Noise. The noise that exists in the surroundings that
the microphone sensors detect along with the sound sources of
possible leaks. Generally, background noise is higher in lower
frequencies. In noisy environments, select higher frequencies to
help discriminate the leak sounds.
Frequency / Spectrum Graph. A graphic chart on the display
shows the level of sound detected in all frequency ranges.
Frequency Spike. Spike in the frequency / spectrum graph that
indicates a significant source of sound in this specific frequency. If
this spike is within the frequency selection, the Imager visualizes
the source on the display.
Field-of-View (FOV). What is detected by the Imager at a
particular position and orientation in space.
Sound Reflections. Sound signals reflect, particularly on smooth
and flat surfaces. In certain conditions, the Imager shows on the
display a hot spot from the source of noise and one or more hot
spots from reflections.
LeakQ™. LeakQ is a capture mode that estimates the size of a
leak. LeakQ Scale is a scale from 0 to 10 that is an indication of
the leak size. The Imager calculates a value based on the
measured dB SPL level and the distance value. The distance
value is automatically determined or you input a value with the
display keyboard.
1.888.610.7664 sales@GlobalTestSupply.com
Fluke-Direct
.com
Loading ...
Loading ...
Loading ...