Loading ...
Loading ...
Loading ...
SIGLENT
6.4.1.3 Spectrum + Spectrogram
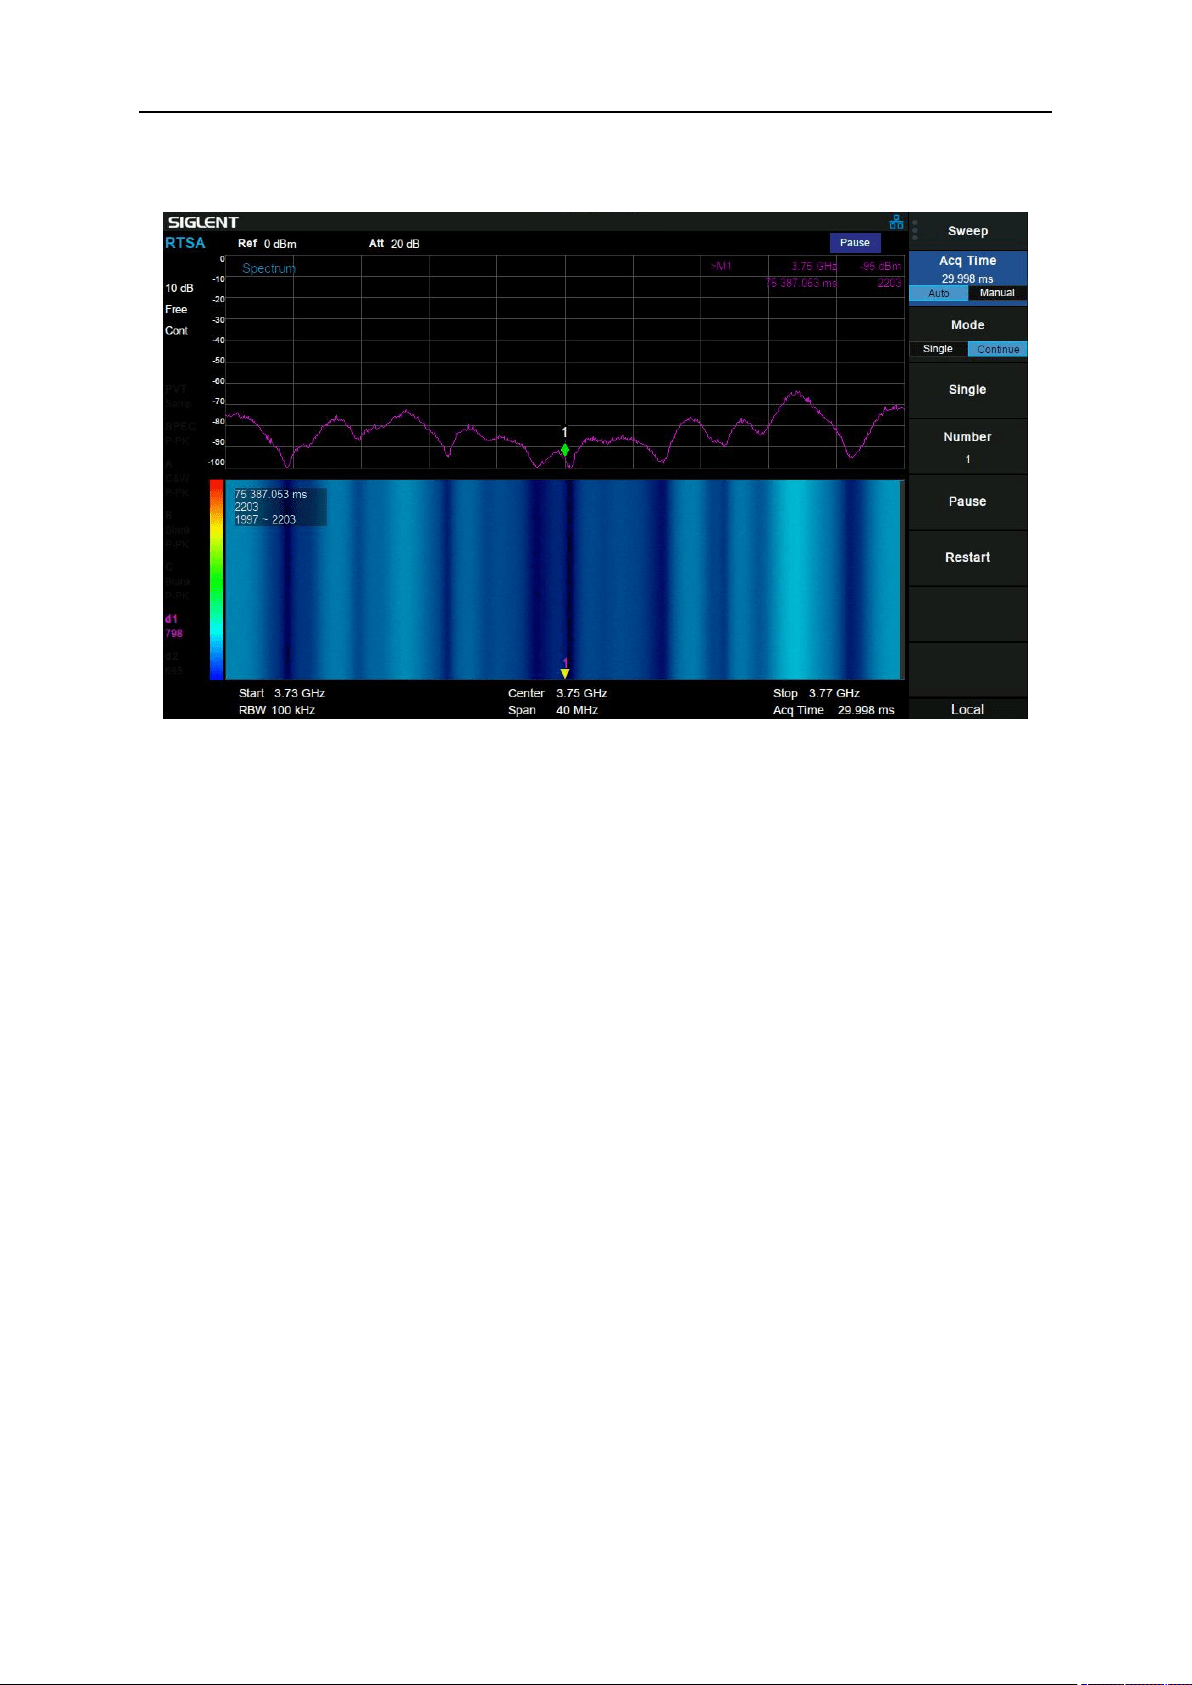
Figure 6-3 Spectrum
The top view is spectrum which is shown as amplitude vs. frequency, and the bottom view si spectrogram
which is mentioned above.
The display trace (D1, D2) specified in the spectrogram is shown as amplitude vs. frequency in the
spectrum.
The traces in the spectrum view will refresh when modifying the positions on the y-axis of display trace
(D1, D2) in the spectrogram, and when the frequency of the maker in the spectrum view is modified, the
maker in the spectrogram will also move on the x-axis.
Loading ...
Loading ...
Loading ...