Loading ...
Loading ...
Loading ...
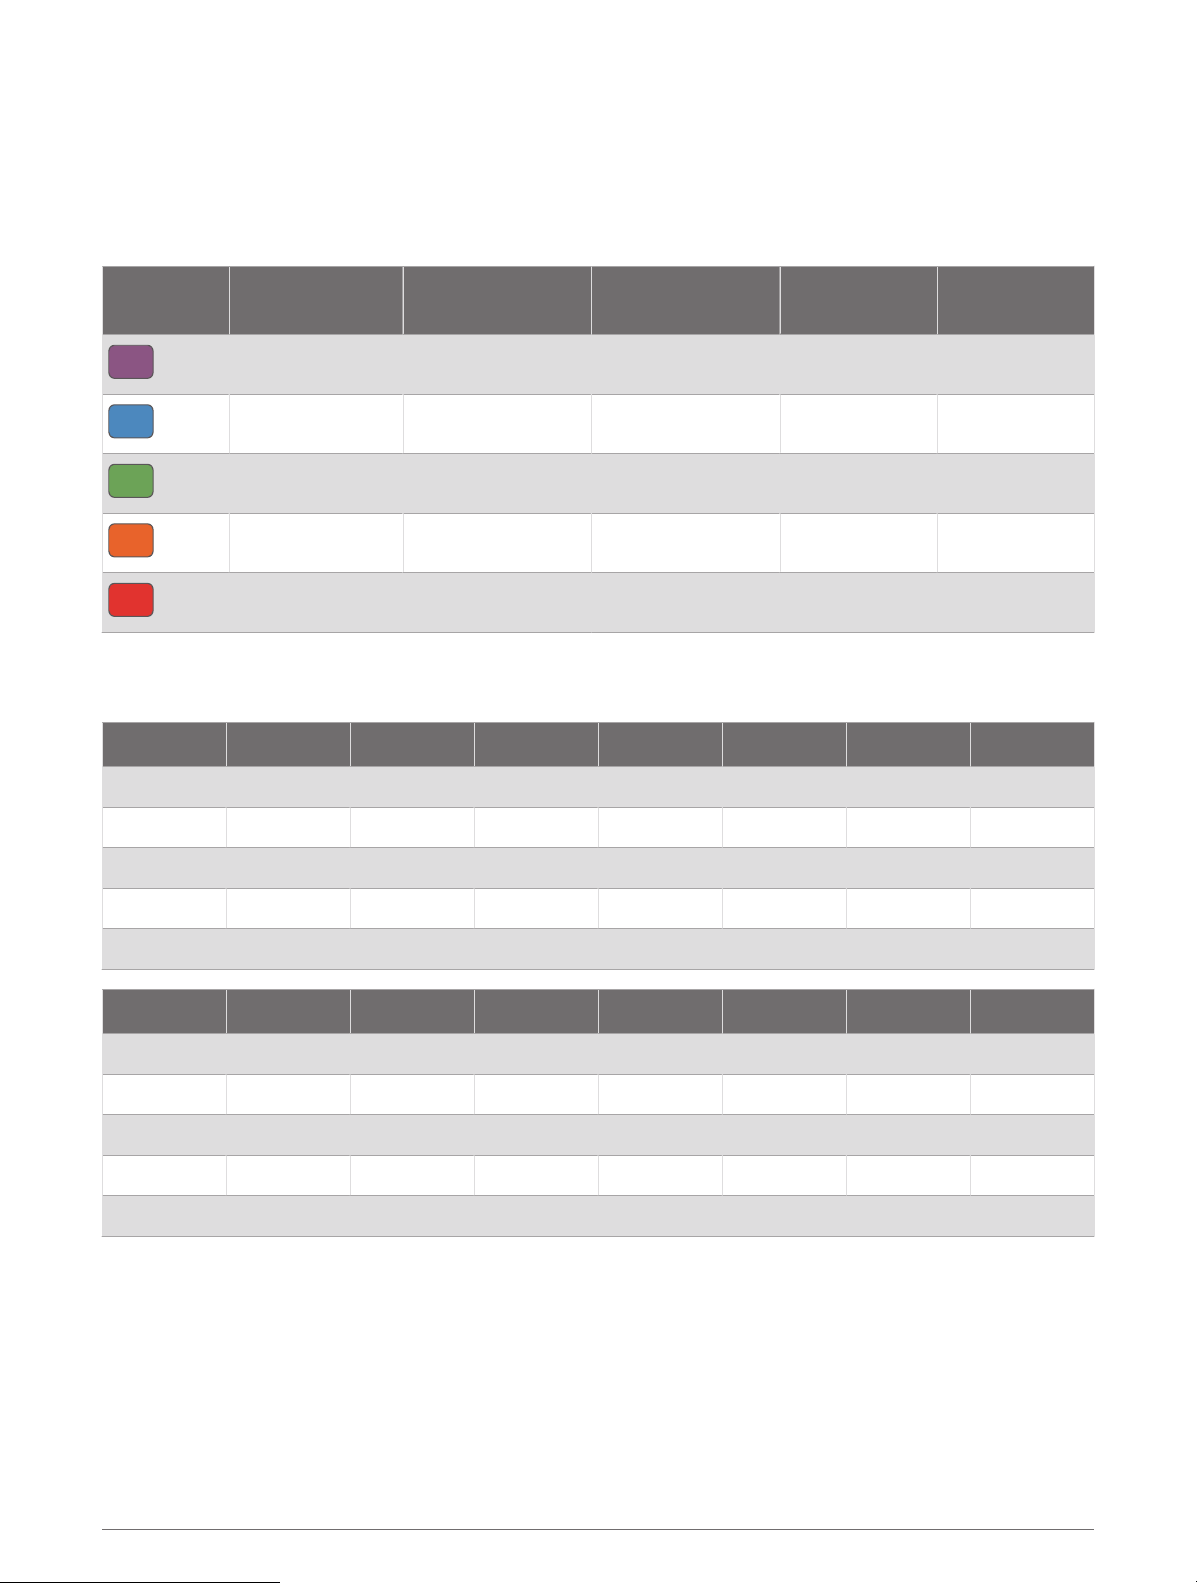
Vertical Oscillation and Vertical Ratio Data
NOTE: In the Garmin Connect activity, the running dynamics data displays as colored graphs.
The data ranges for vertical oscillation and vertical ratio are slightly different depending on the sensor and
whether it is positioned at the chest (HRM-Pro, HRM-Run
™
, or HRM-Tri
™
accessories) or at the waist (Running
Dynamics Pod accessory).
Color Zone
Percentile in
Zone
Vertical Oscillation
Range at Chest
Vertical Oscillation
Range at Waist
Vertical Ratio at
Chest
Vertical Ratio at
Waist
Purple
>95 <6.4 cm <6.8 cm <6.1% <6.5%
Blue
70–95 6.4–8.1 cm 6.8–8.9 cm 6.1–7.4% 6.5–8.3%
Green
30–69 8.2–9.7 cm 9.0–10.9 cm 7.5–8.6% 8.4–10.0%
Orange
5–29 9.8–11.5 cm 11.0–13.0 cm 8.7–10.1% 10.1–11.9%
Red
<5 >11.5 cm >13.0 cm >10.1% >11.9%
VO2 Max. Standard Ratings
These tables include standardized classifications for VO2 max. estimates by age and gender.
Males Percentile 20–29 30–39 40–49 50–59 60–69 70–79
Superior 95 55.4 54 52.5 48.9 45.7 42.1
Excellent 80 51.1 48.3 46.4 43.4 39.5 36.7
Good 60 45.4 44 42.4 39.2 35.5 32.3
Fair 40 41.7 40.5 38.5 35.6 32.3 29.4
Poor 0–40 <41.7 <40.5 <38.5 <35.6 <32.3 <29.4
Females Percentile 20–29 30–39 40–49 50–59 60–69 70–79
Superior 95 49.6 47.4 45.3 41.1 37.8 36.7
Excellent 80 43.9 42.4 39.7 36.7 33 30.9
Good 60 39.5 37.8 36.3 33 30 28.1
Fair 40 36.1 34.4 33 30.1 27.5 25.9
Poor 0–40 <36.1 <34.4 <33 <30.1 <27.5 <25.9
Data reprinted with permission from The Cooper Institute. For more information, go to www.CooperInstitute.org.
102 Appendix
Loading ...
Loading ...
Loading ...