Loading ...
Loading ...
Loading ...
Trainer Power: The simulated power from resistance force applied by an indoor trainer.
Trainer Resistance: The resistance force applied by an indoor trainer.
Training Effect Gauge: The impact of the current activity on your aerobic and anaerobic fitness levels.
Training Stress Score: The Training Stress Score
™
for the current activity.
Velocity Made Good: The speed at which you are closing on a destination along a route. You must be
navigating for this data to appear.
Vertical Dist. to Dest.: The elevation distance between your current position and the final destination. You must
be navigating for this data to appear.
Vertical Oscillation: The amount of bounce while you are running. The vertical motion of your torso, measured
in centimeters for each step.
Vertical Oscillation Gauge: A color gauge showing the amount of bounce while you are running.
Vertical Ratio: The ratio of vertical oscillation to stride length.
Vertical Ratio Gauge: A color gauge showing the ratio of vertical oscillation to stride length.
Vertical Speed: The rate of ascent or descent over time.
Vertical Speed to Target: The rate of ascent or descent to a predetermined altitude. You must be navigating for
this data to appear.
Work: The accumulated work performed (power output) in kilojoules.
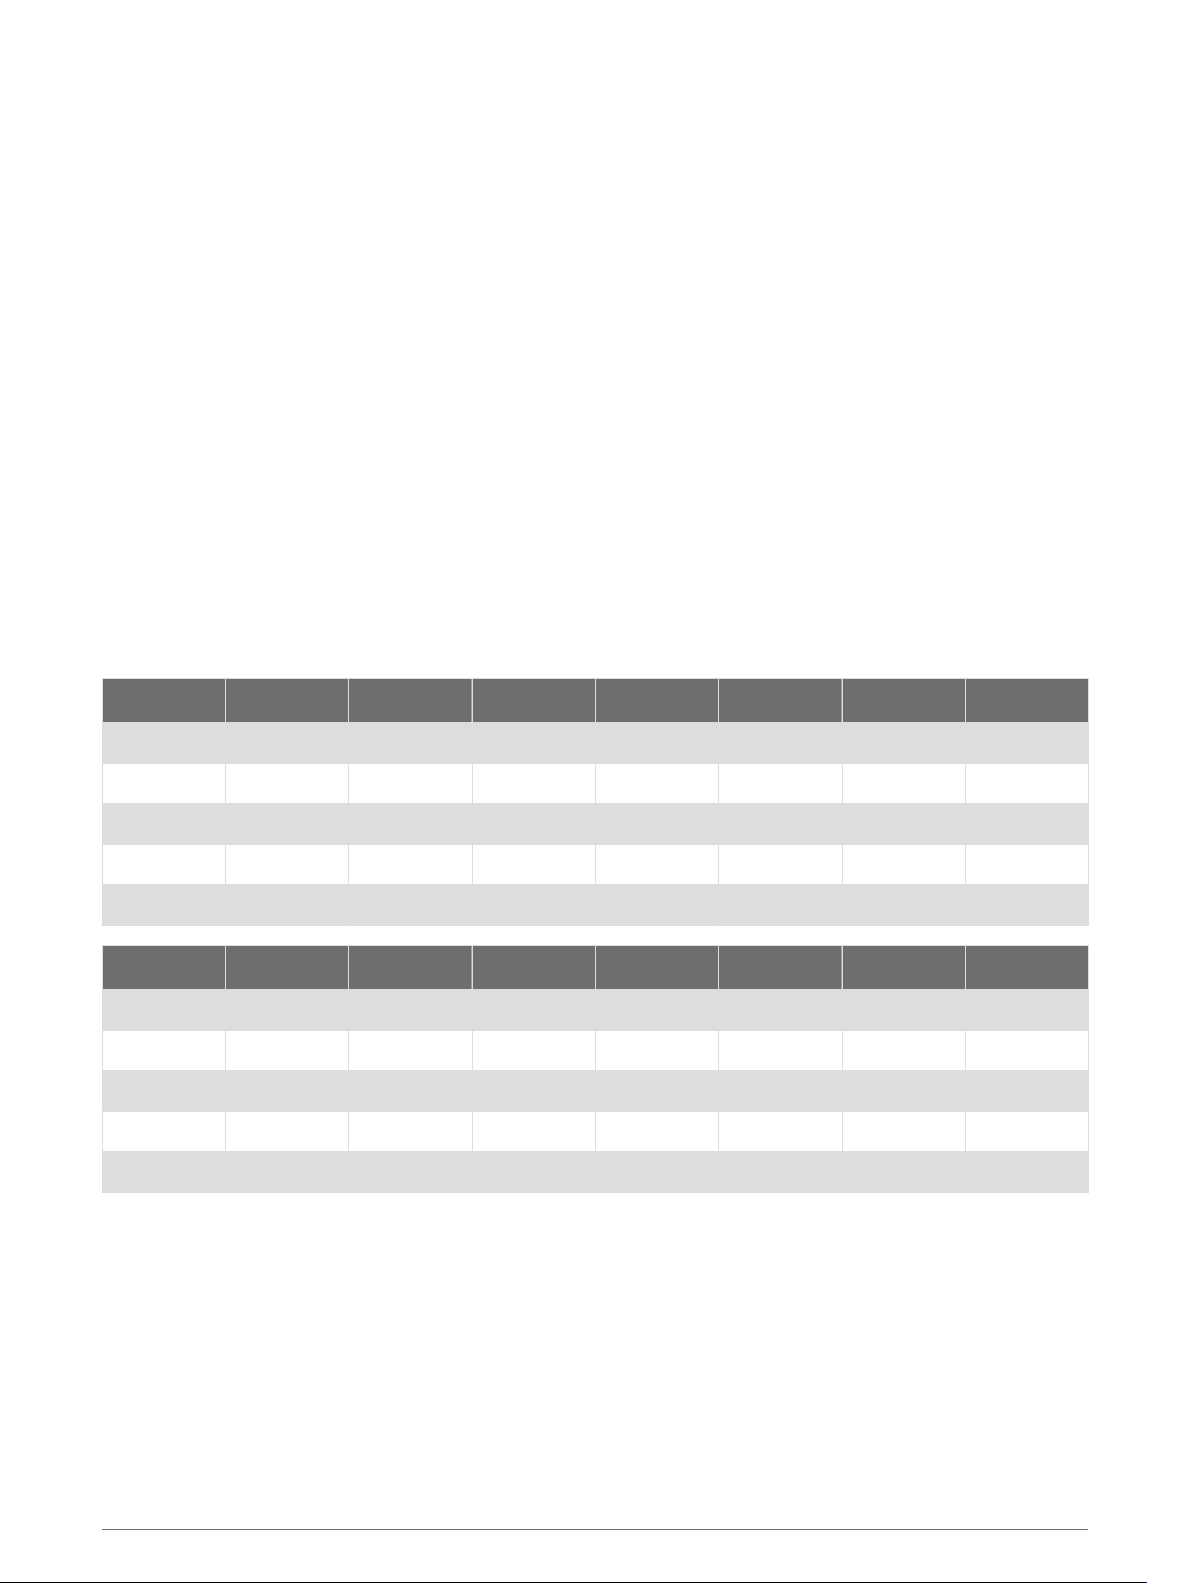
VO2 Max. Standard Ratings
These tables include standardized classifications for VO2 max. estimates by age and gender.
Males Percentile 20–29 30–39 40–49 50–59 60–69 70–79
Superior 95 55.4 54 52.5 48.9 45.7 42.1
Excellent 80 51.1 48.3 46.4 43.4 39.5 36.7
Good 60 45.4 44 42.4 39.2 35.5 32.3
Fair 40 41.7 40.5 38.5 35.6 32.3 29.4
Poor 0–40 <41.7 <40.5 <38.5 <35.6 <32.3 <29.4
Females Percentile 20–29 30–39 40–49 50–59 60–69 70–79
Superior 95 49.6 47.4 45.3 41.1 37.8 36.7
Excellent 80 43.9 42.4 39.7 36.7 33 30.9
Good 60 39.5 37.8 36.3 33 30 28.1
Fair 40 36.1 34.4 33 30.1 27.5 25.9
Poor 0–40 <36.1 <34.4 <33 <30.1 <27.5 <25.9
Data reprinted with permission from The Cooper Institute. For more information, go to
www.CooperInstitute.org.
Appendix 101
Loading ...
Loading ...
Loading ...