- 1 -
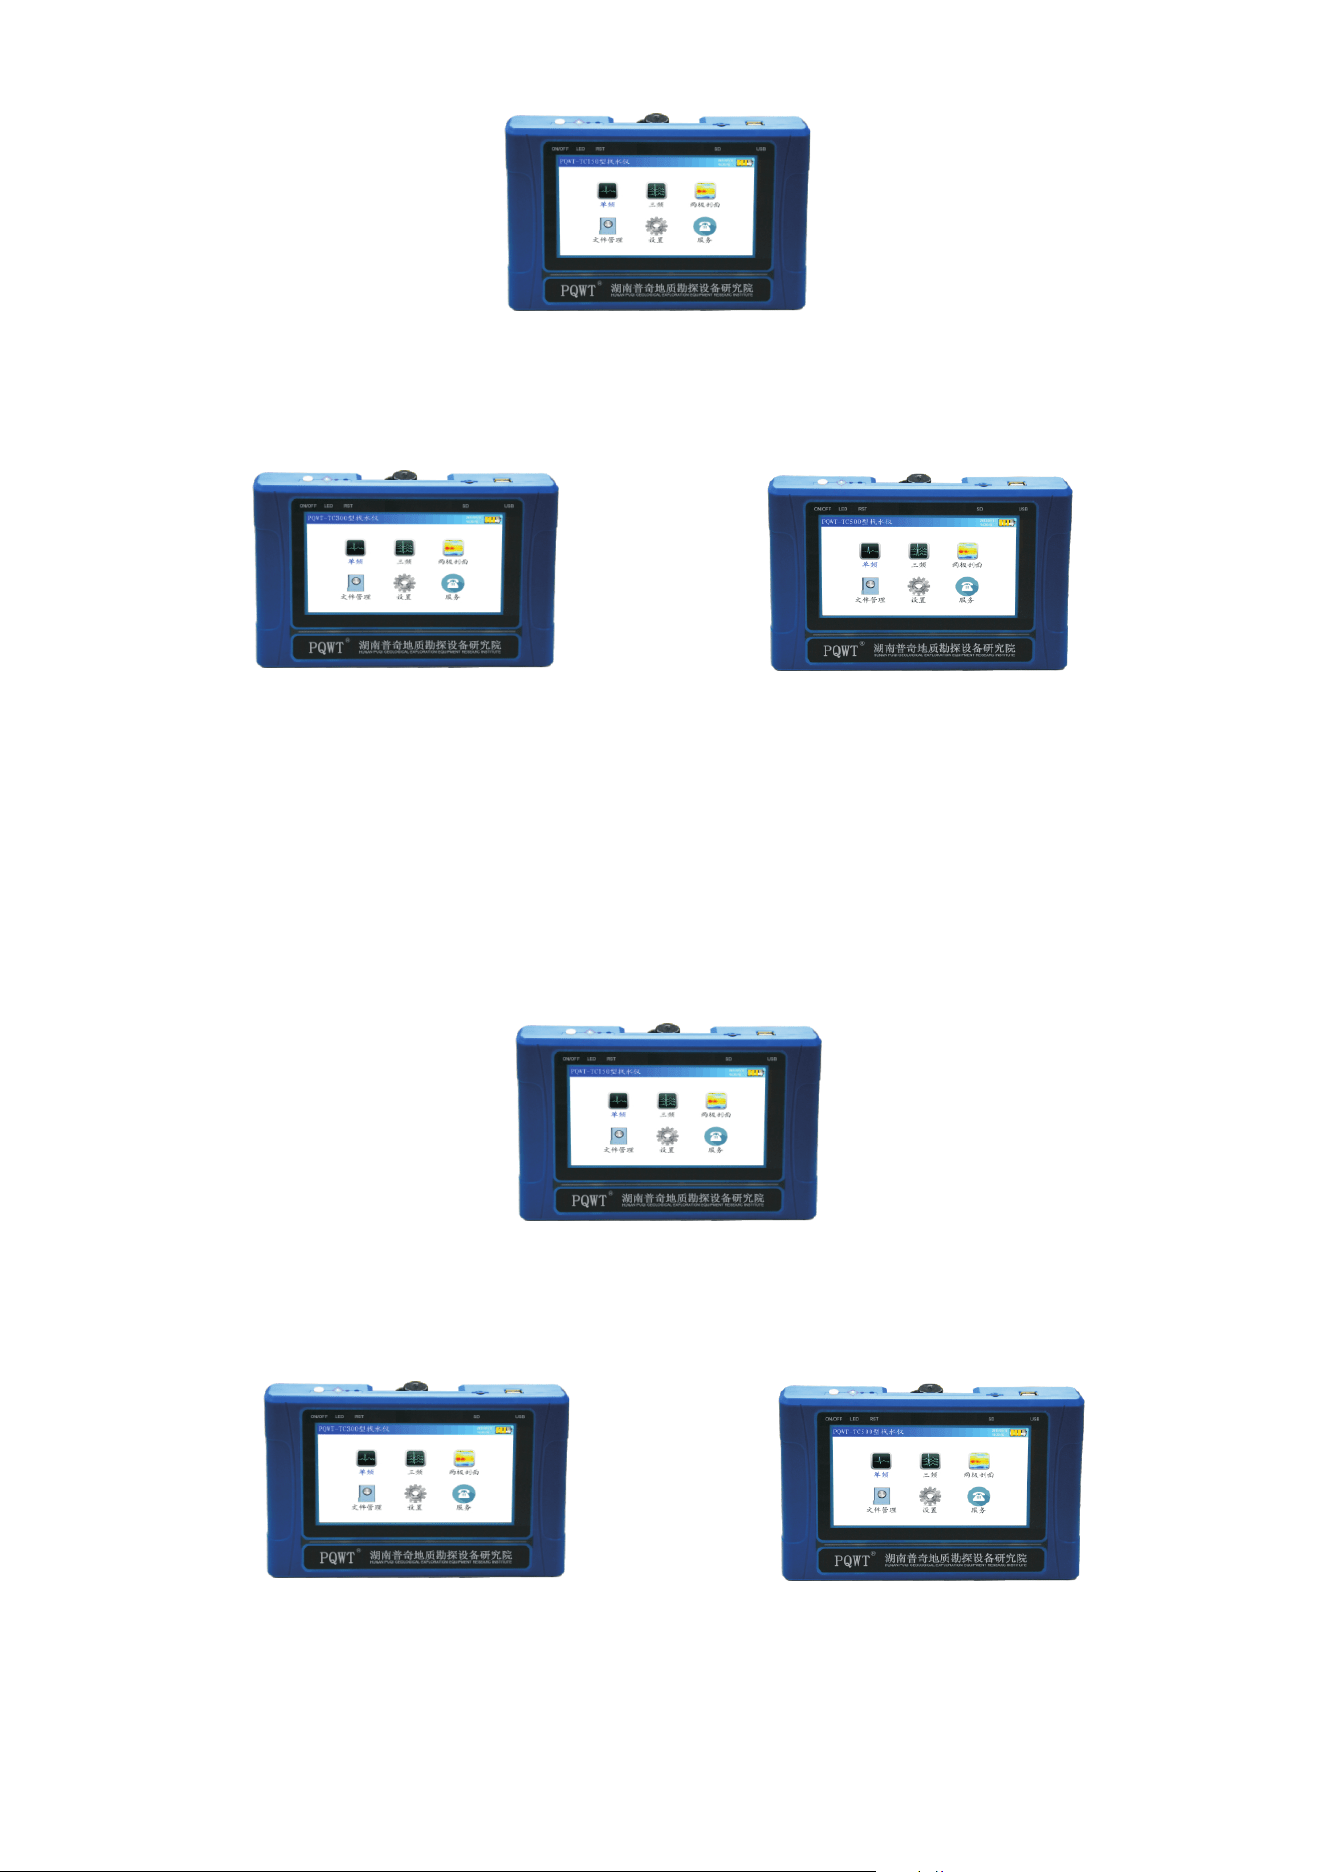
PQWT-TC300
PQWT-TC150
PQWT-TC500
- 1 -
PQWT-TC300
PQWT-TC150
PQWT-TC500
PQWT-TC���
PQWT-TC���
PQWT-TC���
PQWT-TC���
PQWT-TC���
PQWT-TC���
- � -
First Edition, ����
First Edition, ����
- � -

Foreword.................................................................3
Institute structure.................................................5
Caution....................................................................6
About battery………..............................................7
Product Overview.................................................9
Advantages.............................................................11
Technical Parameters..........................................13
Models ....................................................................14
PQWT-TC150....................................................14
PQWT-TC300....................................................15
PQWT-TC500....................................................16
Components............................................. ... .17
......
Working Principle................................................
Innovations………..........……........................... .....20
Works Introduction............................................21
Main Screen Description………....................23
Wiring method................................................39
Advised Measurement Approach.....................42
Guide for After-sale Services...........................44
Configuration table..............................................45
Copyright Notice...................................................46
18
MN Electrode Introduction...........................40
Contents
-2 -
Contents
-2 -
Foreword.................................................................3
Institute structure.................................................5
Caution....................................................................6
About battery………..............................................7
Product Overview.................................................9
Advantages.............................................................11
Technical Parameters..........................................13
Models ....................................................................14
PQWT-TC150....................................................14
PQWT-TC300....................................................15
PQWT-TC500....................................................16
Components............................................. .17
.........
Working Principle................................................
Innovations……………..................................... .....20
Works Introduction............................................21
Main Screen Description………....................23
Wiring method................................................39
Advised Measurement Approach.....................42
Guide for After-sale Services...........................44
Configuration table..............................................45
Copyright Notice...................................................46
18
MN Electrode Introduction...........................40
- � -
- � -

Forward
Hunan Puqi Geologic Exploration Equipment Institute is a professional institution in
china who engaged in the R & D, manufacturing and sales of Geophysical Prospecting
Instruments, Pipeline leak detector, Underground metal detector and X ray security
inspection equipment. More than 200 staffs, including 16 senior engineer, 49
intermediate engineer.
Over the years, Puqi focuses on Hydrogeological exploration, Intelligent data-
capture techn
ology and Application of special technique, carrying out Scientific
research, Technical services and Marketing application. We have completed more than
65 items including National ministries, Sino-foreign cooperation and major scientific
research projects. Having the honour to win a number of national research awards, with
more than 117 national patents.
Forward
- 3 -
-
3 -
Hunan Puqi Geologic Exploration Equipment Institute is a professional institution in
china who e
ngaged in the R & D, manufacturing and sales of Geophysical Prospecting
Instruments, Pipeline leak detector, Underground metal detector and X ray security
inspection equipment. More than 200 staffs, including 16 senior engineer, 49
intermediate engineer.
Over the years, Puqi focuses on Hydrogeological exploration, Intelligent data-
capture technology and Application of special technique, carrying out Scientific
research, Technical services and Ma
rketing application. We have completed more than
65 items including National ministries, Sino-foreign cooperation and major scientific
research projects. Having the honour to win a number of national research awards, with
more than 117 national patents.
.
.
- � -
- � -

Meanwhile, Puqi has established long term cooperation relationship with many
scientific research institutes in Germany, US, Australia, Hong Kong and other countries
and regions. Number of geological data laboratories has been established at multiple
places in china, using our own unique software to carry out long term data collection,
analysis and detection for different geologic structure, and set up the differential
database of different geologic structure area.
NAME:Hunan Puqi Geologic Exploration Institute
WEBSITE:www.pqwtcs.com
TEL.:(0086)0731-82237112
Address:Room 301,Building A16,Jiahai Industrial Park,No.1318
Zhongqing Road,Kaifu District,Changsha,Hunan,China,410000
- 4 -
Meanwhile, Puqi has established long term cooperation relationship with many
scientific research institutes in Germany, US, Australia, Hong Kong and other countries
and regions. Number of geological data laboratories has been established at mul
tiple
places in china, using our own unique software to carry out long term data collection,
analysis and detection for different geologic structure, and set up the differential
database of different geologic structure area.
NAME:Hunan Puqi Geologic Exploration Institute
WEBSITE:www.pqwtcs.com
TEL.:(0086)
Address:Room 301,Building A16,Jiahai Industrial Park,No.1318
Zhongqing Road,Kaifu District,Changsha,Hunan,China,410000
0731-82237112
- 4 -
HunanPuqiGeologicExplorationEquipmentInstitute
Hunan Puqi Water Environment Institute Co.Ltd.
Hunan Puqi New Energy Institute Co.Ltd
Address:No.1 -4Puqi building, No.769 Qingzhuhu Road,Qingzhuhu Street, Kaifu District,
Changsha, Hunan,China.
HunanPuqiGeologicExplorationEquipmentInstitute
Hunan Puqi Water Environment Institute Co.Ltd.
Hunan Puqi New Energy Institute Co.Ltd
Address:No.1 -4Puqi building, No.769 Qingzhuhu Road,Qingzhuhu Street, Kaifu District,
Changsha, Hunan,China.
- � -
- � -
- 5 -
- 5 -
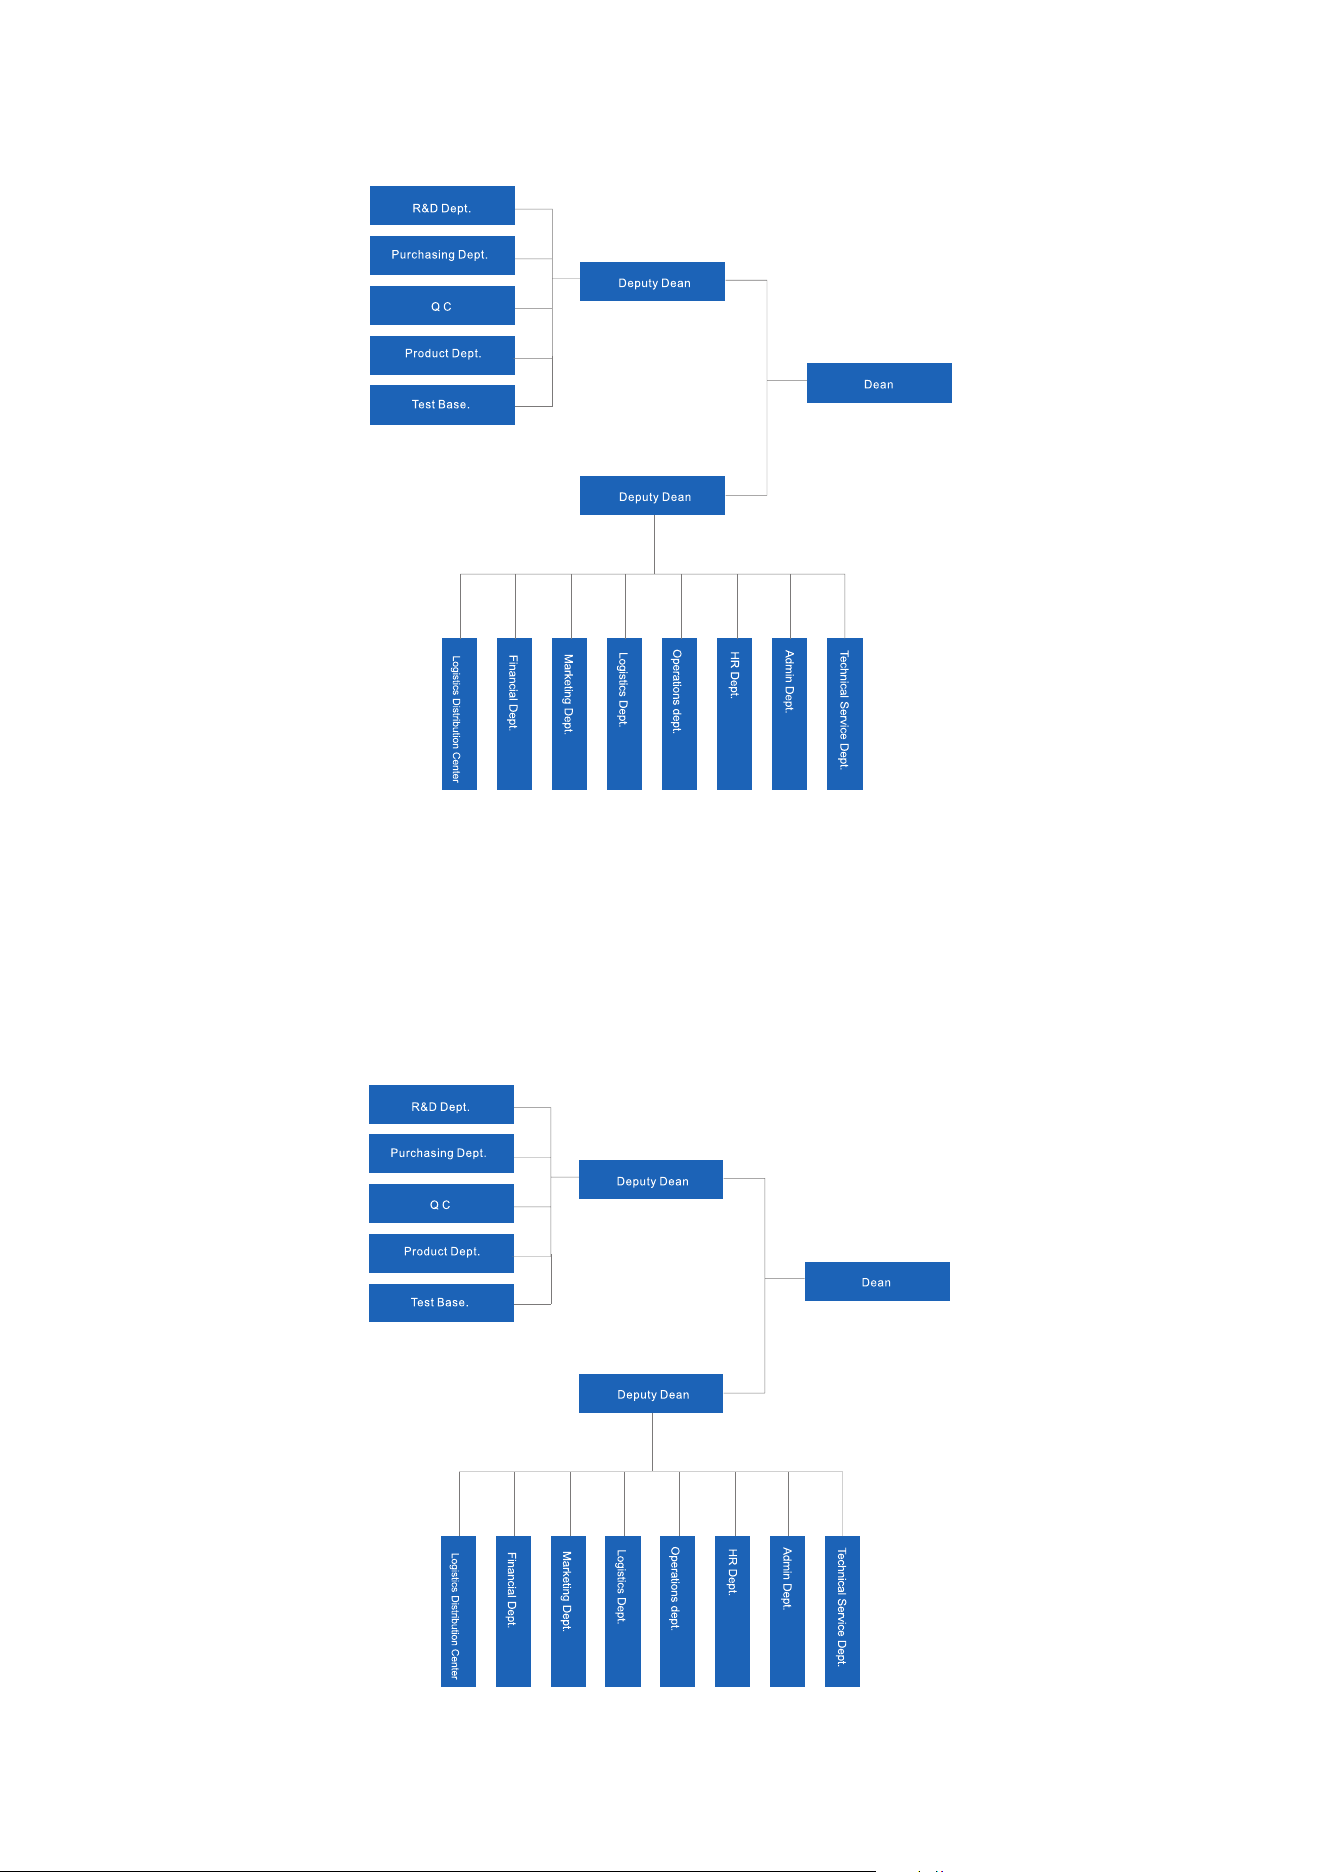
Institute Structure
Institute Structure
- � -
- � -

Caution
1. The instrument early in the design has been fully taken into account the use of the extreme
environments . But still have to pay attention to the correct method of operation, please do not fall
equipment deliberately, proper use will extend the life of the instrument .
2. The instrument is not waterproof, please do not immerse the instrument in water or operate in
the rain.
3. Please do not strike LCD screen, do not expose the monitor for a long time in direct sunlight, if
there is a touch faulty, please shutdown and restart.
4. After using, please clean the instrument and load it into special box, please place the parts into
the corresponding position, do not crush the screen.
5. The instrument should be placed in a cool and dry space.
6. Please do not disassemble the instrument, this will cause the instrument data errors or system
crashes.
- 6 -
- � -
- � -
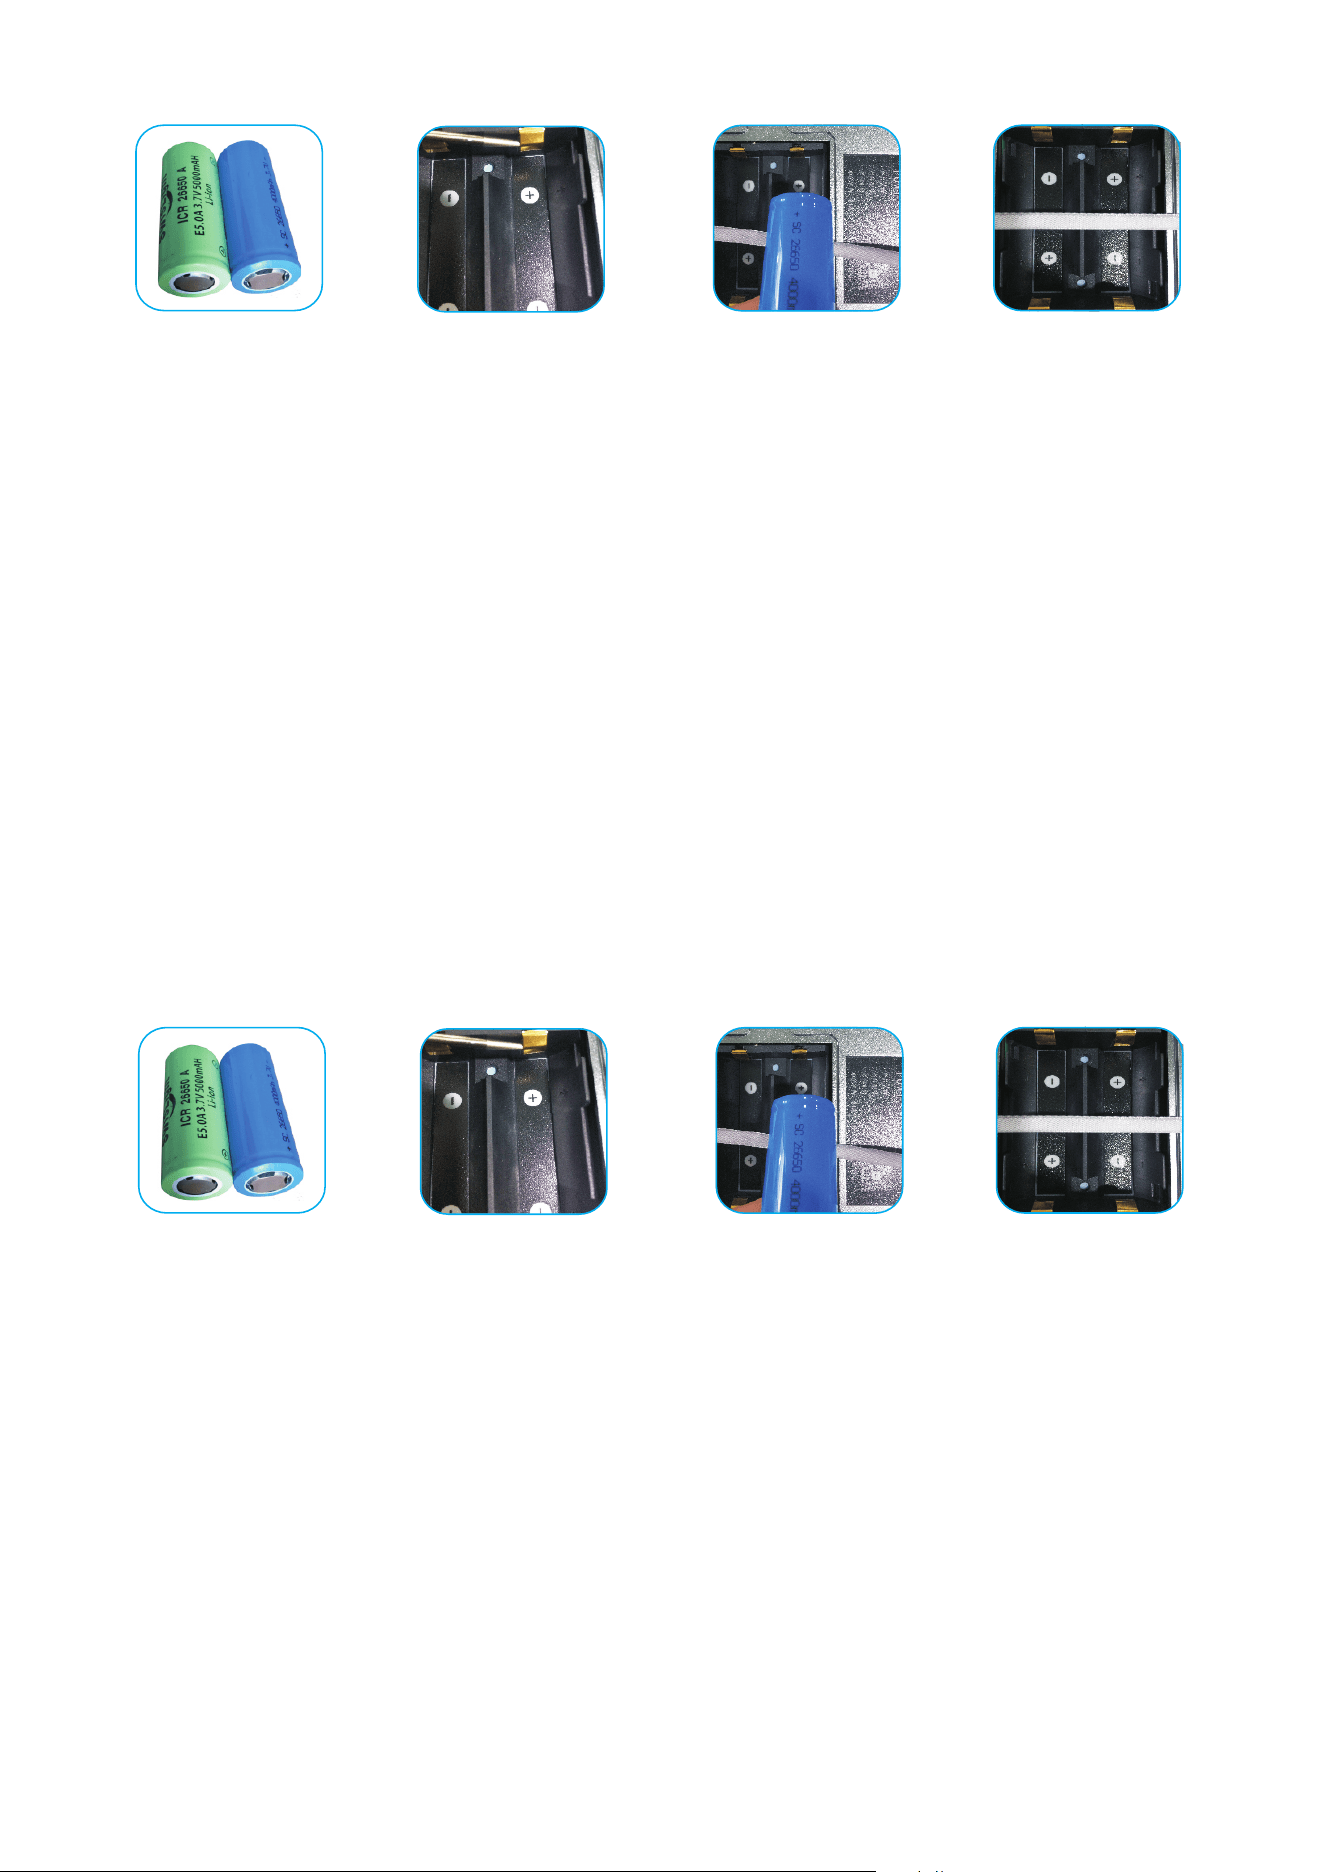
Mo d e l 26 6 5 0 li t h i um
b a t t e r y , e a c h
manufacturer's batteries
are sl i gh t l y d i f f e r e n t
p o s i t i v e a n d s o m e
positive is some of the
bumps of the beginning
of t h e d e si gn of the
i n s tr u m en t h as be e n
f u l l y c o n s i d e r e d i t s
adaptability, the battery
c o mp a r t me n t c a n b e
loade d into differe n t
m a n u f a c t u r e r s o f
standard 26650 battery.
If you encounter by the
head battery into a flat
battery, or the shrapnel is
too mu c h c o m p r e s s i on
caused by poor co
ntact can
not boot the failure of the
shrapnel slightly pushed
to make contact with the
battery poles.
Please pay attention to the
b a t t e r y p o l a r i t y w h e n
inst a l l battery in t o the
c o m pa r t me n t, in s ta l l ed
anti-battery will lead to
failure to boot.
T h e f u n c t i o n o f t h e
p u l l i n g r o p e i s
convenient to take out
Battery, so when loading
the battery, please press
the pulling rope against
the bottom of the battery
compartment.
- 7 -
8. About battery
Mo d e l 26 6 5 0 li t h i um
b a t t e r y , e a c h
manufacturer's batteries
are sl i gh t l y d i f f e r e n t
p o s i t i v e a n d s o m e
positive is some of the
bumps of the beginning
of t h e d e si gn of the
i n s tr u m en t h as be e n
f u l l y c o n s i d e r e d i t s
adaptability, the battery
c o mp a r t me n t c a n b e
loade d into differe n t
m a n u f a c t u r e r s o f
standard 26650 battery.
If you encounter by the
head battery into a flat
battery, or the shrapnel is
too mu c h c o m p r e s s io n
caused by poor co
ntact can
not boot the failure of the
shrapnel slightly pushed
to make contact with the
battery poles.
Please pay attention to the
b a t t e r y p o l a r i t y w h e n
inst a l l battery in t o the
c o m pa r t me n t , in s tal l ed
anti-battery will lead to
failure to boot.
T h e f u n c t i o n o f t h e
p u l l i n g r o p e i s
convenient to take out
Battery, so when loading
the battery, please press
the pulling rope against
the bottom of the battery
compartment.
- 7 -
8. About battery
- � -
- � -
B a t t e r y L o a d i n g
Completed.
Take out the battery
with both your hands
Pull up the lifting rope
pull up the lifting rope.
There is a tips of
battery usage inside
t h e b a t t e r y
c o m p a r t m e n t
cover.
Battery parameters:
Li-ion26650 lithium battery
3.7v dosage of 2, the proposed selection
4000mAh or more capacity.
Battery
Take the battery out of the
compartment to charge, select
the charger which support the battery, charging plug
can be used
Indoor charging plug or car charging Plug, it is
recommended to use the output current 1A and
above charging plug.
Charging
8. About battery
-
8 -
- � -
- � -

Product Overview
PQWT-TC Series geophysical prospecting instrument: the use of natural electric field
source as a working farm, with resistivity contrasts underground rocks and minerals or
groundwater, based on measuring the natural electric field on the surface of the N
different frequency electric field component, according to their different variation to
study Abnormal changes in geological bodies produce, reaching solve geological
problems one electrical prospecting m
ethods. Because this method measures the
electrical component of the electromagnetic field of the earth, so called natural electric
field method; and we chose the corresponding frequency as measured within -50 meters,
that were selected frequency, so called frequency selection method, it is always referred
to as natural potential frequency method. According to this theory the design and
production of equipment called potential frequency of detecting instrument, r
eferred to
natural selected frequency electric field instrument or instruments for geological
exploration work. Therefore, from a professional point of view to classify, geological
equipment should belong to this category in the instrument geophysical equipment
among electrical equipment. From the application point of view to classify, it can be call-
- 9 -
Product Overview
PQWT-TC Series geophysical prospecting instrument: the use of natural electric field
source as a working farm, with res
istivity contrasts underground rocks and minerals or
groundwater, based on measuring the natural electric field on the surface of the N
different frequency electric field component, according to their different variation to
study Abnormal changes in geological bodies produce, reaching solve geological
problems one electrical prospecting methods. Because this method measures the
electrical component of the electromagnetic field of the earth, so called natural e
lectric
field method; and we chose the corresponding frequency as measured within -50 meters,
that were selected frequency, so called frequency selection method, it is always referred
to as natural potential frequency method. According to this theory the design and
production of equipment called potential frequency of detecting instrument, referred to
natural selected frequency electric field instrument or instruments for geological
exploration work. Therefor
e, from a professional point of view to classify, geological
equipment should belong to this category in the instrument geophysical equipment
among electrical equipment. From the application point of view to classify, it can be call-
- 9 -
- � -
- � -

ed prospecting meter, water detector, empty detector, prospecting instrument,
instrument engineering exploration, geothermal detector, archeology instrument,
logging tools, measuring water detector, water detector, prospecting equipment ,
prospecting instrument. From the perspective of the measurement field source
classification, also known as natural electric field instrument, audio electric field
instrument, the earth audio instrument. The instrum
ent is the use of natural earth
field source without going through artificial field that is omitted clumsy power supply
system in order to achieve the simple, lightweight instrument.
After data collection by the unique built-in computing functions, the instrument can
automatically draw curve graph and profile map with one button, according to the
profile map,
you can clearly understand the geological structure and quickly determine the
location of ore body (seam), hollow (cave), water (
aquifer) etc.
-10-
ed prospecting meter, water detector, empty detector, prospecting instrument,
instrument engineering exploration, geothermal detector, archeology instrument,
logging tools, measuring water detector, water detector, prospecting equipment ,
prospecting instrument. From the perspective of the measurement field source
classification, also known as natural electric field instrument, audio electric field
instrument, the earth audio instru
ment. The instrument is the use of natural earth
field source without going through artificial field that is omitted clumsy power supply
system in order to achieve the simple, lightweight instrument.
After data collection by the unique built-in computing functions, the instrument can
automatically draw curve graph and profile map with one button, according to the
profile map,
you can clearly understand the geological structure and quickly determine the
location of ore body (seam), h
ollow (cave), water (aquifer) etc.
-10-
- �� -
- �� -

Advantages
Convenient to Carry
Without heavy power supply, it uses low frequency signals in earth natural electric field
as signal source, and the complete set weight is less than 2kgs so easy to carry.
Simple operation
Equipment is automatically controlled by micro PC. You can learn its operation in 10
minutes. It will take 10 minutes for persons without prospecting experience to finish
training.
High Measurement Speed and High Efficiency
Complete more than 8000 meters profile in one day to realize geological ab
normality
in different depths,the prospecting speed and efficiency is improved about 10 times more
than traditional resistivity method.
-11-
- ��-
- ��-

Good performance and high Accuracy
The resolution of measurement is up to 0.001mV,and precision is ±2%.It gains high
stability and abnormity curves matching with that of traditional geo-electrical equipment
in lots of field survey.
Strong Anti-interference Ability
It has advanced anti-jamming technology and multiple anti-jamming designs. You can
observe abnormity curves result with good repetition even in weak signal area, city, high
electric jamming area and working area w
ith other exterior interference via frequency
selector and digital processing.
The unique feature of Automatic mapping
This instrument can automatically form curve graph and profile map with one button
after completed recording data, no need transfer the data to computer for drawing
mapping.
-12-
Good performance and high Accuracy
The resolution of measurement is up to 0.001mV,and precision is ±2%.It gains high
stability and abnormity curves matching with that of traditional geo-electrical equipment
in lots of field survey.
Strong Anti-interference Ability
It has advanced anti-jamming technology and multiple anti-jamming designs. You can
observe abnormity curves result with good repetition even in weak signal area, city, high
electric jamming area and working a
rea with other exterior interference via frequency
selector and digital processing.
The unique feature of Automatic mapping
This instrument can automatically form curve graph and profile map with one button
after completed recording data, no need transfer the data to computer for drawing
mapping.
-12-
- ��-
- ��-

Technical Parameters
-
13-
Technical Parameters
PQWT-TC M
bit high
speed CPU
PQWT
thousand
times
mV
mV Automatic
conversion range
.Automatic noise reduction,strong anti-jamming
ability.
.User-friendly interactive ;interface ,high-speed
CPU ;control and menu prompting.
.Automatic measurement and storage of data.
Automatic drawing curve graph and drawing
profile map in the water detector, no need output
data to com
puter for drawing map.
The data will be saved ,automatically after power
off.
Store measuring lines data and record 999
measuring points data each line.
.The data could be directly formed curve graph or
map in the detector or output data to computer for
drawing map.
.Using rechargeable batteries,stand by time more
than hours.
PQWT-TC M
bit high
speed CPU
PQWT
thousand
times
mV
mV Automatic
conversion range
PQWT-TC M
bit high
speed CPU
PQWT
thousand
times
mV
mV Automatic
conversion range
PQWT
Model No. Depth Controller
Operating
system
Channel gain
Measurement
accuracy
Measurement
channel
Measuring
range
Unit of
measurement data
Other relevant parameters
Model No. Power A/D Swith
Input
impedance
Measuring
frequency
Working
environment
temperature
Relative
humidity
Power Supply Weight Display
-TC
about
W
-bit 1Msps M
Single, triple and
frequency
minus %
# Battery*
DC V mAh
Built-inBattery
Host weight
: KG,
G.W: KG
Industrial
inch HD
touch screen
PQWT-TC
about
W
-bit
1Msps
M
Single, triple and
frequency
minus %
PQWT-TC
about
W
-bit
1Msps
M
Single, triple and
frequency
minus %
150 150
32
6.0
1~200
0.001
0-1000
1
2
3
4.
5.
6. 999
7
8
12
300 300
32
6.0
1~300
0.001
0-1500
500 500
32
6.0
1~500
0.001
0-2000
150
4
8 10
33
20-50 85
26650 2
12 4000 0.65
6.9
7-
300
4 16
10
40
20-50 85
500
4 16
10
56
20-50 85
4
Electric field components
of diff
erent frequencies of
magnetotelluric field
Vs(mV)
6
8
≧ ℃ ≦
≧ ℃ ≦
≧ ℃ ≦
O
O
O
-13-
PQWT-TC M
bit high
speed CPU
PQWT
thousand
times
mV
mV Automatic
conversion range
.Automatic noise reduction,strong anti-jamming
ability.
.User-friendly interactive ;interface ,high-speed
CPU ;control and menu prompting.
.Automatic measurement and storage of data.
Automatic drawing curve graph and drawing
profile map in the water detector, no need output
data to computer for drawing map.
The data will
be saved ,automatically after power
off.
Store measuring lines data and record 999
measuring points data each line.
.The data could be directly formed curve graph or
map in the detector or output data to computer for
drawing map.
.Using rechargeable batteries,stand by time more
than hours.
PQWT-TC M
bit high
speed CPU
PQWT
thousand
times
mV
mV Automatic
conversion range
PQWT-TC M
bit high
speed CPU
PQWT
thou
sand
times
mV
mV Automatic
conversion range
PQWT
Model No. Depth Controller
Operating
system
Channel gain
Measurement
accuracy
Measurement
channel
Measuring
range
Unit of
measurement data
Other relevant parameters
Model No. Power A/D Swith
Input
impedance
Measuring
frequency
Working
environment
temperature
Relative
humidity
Power Supply Weight Display
-TC
about
W
-bit 1Msps M
Single, triple and
frequency
minus %
# Battery*
DC V mAh
Built-inBattery
Host weight
: KG,
G.
W: KG
Industrial
inch HD
touch screen
PQWT-TC
about
W
-bit
1Msps
M
Single, triple and
frequency
minus %
PQWT-TC
about
W
-bit
1Msps
M
Single, triple and
frequency
minus %
150 150
32
6.0
1~200
0.001
0-1000
1
2
3
4.
5.
6. 999
7
8
12
300 300
32
6.0
1~300
0.001
0-1500
500 500
32
6.0
1~500
0.001
0-2000
150
4
8 10
33
20-50 85
26650 2
12 4000 0.65
6.9
7-
300
4 16
10
40
20-50 85
500
4 16
10
56
20-50 85
4
Electric field components
of different frequencies of
magnetotelluric
field
Vs(mV)
6
8
≧ ℃ ≦
≧ ℃ ≦
≧ ℃ ≦
O
O
O
- ��-
- ��-
0-6000mV
Single
1-500
1-500
1-500
Single
E
Single
0-6000mV
0-6000mV
16bit 3.6
MSPS
16bit 3.6
MSPS
16bit 3.6
MSPS
<2.5W
<2.5W
<2.5W
0.7kg
0-6000mV
Single
1-500
1-500
1-500
Single
E
Single
0-6000mV
0-6000mV
16bit 3.6
MSPS
16bit 3.6
MSPS
16bit 3.6
MSPS
<2.5W
<2.5W
<2.5W
0.7kg
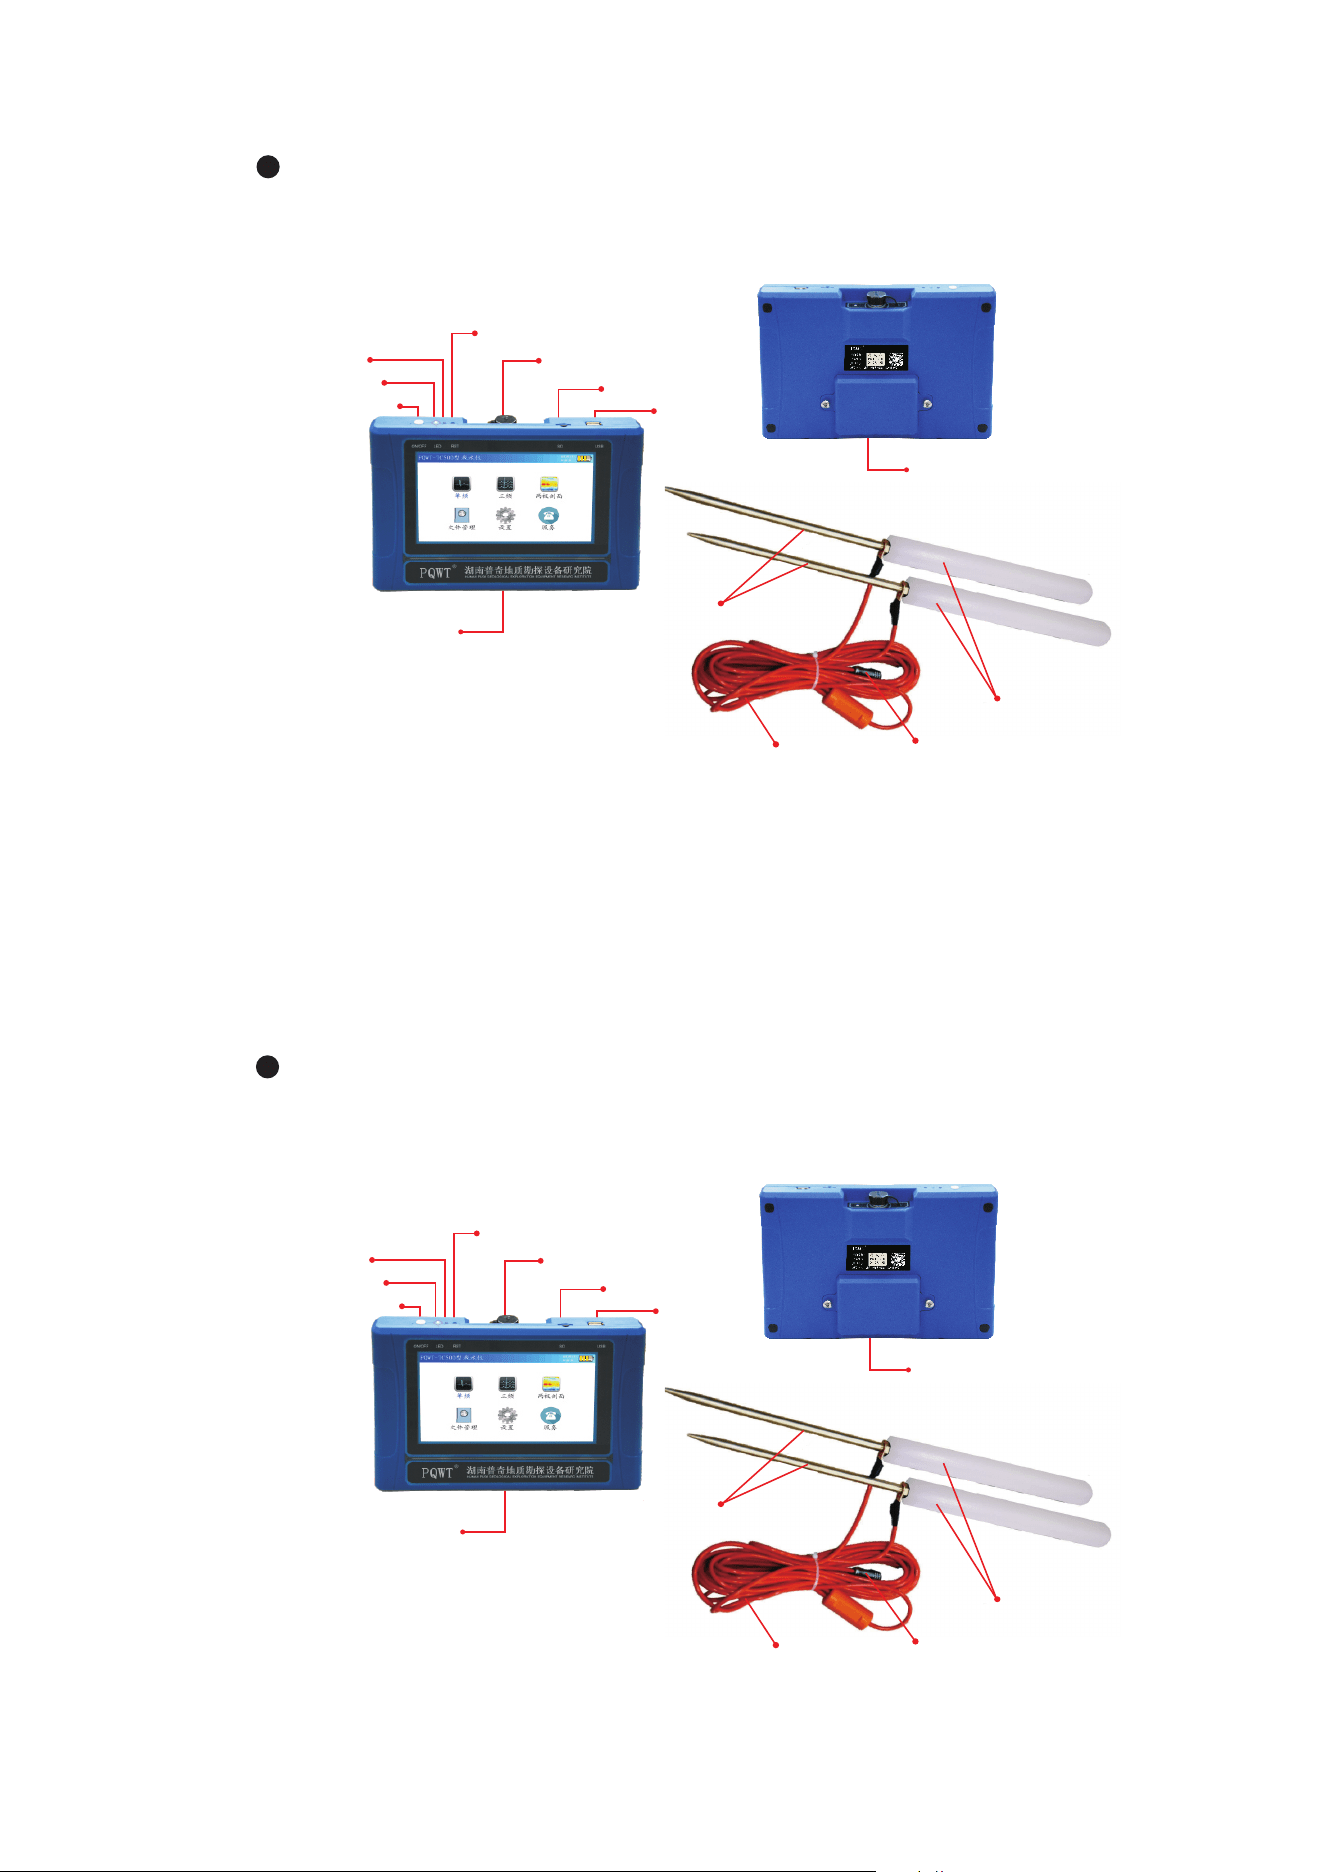
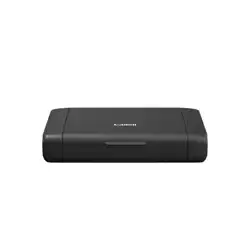
PQWT-TC500
Main switch
Power light
Test
light
USB port
Memory care
System
reset button
M N port
LCD touch screen
Alloy electrode bar
Copper electrode
Electrode cable
Battery holder
M N connector
-16-
PQWT-TC500
Main switch
Power light
Test
light
USB port
Memory care
System
reset button
M N port
LCD touch screen
Alloy electrode bar
Copper electrode
Electrode cable
Battery holder
M N connector
-16-
- �� -
- �� -
PQWT-TC150/TC300/TC500
PQWT-TC150/TC300/TC500
Copper electrode
Electrode cable
M N connector
Alloy electrode bar
Copper electrode
Electrode cable
M N connector
Alloy electrode bar

Components
1. LCD Screen
Display various operating states and the measurement results e.g. measuring data, curves
graph and profile map.( refer to the use of the Instrument)
2. Main Switch
Turns on the instrument power, if the indicator light on blue. Flashing indicate the normal
operation of the system, a long light indicate the system is busy or halted, light off
represent power off or low voltage automatic shutdown protection. Cable test indicator
light: green.
3. M N Port
Input terminal, insert M, N electrode c
onnector.
4. USB port
Insert connection cable to USB port for connecting the host machine to computer or with
the OTG cable connecting to Andrew system mobile phone to output data files and curve
and profile map (only a small part of the Andrew system mobile phone support OTG
function).
-17-
1. LCD Screen
Display various operating states and the measurement results e.g. measuring data, curves
graph and profile map.( refer to the use of the Instrument)
2. Main Switch
Turns on the instrument power, i
f the indicator light on blue. Flashing indicate the normal
operation of the system, a long light indicate the system is busy or halted, light off
represent power off or low voltage automatic shutdown protection. Cable test indicator
light: green.
3. M N Port
Input terminal, insert M, N electrode connector.
4. USB port
Insert connection cable to USB port for connecting the host machine to computer or with
the OTG cable connecting to Andrew system mobile phone to output data files and curve
and profi
le map (only a small part of the Andrew system mobile phone support OTG
function).
-17-
Components
- �� -
- �� -

Working Principle
Geophysical exploration is detecting stratigraphic rocks, geological structure and
other geological conditions through the study and observation of changes in a variety of
geophysical fields. commonly used geophysical exploration methods include gravity
exploration, DC exploration, alternating current survey exploration, magnetic
exploration, sonic exploration, seismic exploration, radioactive exploration, At present,
the m
ain geological exploration instrument is
electricity exploration in the market. And most of the instruments with features of
complex operation, heavy weight, too complex post-data processing, The users must be
many-year experienced technician who have to be professionally trained before the
operation of electricity exploration instrument.
PQWT-TC as sample
-18-
-
18-
Working Principle
Geophysical exploration is detecting stratigraphic rocks, geological structure and
other geological conditions through the study and observation of changes in a variety of
geophysical fields. commonly used geophysical exploration methods include gravity
exploration, DC exploration, alternating current survey exploration, magnetic
exploration, sonic exploration, seismic exploration, radioactive exploration, At pre
sent,
the main geological exploration instrument is
electricity exploration in the market. And most of the instruments with features of
complex operation, heavy weight, too complex post-data processing, The users must be
many-year experienced technician who have to be professionally trained before the
operation of electricity exploration instrument.
PQWT-TC as sample
- �� -
- �� -

PQWT-TC series of natural Electric field geophysical exploration underground water
detector is the latest product which research and development by our institute, using a
number of patented technologies.
The instrument is light and easy to carry, the length of measurement line need only 5-
10 meters, only one person can complete the operation, saving manpower and time, full
touch LCD screen,,
Simply operation, external insert a large-capacity memory card, the instrument w
ith
real-time mapping function, to find high resistance (fracture Band), low resistance (such
as detection of water and ore body) through real-time mapping, it can be directly displayed
the geological structure abnormal on-site.
The patents number is 201320264361.8 201520031345.3
-19-
-
19-
PQWT-TC series of natural Electric field geophysical exploration underground water
detector is the latest product which research and development by our institute, using a
number of patented technologie
s.
The instrument is light and easy to carry, the length of measurement line need only 5-
10 meters, only one person can complete the operation, saving manpower and time, full
touch LCD screen,,
Simply operation, external insert a large-capacity memory card, the instrument with
real-time mapping function, to find high resistance (fracture Band), low resistance (such
as detection of water and ore body) through real-time mapping, it can be directly displayed
the geological structure abnormal o
n-site.
The patents number is 201320264361.8 201520031345.3
.
.
- �� -
- �� -

Innovations
-
20-
Innovations
Compared with the traditional DC electricity underground water detector, the key
circuit part adopt the discrete component design, circuit modular design, the application of
a number of shielding technology to reduce circuit itself noise, to achieve greater gain and
resolution, the use of more high-precision high-speed AD,8-channel sampling, precision
switching capacitor filter, the new system (column) high-speed CPU, multi-stag
e filter, Two
levels of power frequency in wave, the use of signal enhancement technology to cover
interference, highlighting the useful signal. The instrument uses super strong anti-jamming
design of circuit against the electromagnetic environment Disturbance, suitable for
geological exploration in various environmental.The new test methods of power
supply,voltage and current, improved the electrode cable test, programming using the latest
digit
al filtering technology, including FFT digital filtering, FIR, IIR and other filtering
technology. Digital filtering combined with conventional filtering, frequency resolution up
to 0.1Hz. Software upgrade online, new UI, optimize operation interface, which make the
instrument easier to use.
-20-
Compared with the traditional DC electricity underground water detector, the key
circuit part adopt the discrete component design, circuit modular design, the applicat
ion of
a number of shielding technology to reduce circuit itself noise, to achieve greater gain and
resolution, the use of more high-precision high-speed AD,8-channel sampling, precision
switching capacitor filter, the new system (column) high-speed CPU, multi-stage filter, Two
levels of power frequency in wave, the use of signal enhancement technology to cover
interference, highlighting the useful signal. The instrument uses super strong anti-jamming
design of
circuit against the electromagnetic environment Disturbance, suitable for
geological exploration in various environmental.The new test methods of power
supply,voltage and current, improved the electrode cable test, programming using the latest
digital filtering technology, including FFT digital filtering, FIR, IIR and other filtering
technology. Digital filtering combined with conventional filtering, frequency resolution up
to 0.1Hz. Softwa
re upgrade online, new UI, optimize operation interface, which make the
instrument easier to use.
- ��-
- ��-

-21-
-
21-
Works Introduction
PQWT-TC are using the Natural electric field frequency optional geological exploration,
Controlled Source Audio Magnetotelluric (CSAMT) and Audio Magnetotelluric (AMT).
By the M, N electrode probe ( transducer ) via a cable earth's magnetic field to electrical
signal input to high impedance input stage , after the anti-jamming exchange amplification,
frequency selection, select the desired operating frequency, and the
n by the A / D sampling,
central processor (CPU) for data processing. Where in the entire measurement process,
high-speed central processing unit (CPU) of the cont++rol, instrumentation automatic
range conversion and automatic frequency selection.
Works Introduction
PQWT-TC are using the Natural electric field frequency optional geological exploration,
Controlled Source Audio Magnetotelluric (CSAMT) and Audio Magnetotelluric (AMT).
By the M, N electr
ode probe ( transducer ) via a cable earth's magnetic field to electrical
signal input to high impedance input stage , after the anti-jamming exchange amplification,
frequency selection, select the desired operating frequency, and then by the A / D sampling,
central processor (CPU) for data processing. Where in the entire measurement process,
high-speed central processing unit (CPU) of the cont++rol, instrumentation automatic
range conversion and automatic frequency se
lection.
- ��-
- ��-

-22-
-
22-
Finally display the measured data and curves graph, and then click “profile” the
instrument will automatically draw profile map directly on the LCD of instrument, also can
output measurement data, curve graph and profile map by USB cable to computer for
analysis and making geological conclusion. After connecting the instrument by straps , back
in the body for convenient use. Turn on the main switch, after display boot system
information, LOGO and company inform
ation, automatically enters root menu interface
and operating mode.
Finally display the measured data and curves graph, and then click “profile” the
instrument will automatically draw profile map directly on the LCD of instrument, also can
output measurement data, curve graph and profile map by USB cable to computer for
analysis and making geological conclusion. After connecting the instrument by straps , back
in the body for convenient use. Turn on the main switch, after
display boot system
information, LOGO and company information, automatically enters root menu interface
and operating mode.
- ��-
- ��-

Main Screen Description
Boot into the boot screen , after a successful start into the main screen, Figure 1, Figure 2
( main screen displays the contents of the boot ).
Figure 1 start interface
-23-
Main Screen Description
Boot into the boot screen , after a successful start into the main screen, Figure 1, Figure 2
( main screen displays the contents of the boot ).
Figure 1 start interface
-23-
- ��-
- ��-
Figure 2 main screen displays the contents of the boot
Single Frequency Measurement State
After entering the main screen, double-click the "single-frequency" into the single-
frequency measurements, it can proceed single frequency measurement-related
operations as shown below in Figure 3.
-24-
Figure 2 main screen displays the contents of the boot
Single Frequency Measurement State
After entering the main screen, double-click the "single-frequency" into the single-
frequency measurements, it can proceed single frequency measurement-related
operations as shown below in Figure 3.
-24-
- ��-
- ��-
Figure 3 The display on single frequency measurement status
(1) Line Test :
Check whether prospecting instrument can work normally or not before measurement.
Cross these two connected copper electrodes and put them together, click on the " Line
-25-
Figure 3 The display on single frequency measurement status
(1) Line Test :
Check whether prospecting instrument can work normally or not before measurement.
Cross these two connected copper electrodes and put them together, click on the " Line
-25-
- ��-
- ��-
Test ", if the detection indicator (green ) light, it’s Line normal. Without light ,It is a cable
fault, need to repair or replace the cable.
(2) Profile: (The function suit for profile survey)
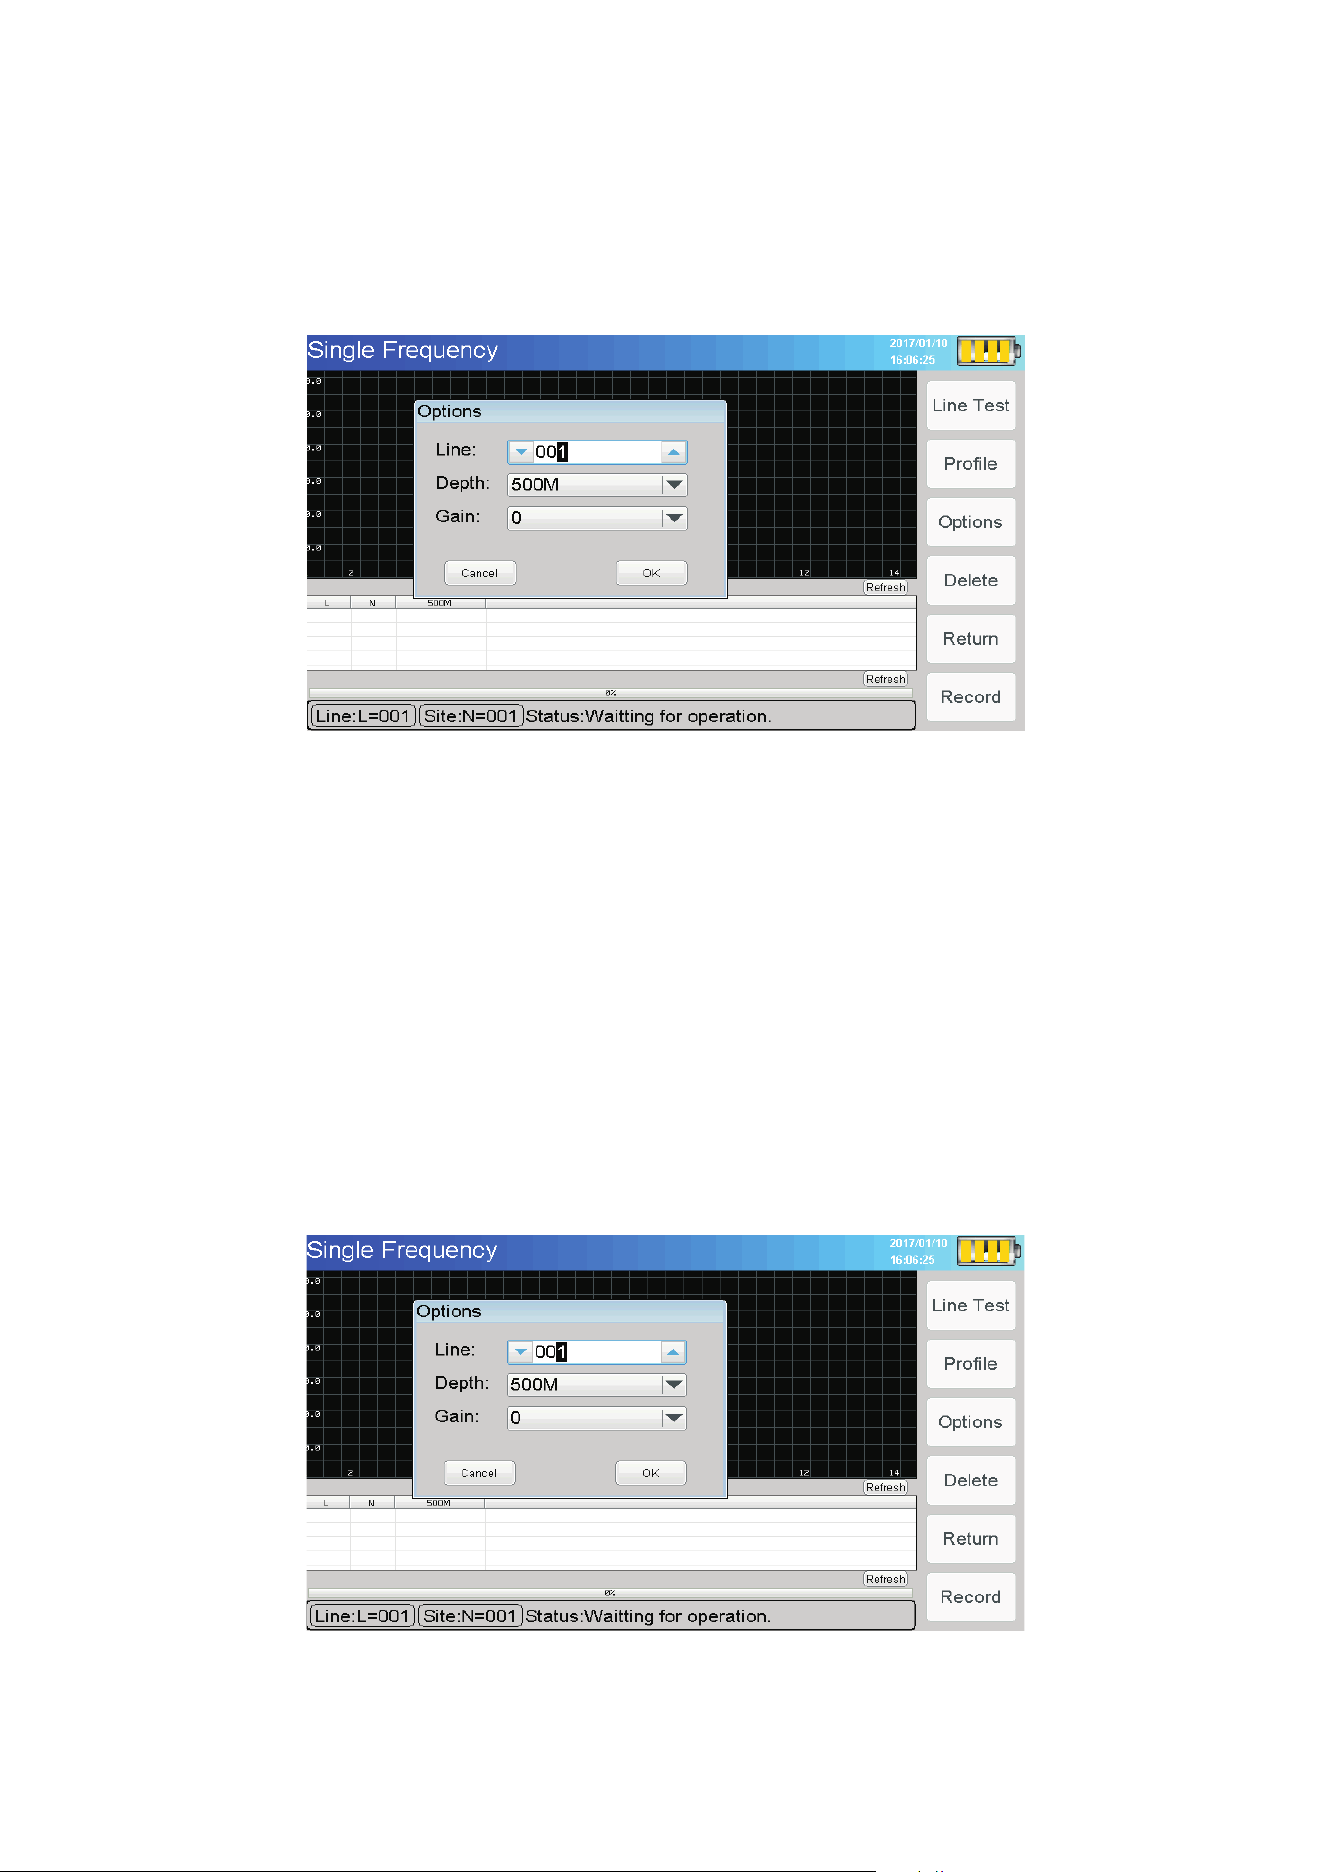
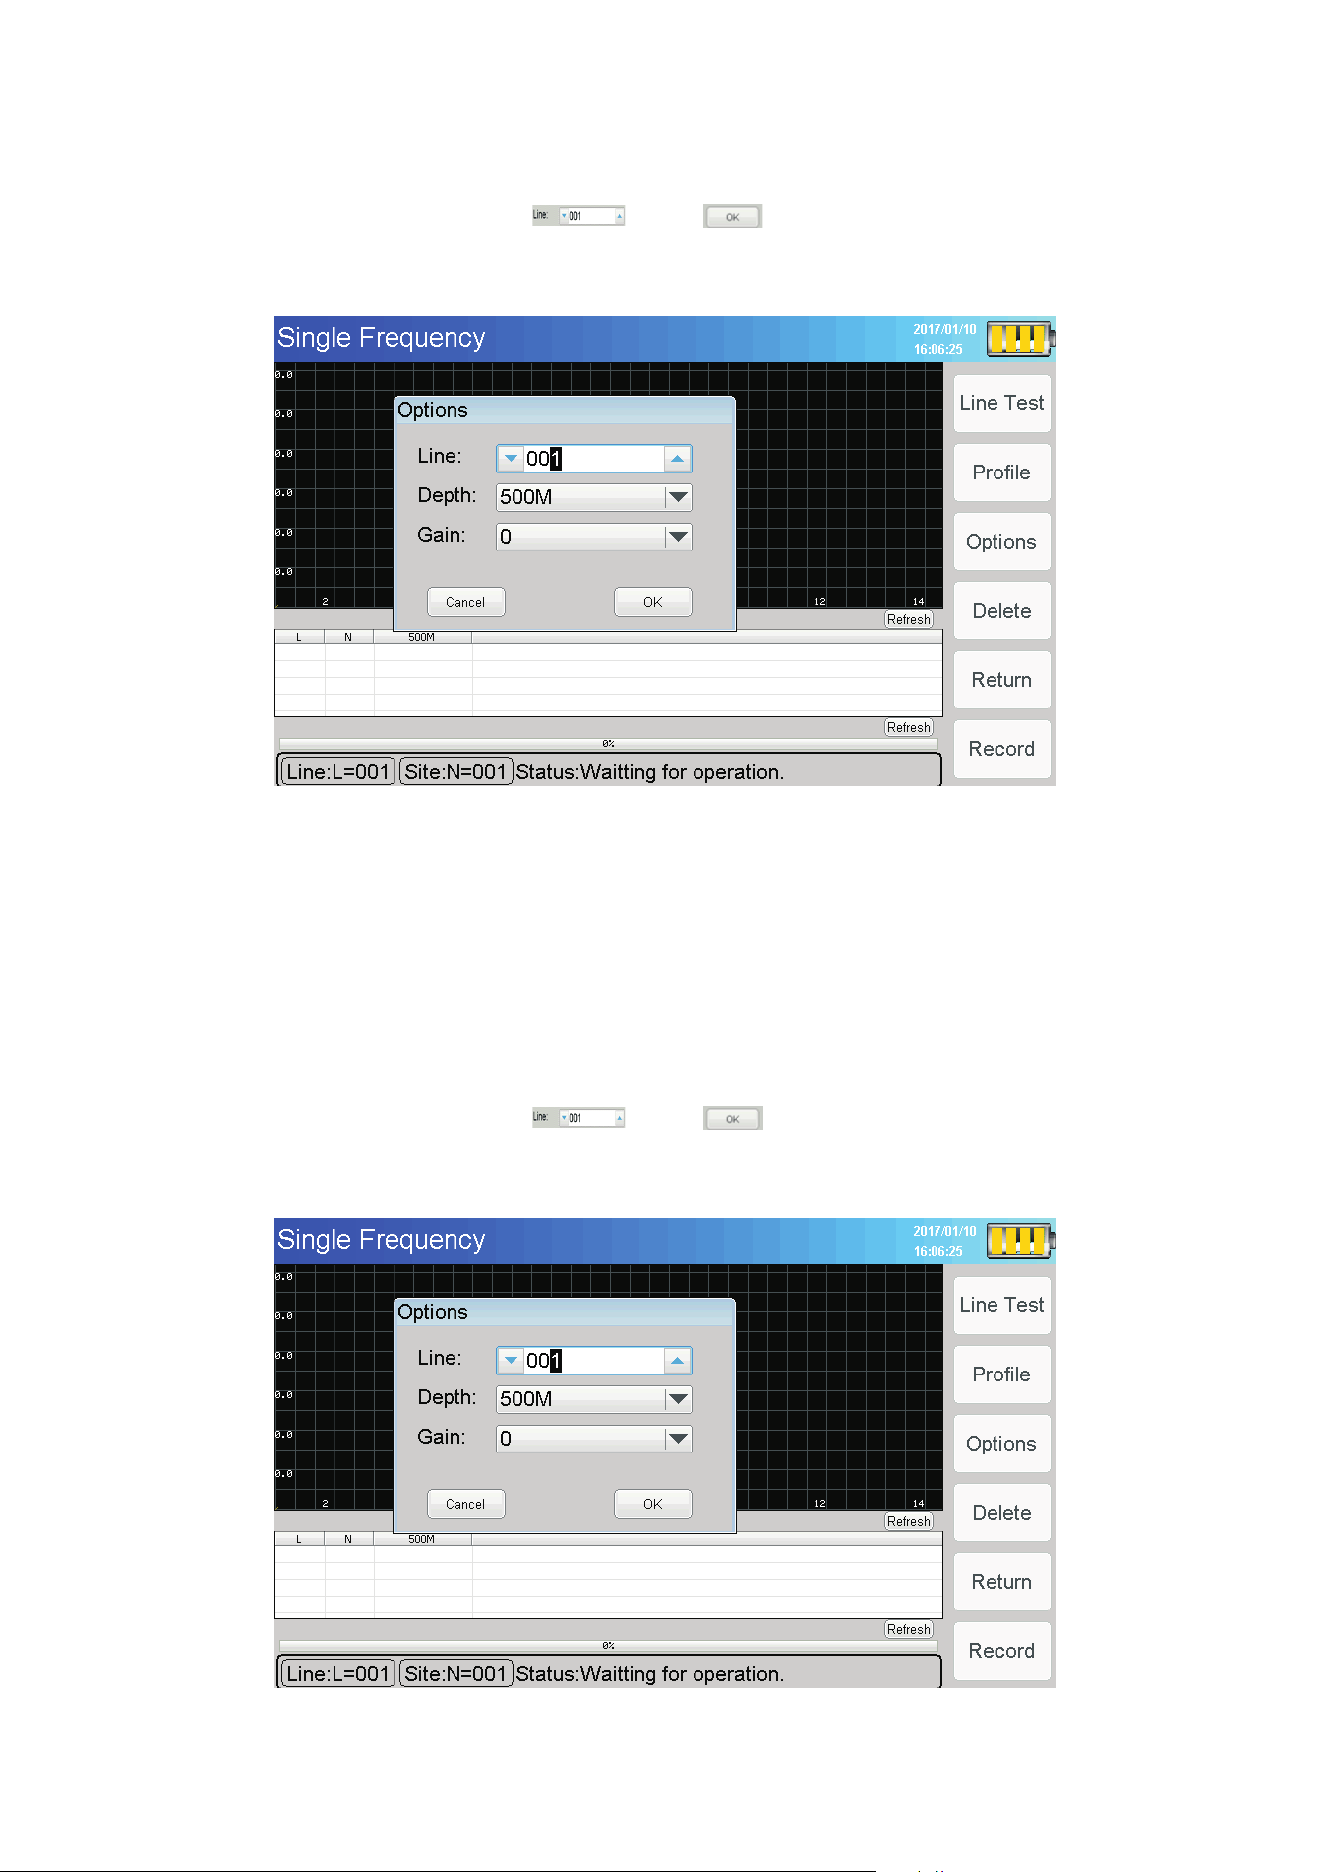
(3) Options:Click the" Options " button ,then pop-up " Options" dialog box (shown below
Figure4)
Figure 4 Single frequency setup
-26-
Test ", if the detection indicator (green ) light, it’s Line normal. Without light ,It is a cable
fault, need to repair or replace the cable.
(2) Profile: (The function suit for profile survey)
(3) Options:Click the" Options " button ,then pop-up " Options" dialog box (shown below
Figure4)
Figure 4 Single frequency setup
-26-
- ��-
- ��-

“Line”he instrument can store 999 measurement lines, each measuring line can store
999 measurement site .The display information of measuring line and measuring site is
shown at the bottom left. The number behind "Line: L =" indicates the current line number,
The number behind " Site: N =" indicates the stored measuring site on the current
measuring line. For example, "Line: L =5 ; Site: N= 20" indicates 20site has been measured
on the No. 5 line. “Depth”: 500M( 300Model shoul
d be 300m, 150model should be 150m).
“ Gain”: The default "0X", in the field of weak areas according to the actual situation
adjusted to "1X", "2X" enhanced field source signal. During the measurement of a line, it is
not allowed to shift, otherwise it will cause data disorder. Press "OK" to save the “options”
and return.
(4) Delete
In the process of measurement, if the case of accidents or data mutations occur can not be
determined, the data of last measuring site need to be deleted,
you can click on the "delete"
button, delete the last column in the table , while the number behind "Site: N = " minus 1 ,
indicating that the measuring Site data is deleted. Click once to delete a set of measuring
Soint data.
-27-
“Line”he instrument can store 999 measurement lines, each measuring line can store
999 measurement site .The display information of measuring line and measuring site is
shown at the bottom left. The number behind "Line: L =" indicates the current lin
e number,
The number behind " Site: N =" indicates the stored measuring site on the current
measuring line. For example, "Line: L =5 ; Site: N= 20" indicates 20site has been measured
on the No. 5 line. “Depth”: 500M( 300Model should be 300m, 150model should be 150m).
“ Gain”: The default "0X", in the field of weak areas according to the actual situation
adjusted to "1X", "2X" enhanced field source signal. During the measurement of a line, it is
not allowed to shift, otherwise it will cau
se data disorder. Press "OK" to save the “options”
and return.
(4) Delete
In the process of measurement, if the case of accidents or data mutations occur can not be
determined, the data of last measuring site need to be deleted, you can click on the "delete"
button, delete the last column in the table , while the number behind "Site: N = " minus 1 ,
indicating that the measuring Site data is deleted. Click once to delete a set of measuring
Soint data.
-27-
- ��-
- ��-

(5) Click the "Return" button to return to the main screen
(6) Record:
Click on the "Record " button , the instrument can be sampled (measured ) operations , the
screen below the status bar displays the "Waiting for operation" to " Recording Freq1 Data ."
Then DATA column shows the data of frequencies. After the sampling is completed which
display “record completed”. Click the "Record " button again, the number after the " Site:
N= " will plus 1, and then measured the data of next point. You c
an repeat this step until you
complete a measuring line ( N<999). Since the instrument stores up to 999 measuring
points each measuring line , so when the number of sites is 999 ("N = 999"), then click on the
"Record" button, the instrument will cover the previous measurement site. Now you must
press the " Options" button after entering, re-select the " Line: 002 ", and then keep going
the measuring operation. “stop”:click ”Record”, the screen show ”Stop”, During the recor
d
process, if the electrode rods contact with the ground is not good, there is no plug firmly, the
operator need to stop something, etc. can press the "stop" button, and then start record.
Note: Please don’t shut down the instrument when it is measuring, otherwise it will cause
data loss or program confusion. Any other time you can shut down.
-28-
=
(5) Click the "Return" button to return to the main screen
(6) Record:
Click on the "Record " button , the instrument can be sampled (measured ) operations , the
screen below th
e status bar displays the "Waiting for operation" to " Recording Freq1 Data ."
Then DATA column shows the data of frequencies. After the sampling is completed which
display “record completed”. Click the "Record " button again, the number after the " Site:
N= " will plus 1, and then measured the data of next point. You can repeat this step until you
complete a measuring line ( N<999). Since the instrument stores up to 999 measuring
points each measuring line , so when the number of
sites is 999 ("N = 999"), then click on the
"Record" button, the instrument will cover the previous measurement site. Now you must
press the " Options" button after entering, re-select the " Line: 002 ", and then keep going
the measuring operation. “stop”:click ”Record”, the screen show ”Stop”, During the record
process, if the electrode rods contact with the ground is not good, there is no plug firmly, the
operator need to stop something, etc. can press the "stop" button, and then start re
cord.
Note: Please don’t shut down the instrument when it is measuring, otherwise it will cause
data loss or program confusion. Any other time you can shut down.
-28-
=
- ��-
- ��-
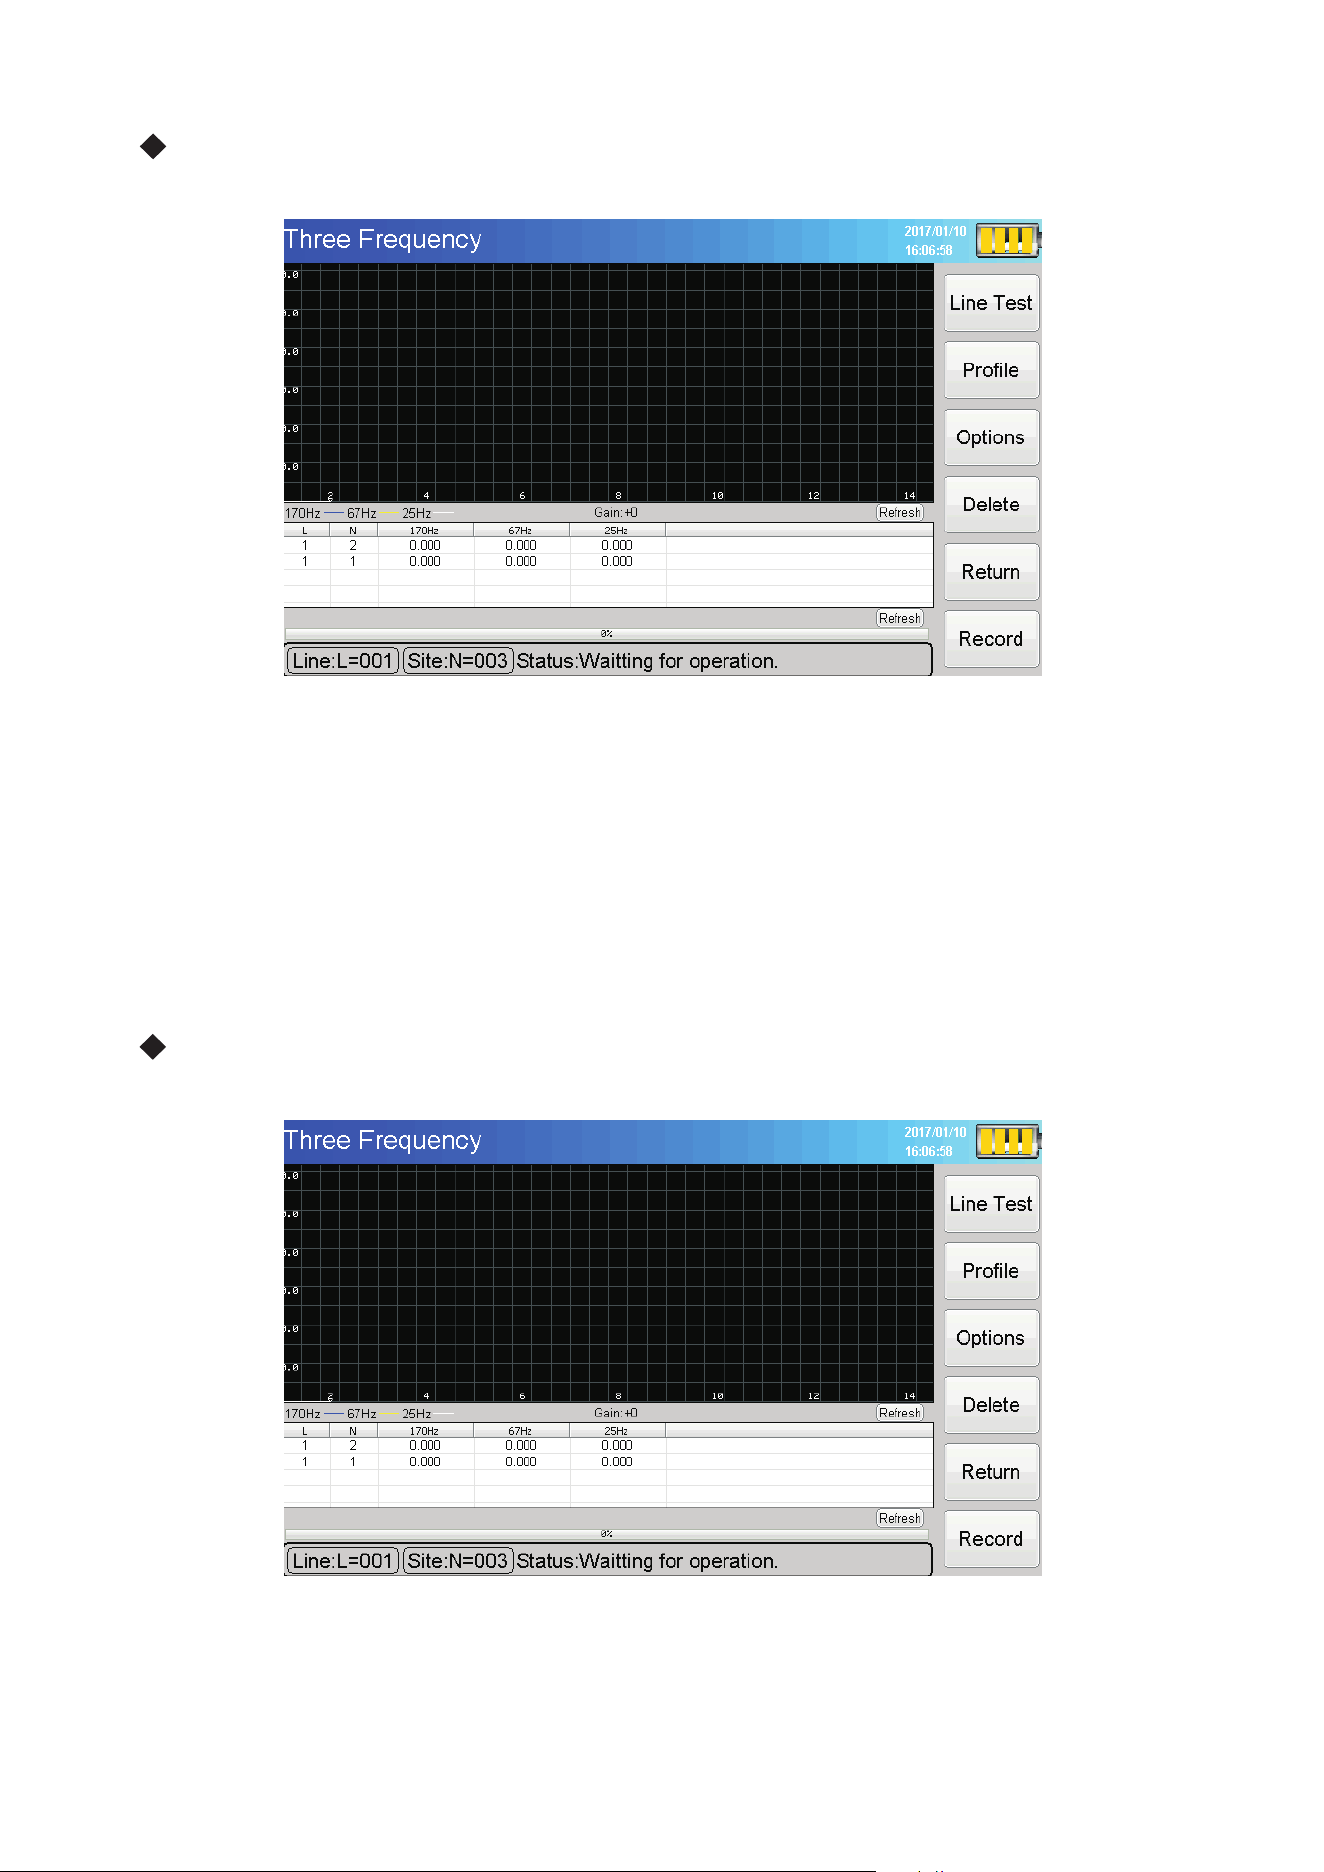
Three Frequency Measurement State
Enter Three-frequency measurement state, LCD display is shown below
-29-
(1)Line Test (4) Delete (5) Return (6)Record the function have introduced at the Signal
Frequency measurement state.
Figure 5 The display on three frequency measurement status
Three Frequency Measurement State
Enter Three-frequency measurement state, LCD display is shown below
-29-
(1)Line Test (4) Delete (5) Return (6)Record the function have introduced at the Signal
Frequency measurement state.
Figure 5 The display on three frequency measurement status
- ��-
- ��-
(3)Options:
Click the " Options " button , then pop-up "Options" dialog box (shown above Figure 6)By
selecting the measuring line below , press , you can make the next step Record
operation. Measuring line and measuring site have be introduced at single frequency
measurement state.
Figure 6 Three Frequency
-30-
- ��-
- ��-
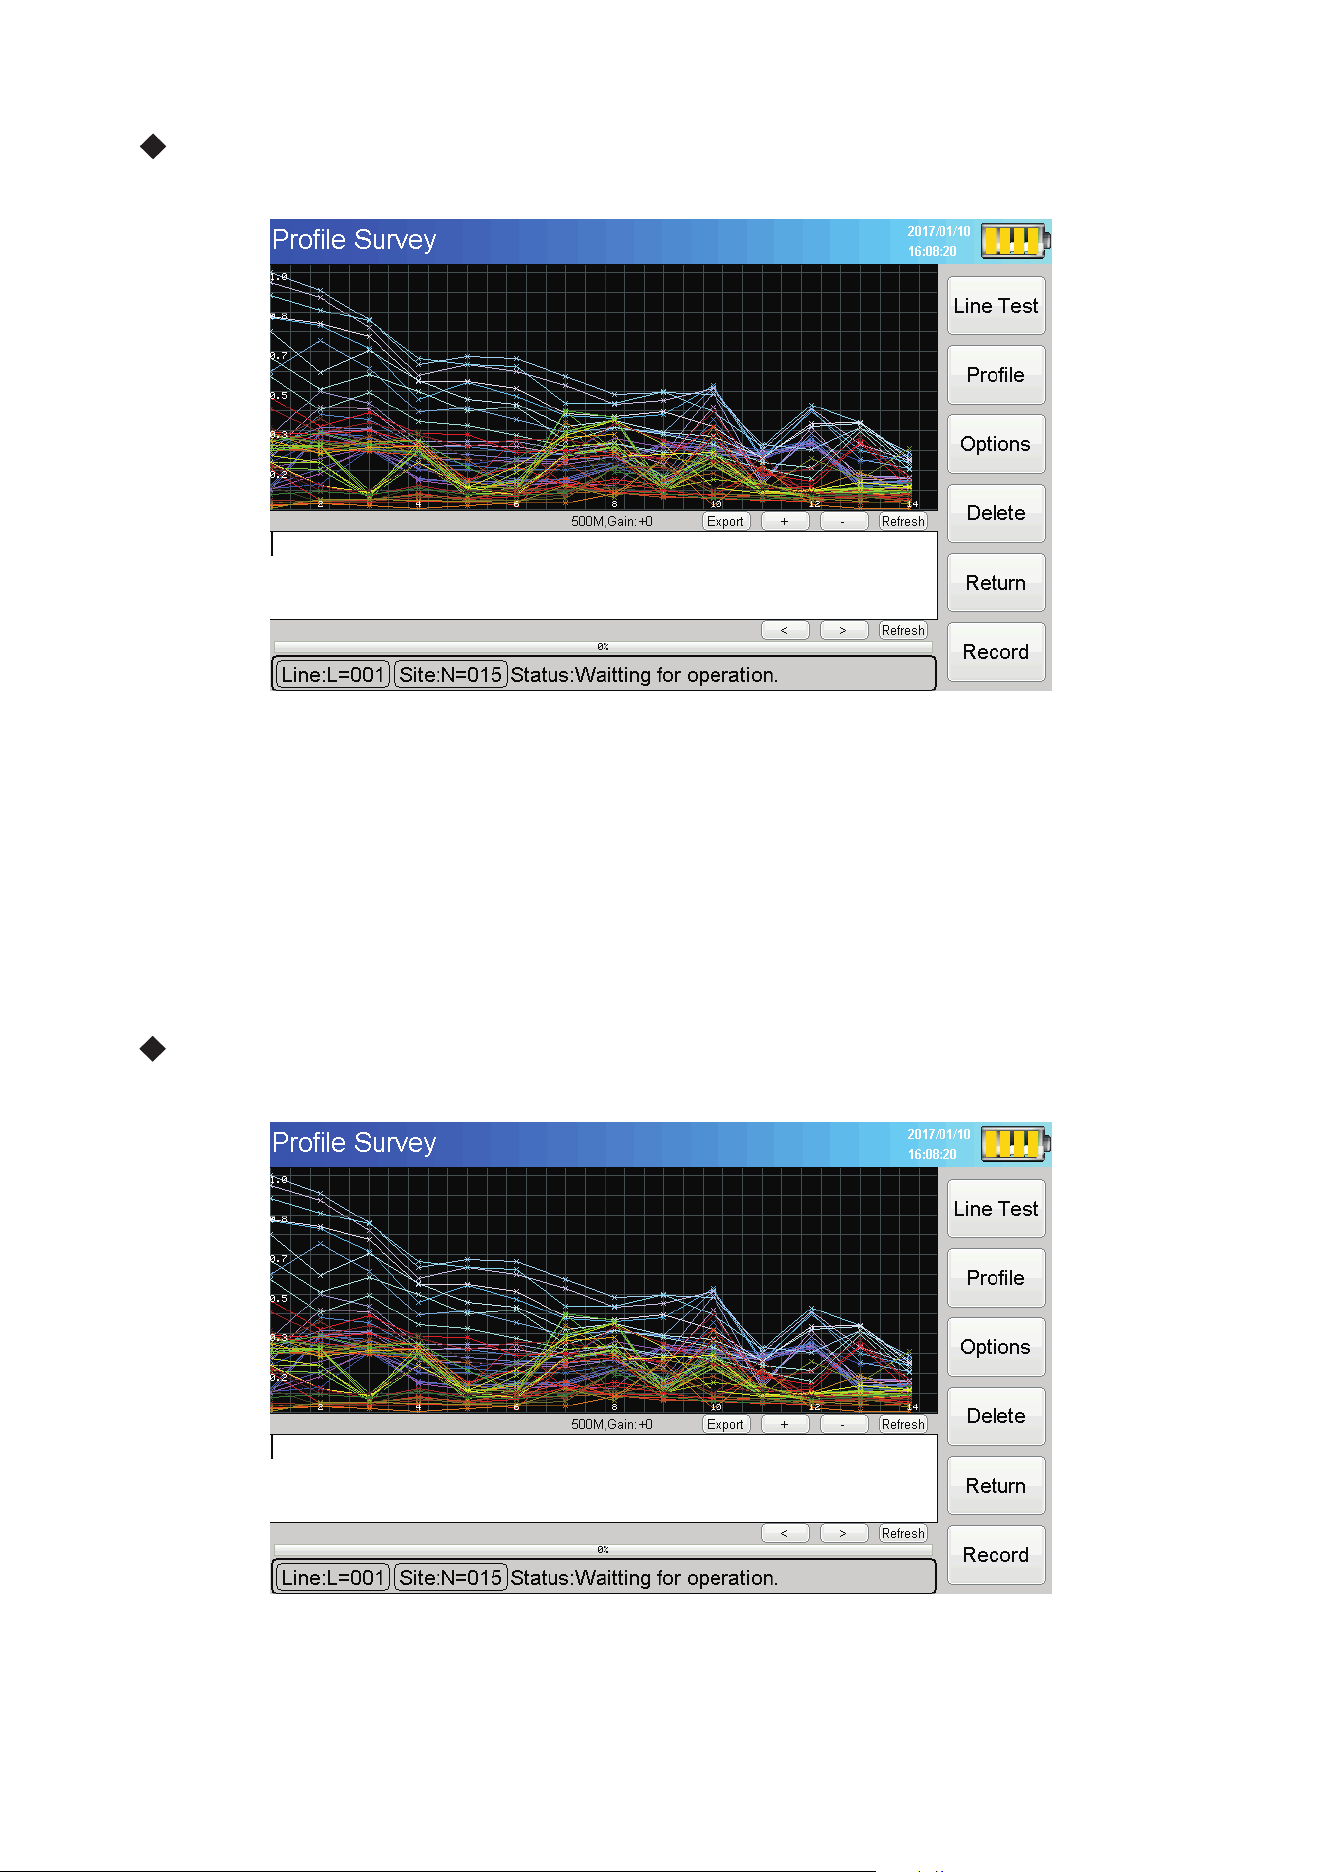
Profile Survey Measurement State
Enter profile survey measurement state, LCD display is shown below
Figure 7 The display on profile survey measurement status
(1)Line Test (4) Delete (5) Return (6)Record the function have introduced at the Signal
Frequency measurement state.
-31-
Profile Survey Measurement State
Enter profile survey measurement state, LCD display is shown below
Figure 7 The display on profile survey measurement status
(1)Line Test (4) Delete (5) Return (6)Record the function have introduced at the Signal
Frequency measurement state.
-31-
- ��-
- ��-
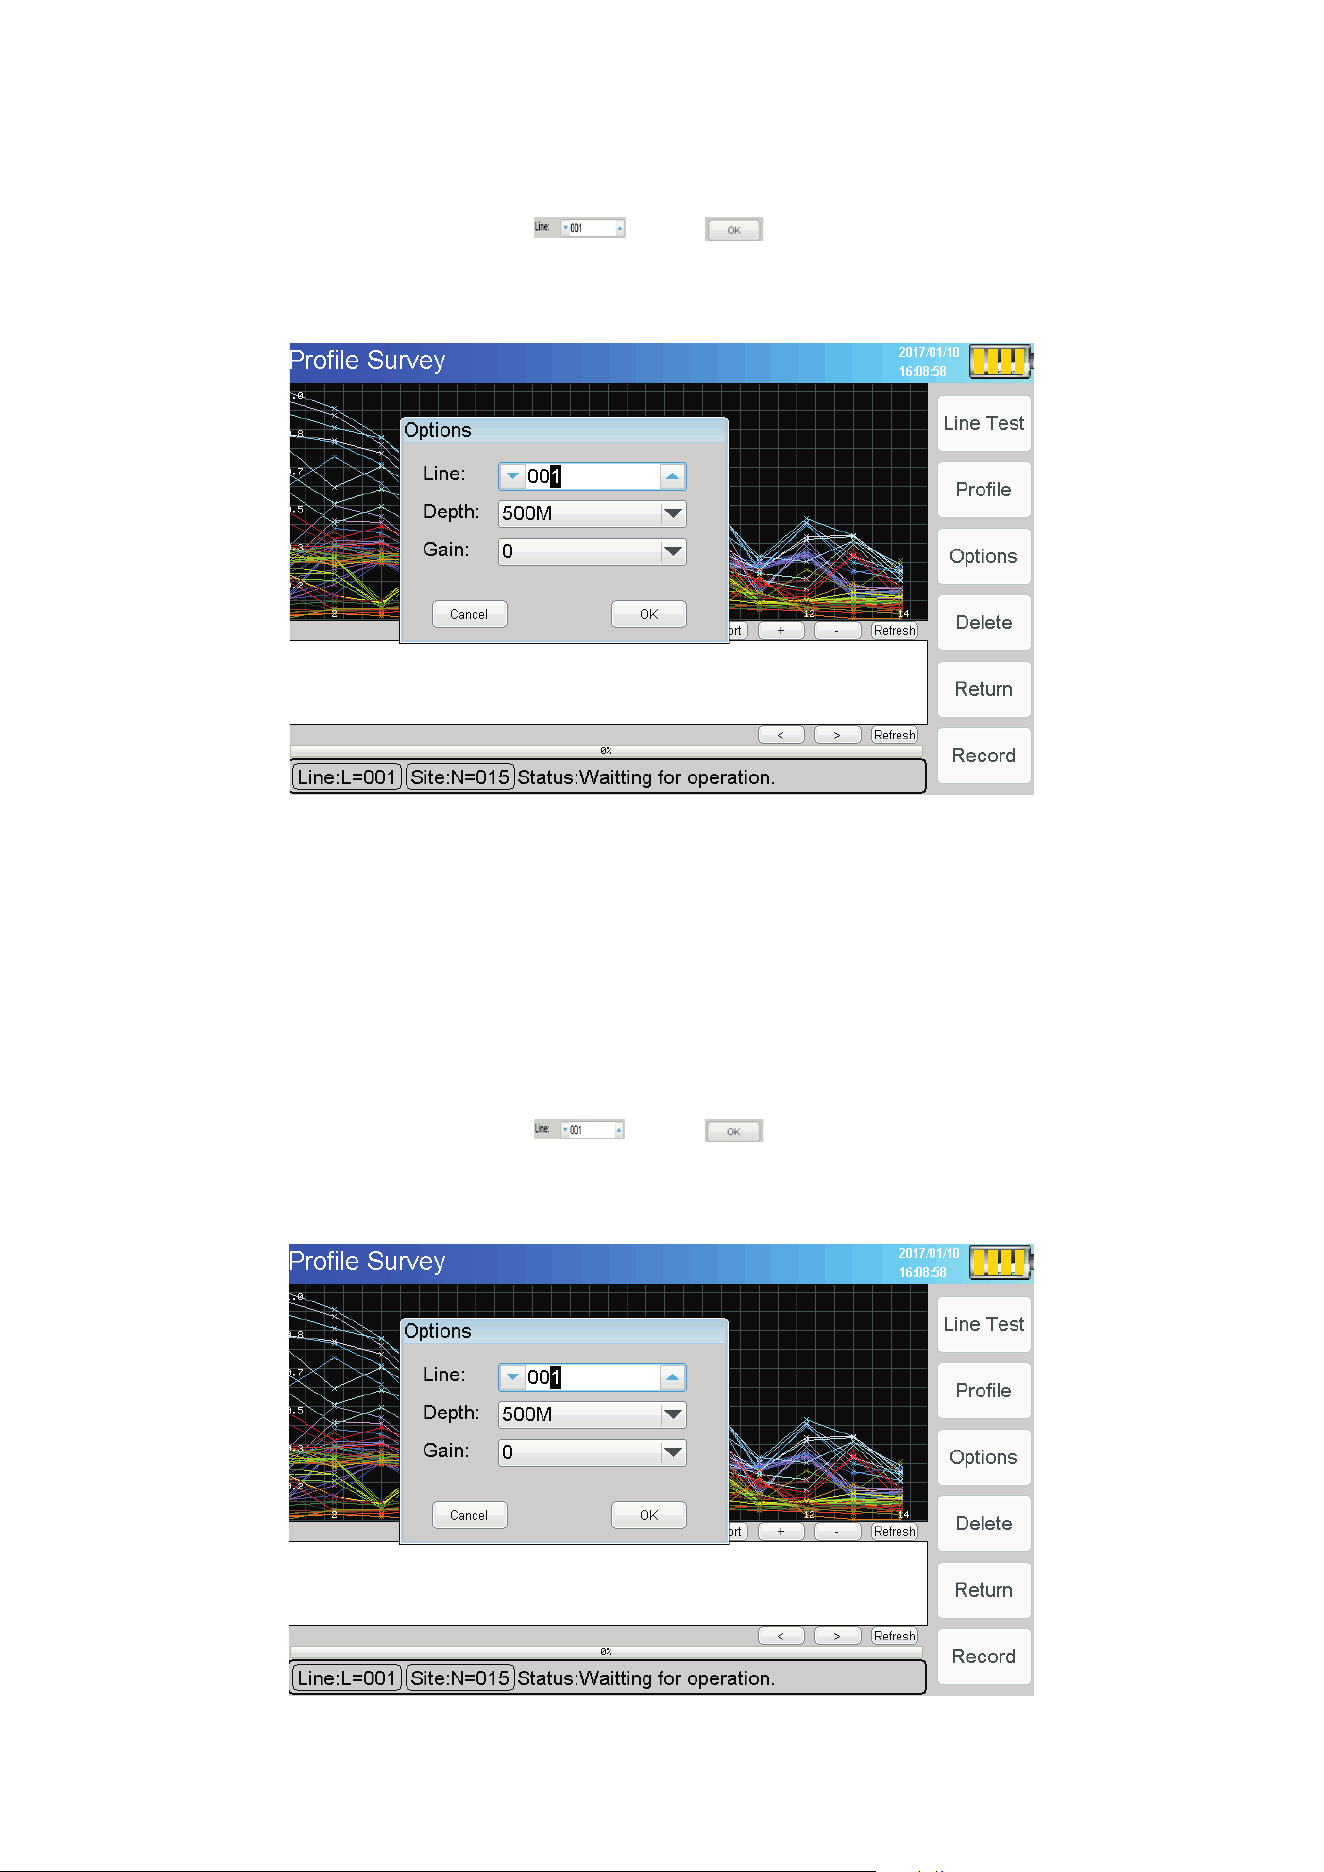
(3)Options:
Click the " Options " button , then pop-up "Options" dialog box (shown above Figure 8)By
selecting the measuring line below , press , you can make the next step Record
operation. Measuring line and measuring site have be introduced at single frequency
measurement state.
Figure 8 profile survey options
-32-
- ��-
- ��-

Profile Curve :In the current survey line, each measuring a measuring site, the system
automatically generates the curve, the measurement is complete, you can click “+” to
appropriate size ,Click "Export" button, the system will automatically save the curve to "File
Explorer" within the current line, with the data saved together.
(2)Profile
Click “Profile”button,The system automatically generates the profile, then we can click
on "+" the picture adjust to enlarge, click on “-” the picture ad
just to narrow.
Click"Export" the system will automatically draw the picture is saved to the "File
Explorer "in the current line of the folder within the line, and the data curve saved together
with the drawing of the profile .as shown in Figure 9.
-33-
Profile Curve :In the current survey line, each measuring a measuring site, the system
automatically generates the curve, the measurement is complete, you can click “+” to
appropriate size ,Click "Export" button, the system will automati
cally save the curve to "File
Explorer" within the current line, with the data saved together.
(2)Profile
Click “Profile”button,The system automatically generates the profile, then we can click
on "+" the picture adjust to enlarge, click on “-” the picture adjust to narrow.
Click"Export" the system will automatically draw the picture is saved to the "File
Explorer "in the current line of the folder within the line, and the data curve saved together
with the drawing of the profile .as shown in Figure 9.
-33-
- ��-
- ��-
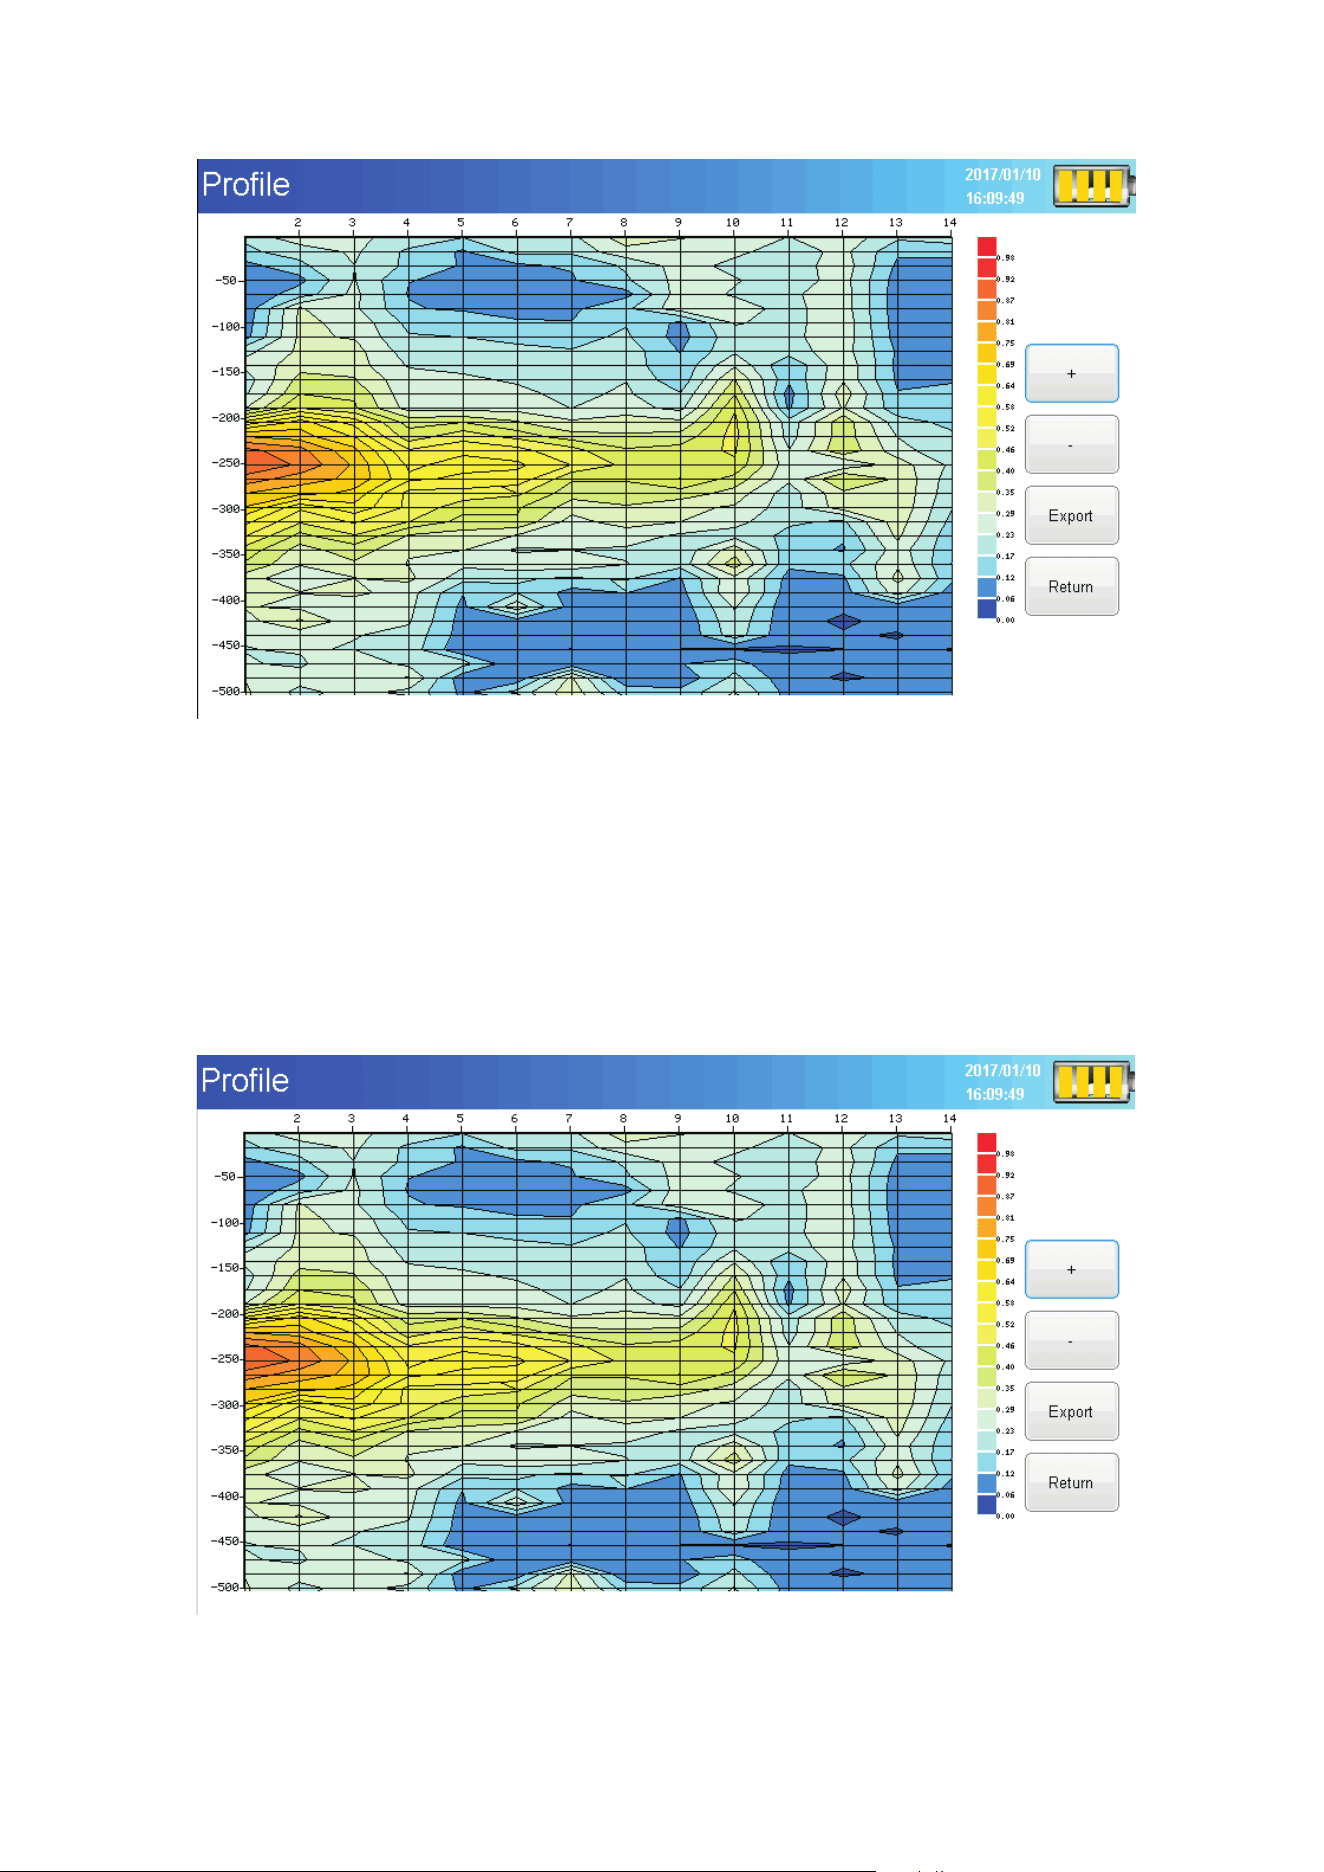
Figure 9 profile map
-
34-
Figure 9 profile map
-
34-
- ��-
- ��-
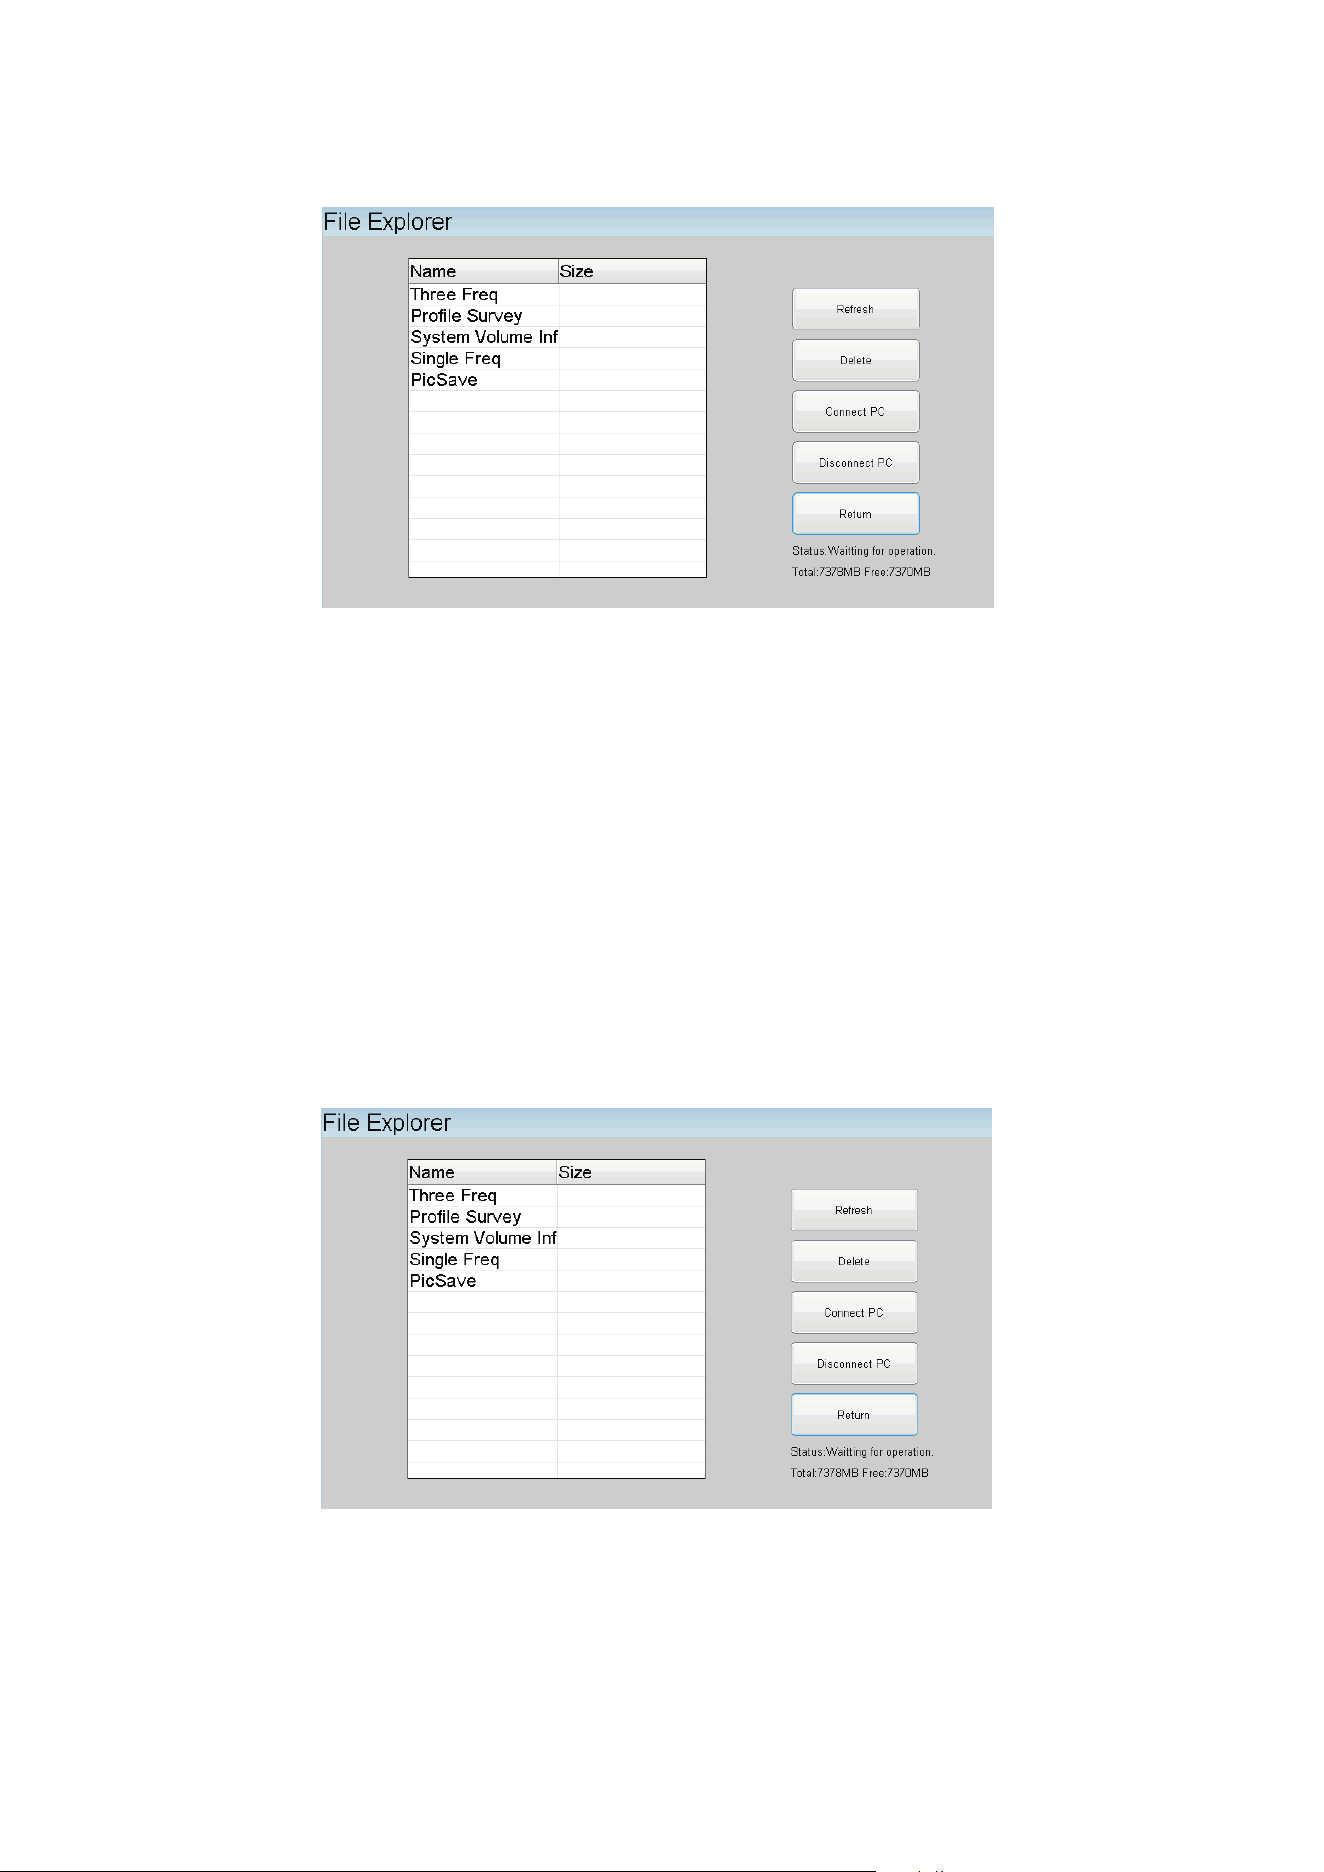
File Explorer
Start and inter the main screen, then click “ File Explorer”,as figure 10 as below:
Note: The folder in the profile survey is divided by the line number, eg "L1", "L2", "L3", and
so on. After the measurement is complete, simply click on the "File Export" and "Profile" of
the curve. There will be three files in each line folder: System volume inf , Profile Survey
,Three Freq . Click on the "connect PC" through the data cable connected to the computer,
copy to the computer open for analysis. If your phone is an Android system and supports "O
-35-
- ��-
- ��-
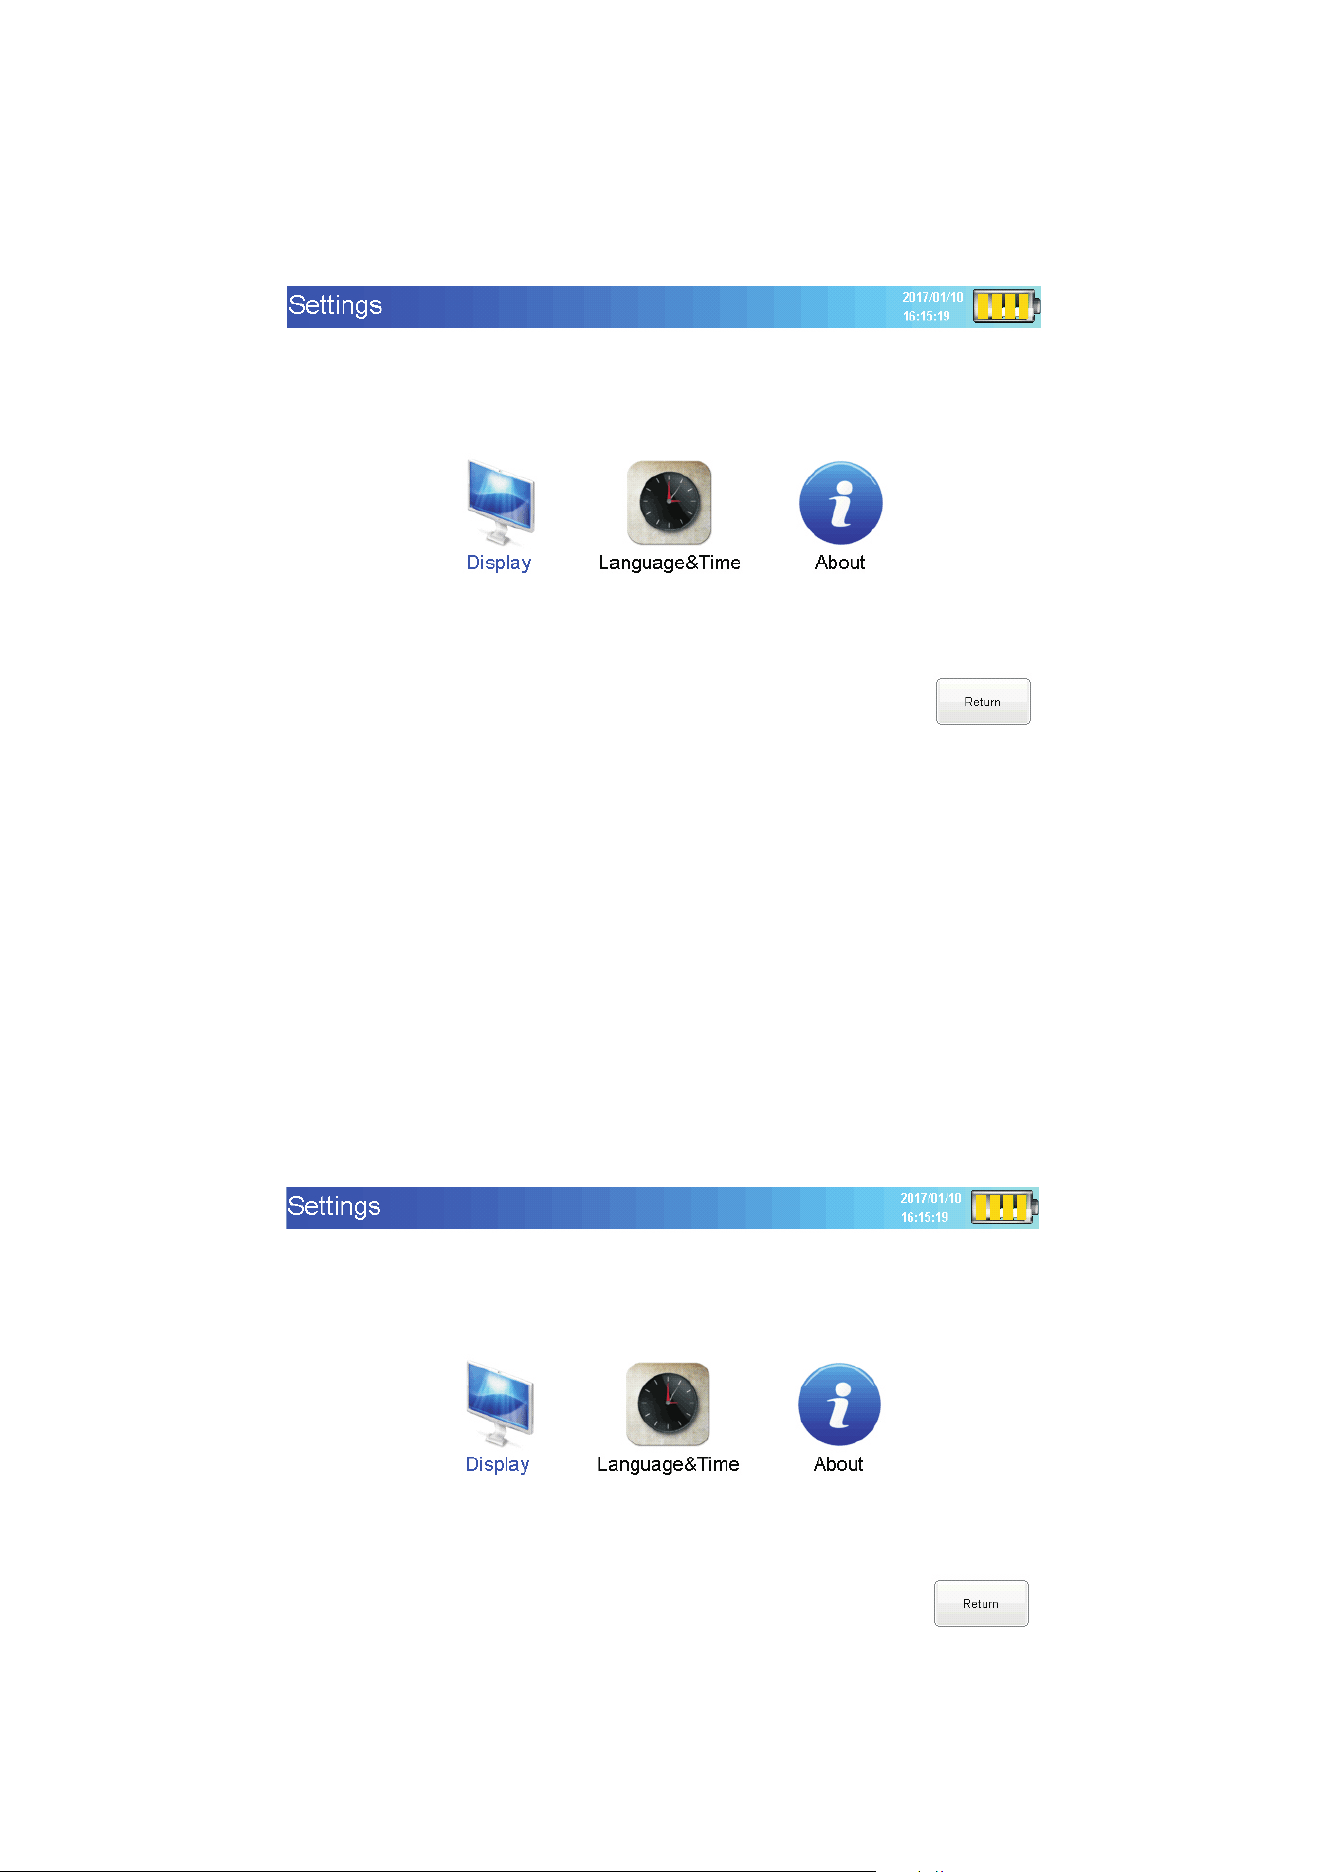
Settings
Start and inter the main screen, Click the “settings, and show as the figure 11 below:
Figure 11. Settings screen
-36-
-TG" function, you can use the "OTG" cable in the package to connect the data cable to
your mobile phone, and copy the data to your mobile phone.
Settings
Start and inter the main screen, Click the “settings, and show as the figure 11 below:
Figure 11. Settings screen
-36-
-TG" function, you can use the "OTG" cable in the package to connect the data cable to
your mobile phone, and copy the data to your mobile phone.
- ��-
- ��-
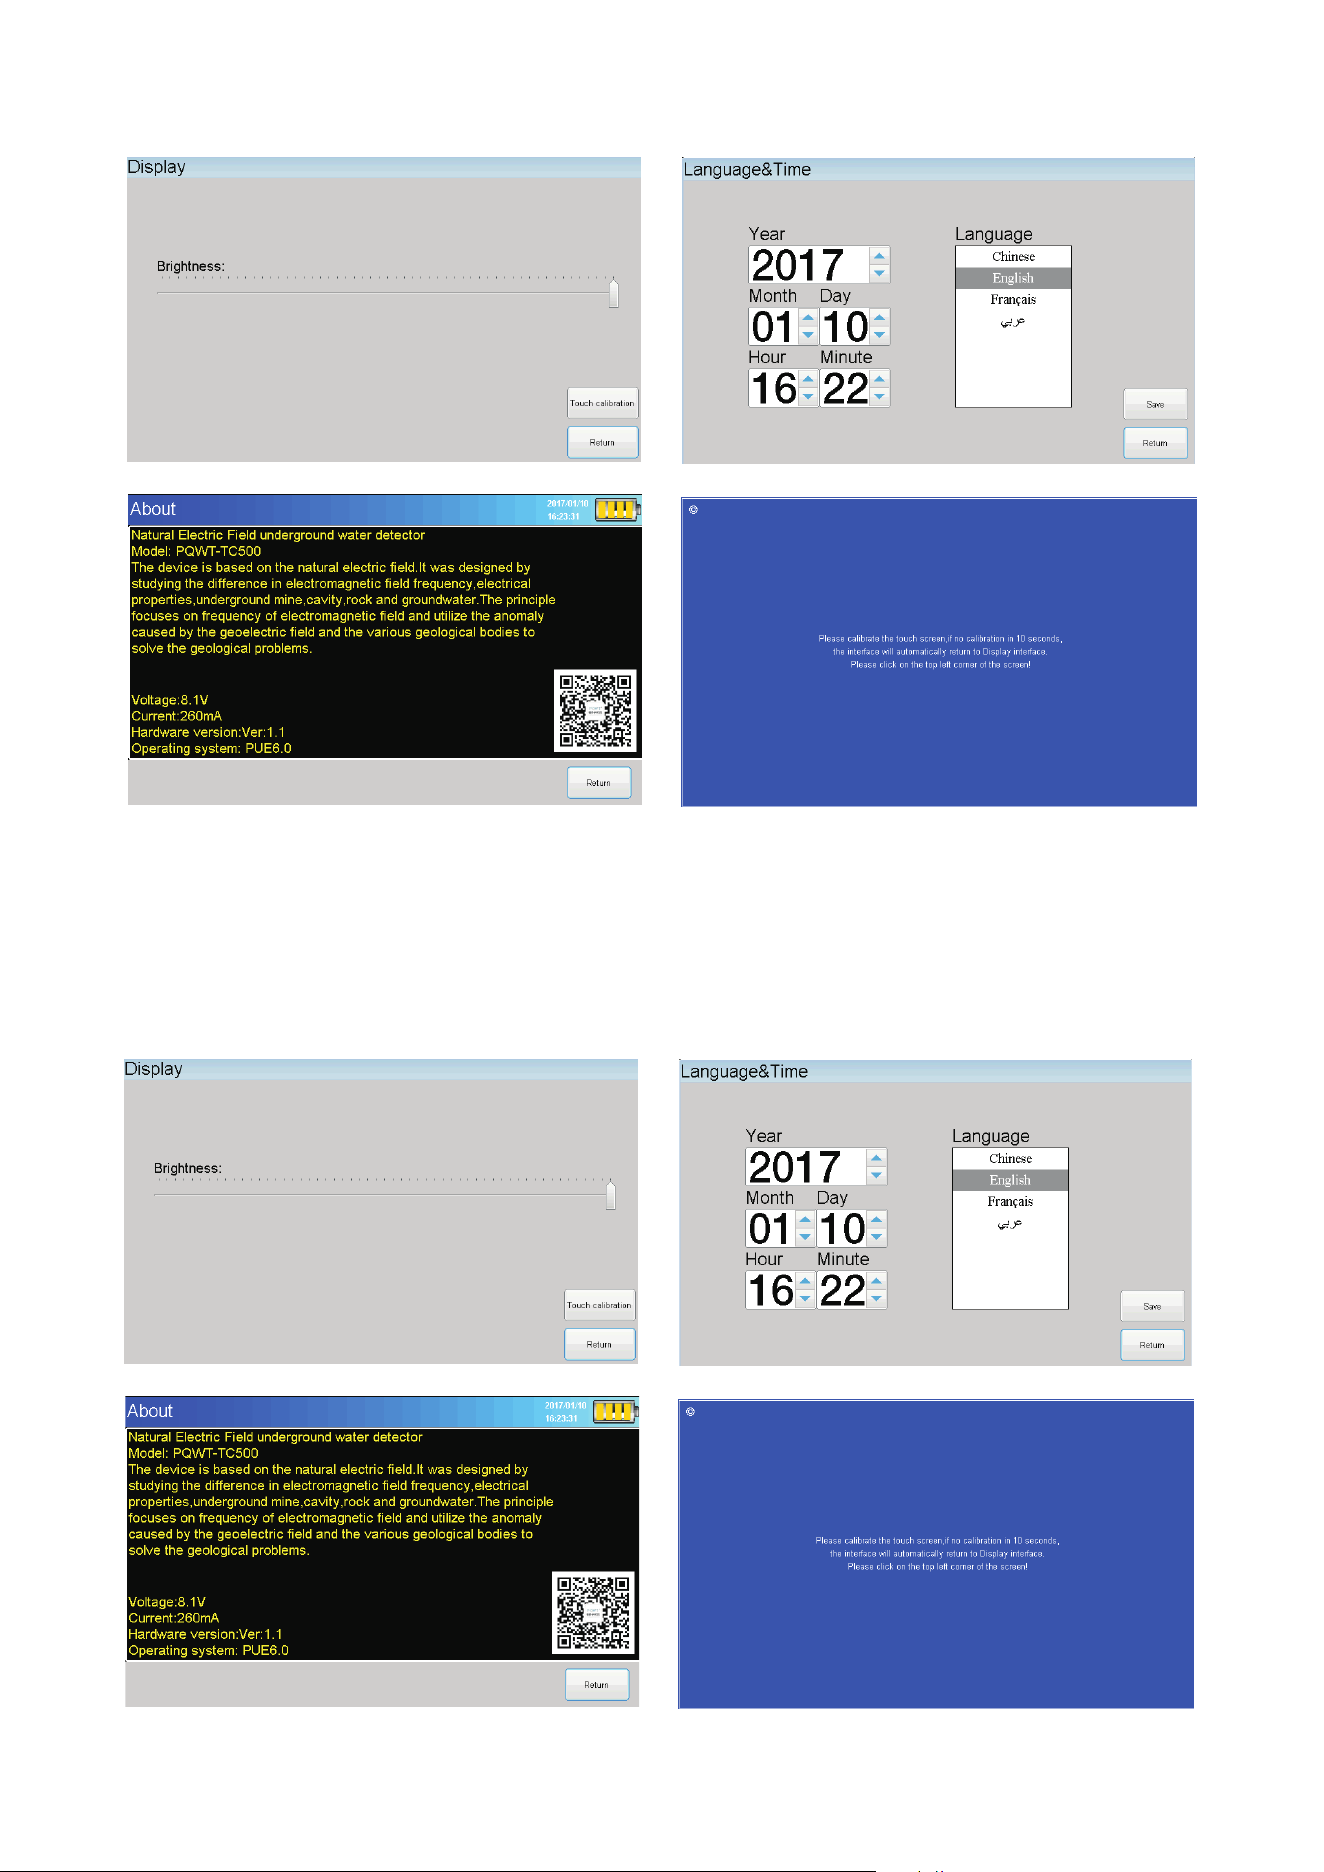
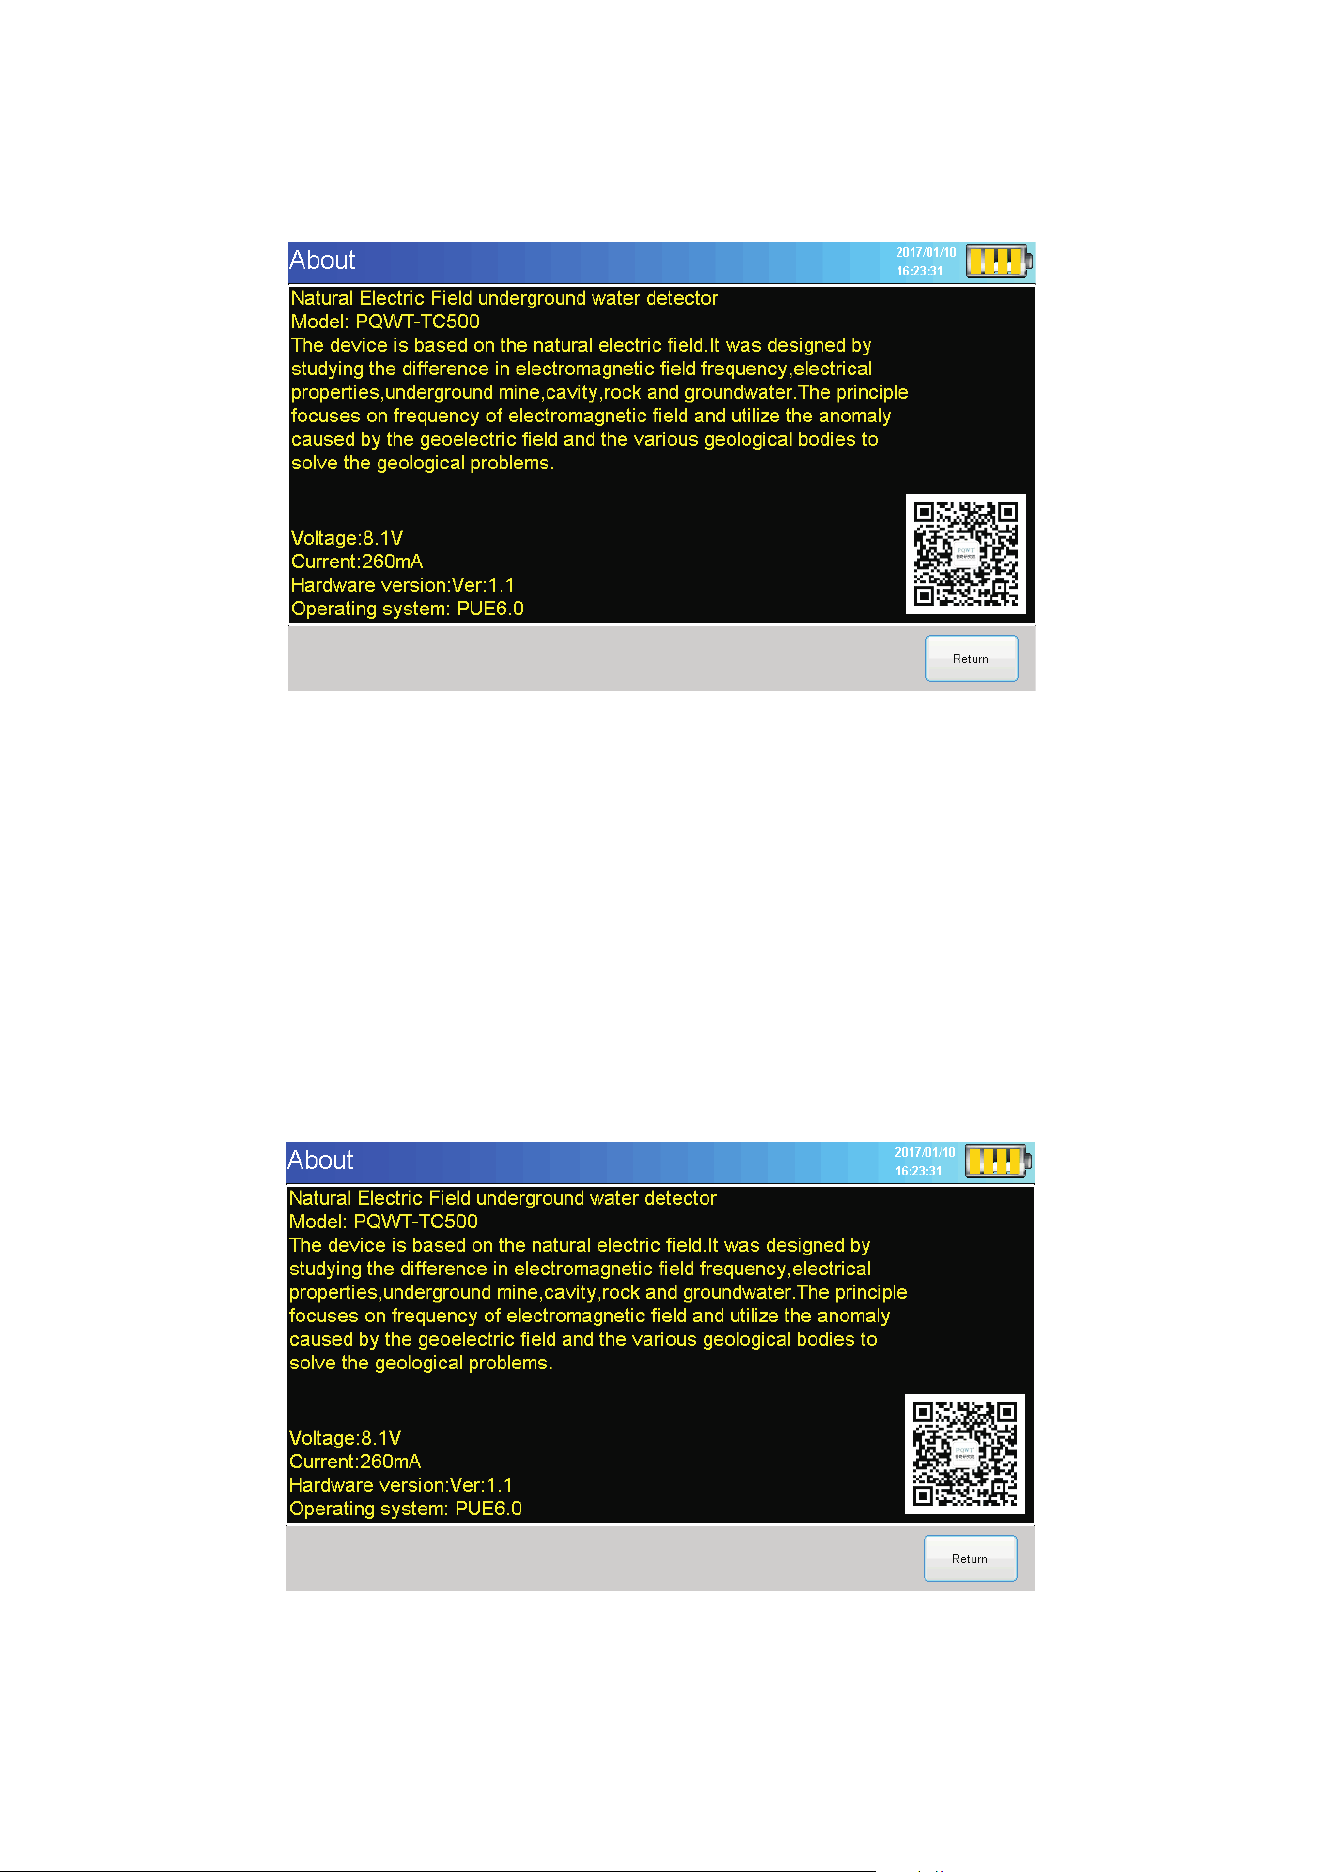
After click the “Display” “Language & Time” “About”, the screen as below:
-37-
Figure 12 Display screen Figure 13 Language & Time screen
Figure 14 About Screen
Figure 15 touch Calibration screen
After click the “Display” “Language & Time” “About”, the screen as below:
-37-
Figure 12 Display screen Figure 13 Language & Time screen
Figure 14 About Screen
Figure 15 touch Calibration screen
- ��-
- ��-
Service
Start and inter the main screen, then click the “Service”, the screen show as below Figure
16.
-38-
Note: All instrument user, please send the data, curve graph, profile map to our exchange
group, It is indispensable of three file.
Service
Start and inter the main screen, then click the “Service”, the screen show as below Figure
16.
-38-
Note: All instrument user, please send the data, curve graph, profile map to our exchange
group, It is indispensable of three file.
- ��-
- ��-

Wiring Method
wiring direction & Location
Geophysical lines are generally arranged perpendicular to the line to be constructed , can
detect tectonic crushed zone on both sides of the border and its different physical
characteristics , contrast is strong, crushing width , extending distinctive characteristics.
In order to accurately locate, confirmed the location of the abnormal ground point,
generally use measuring rope ( or tape ) pull straight line, and mark with paint at the
beginn
ing of the measuring line, so that find、 measure position according to the test
results of drawing later. The collected data each time is the data of midpoint between two
electrode data, the point O is the first set of data as shown below in figure 16. Electrode
spacing is generally 5-10m ( Choose 6/8/10m according to your actual situation), dot
spacing is generally about 0.5-2m, electrode spacing and dot spacing must keep the same
distance for one measuring line.
-39-
Wiring Method
wiring direction & Location
Geophysical lines are generally arranged perpendicular to the line to be constructed , can
detect tectonic crushed zone on both sides of the border and its different physical
characteristics , contrast is strong, crushing width , extending distinctive characteristics.
In order to accurately locate, confirmed the location of the abnormal ground point,
generally use measuring rope ( or tape ) pull straight line, and mark with paint at the
beginnin
g of the measuring line, so that find、 measure position according to the test
results of drawing later. The collected data each time is the data of midpoint between two
electrode data, the point O is the first set of data as shown below in figure 16. Electrode
spacing is generally 5-10m ( Choose 6/8/10m according to your actual situation), dot
spacing is generally about 0.5-2m, electrode spacing and dot spacing must keep the same
distance for one measuring line.
-39-
- ��-
- ��-
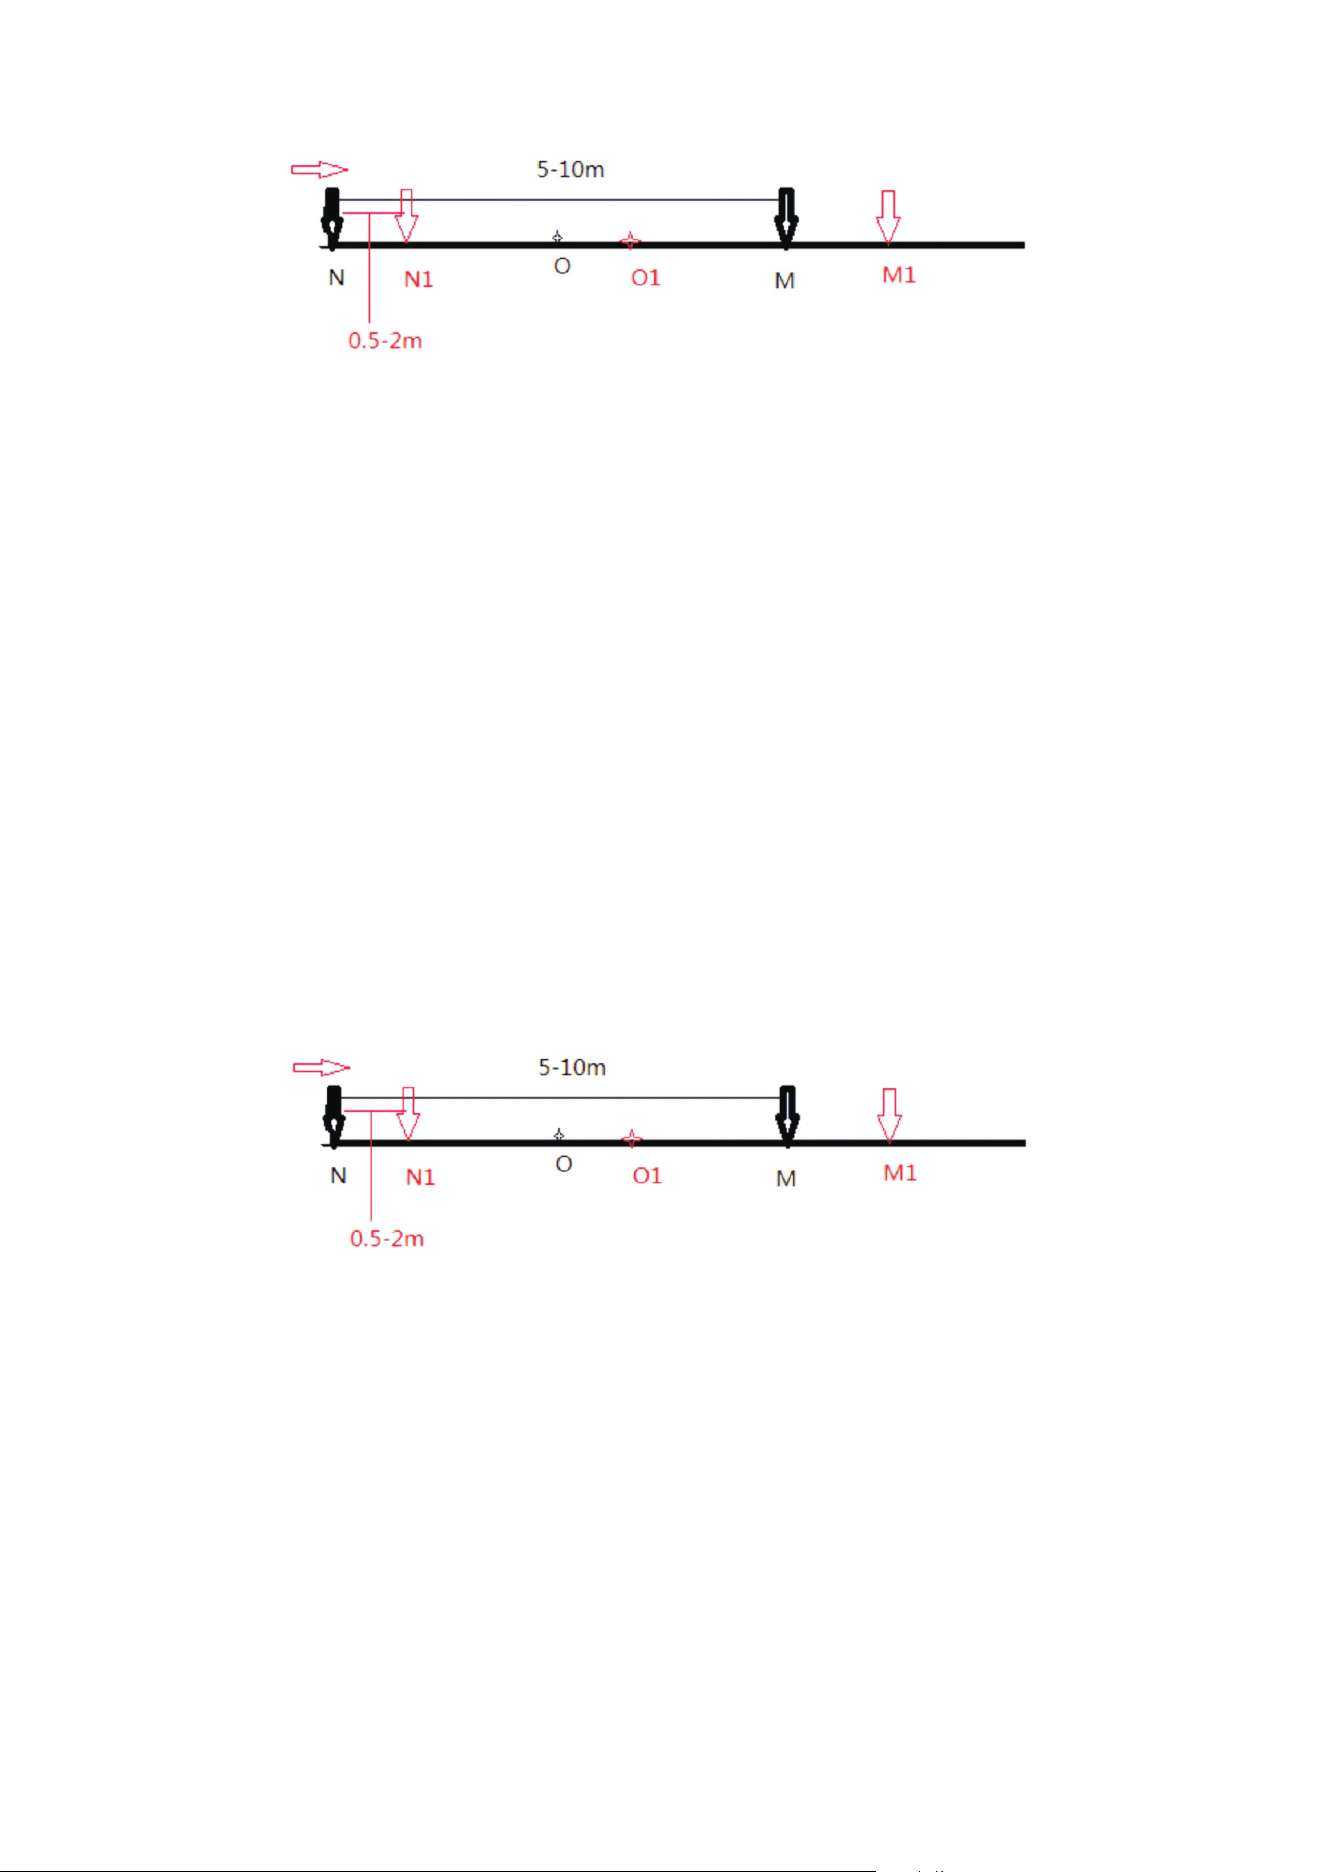
Figure 2 Electrode Wiring Method
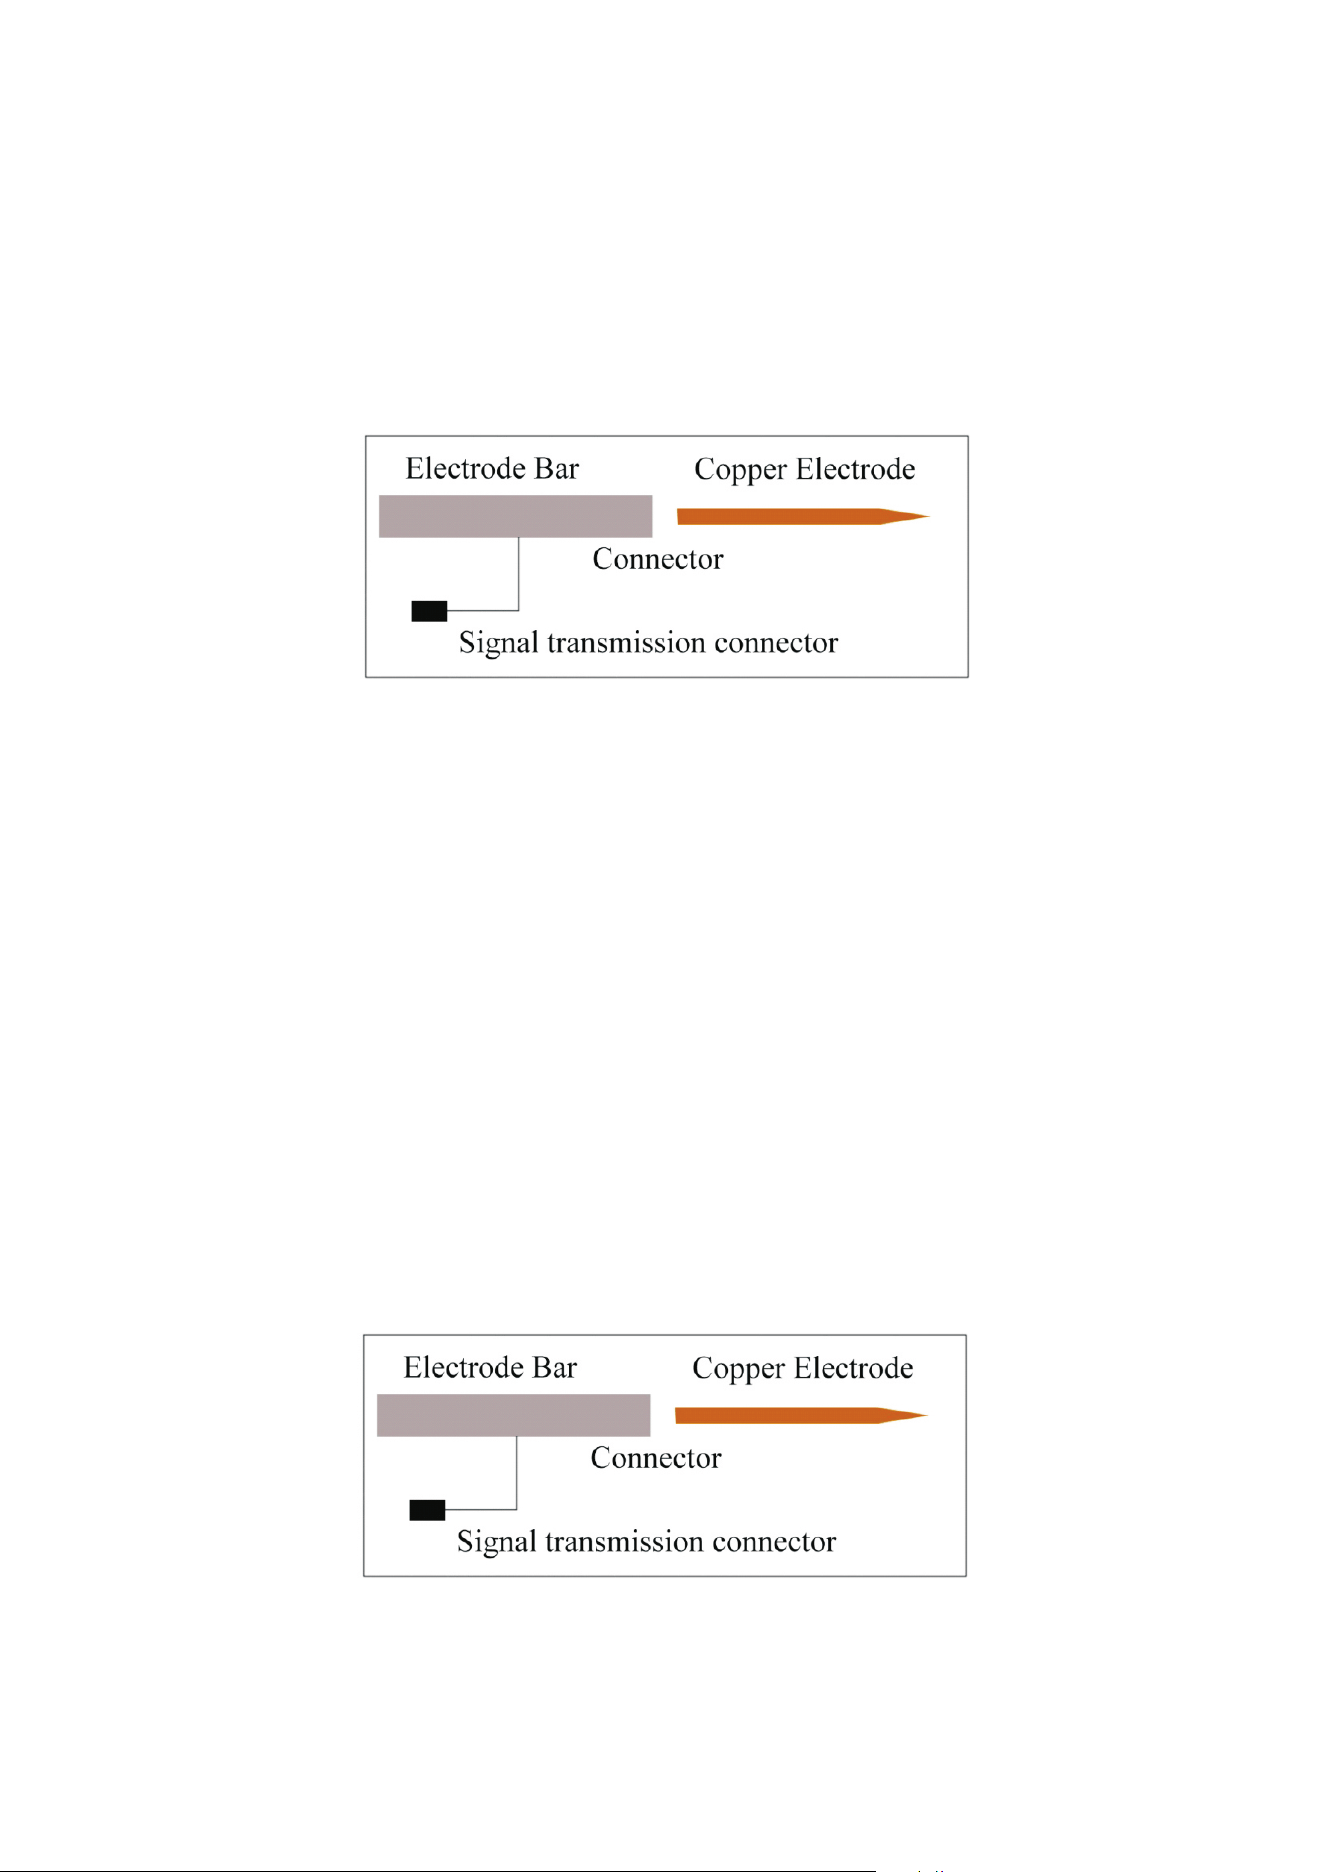
MN Electrode Introduction
The electrode with alloy rods and copper electrodes. Usage: As following Figure 17 to
connect a hand-held alloy rod with copper electrode inserted into the soil, the puddled soil is
recommended in each insertion. Before click on the "Record " , Press " Line Test " firstly,
judged good grounding , Indicator lights up and then process measuring.
Electrode
-40-
Figure 2 Electrode Wiring Method
MN Electrode Introduction
The electrode with alloy rods and copper electrodes. Usage: As following Figure 17 to
connect a hand-held alloy rod with copper electrode inserted into the soil, the puddled soil is
recommended in each insertion. Before click on the "Record " , Press " Line Test " firstly,
judged good grounding , Indicator lights up and then process measuring.
Electrode
-40-
- ��-
- ��-
Note: On dry and hard ground, it’s difficult to use hand to penetrate the electrode, pls
never hammer the electorde into ground, it will broke the machine function. You can mix
some water, salt and soil in a barrel, then put the mud on the hard point so that you can
insert the electrode. Meanwhile, you need cover the line that you will measure with salt
water to improve the electrical conductivity.
Figure 17 Electrode connecting diagram
-41-
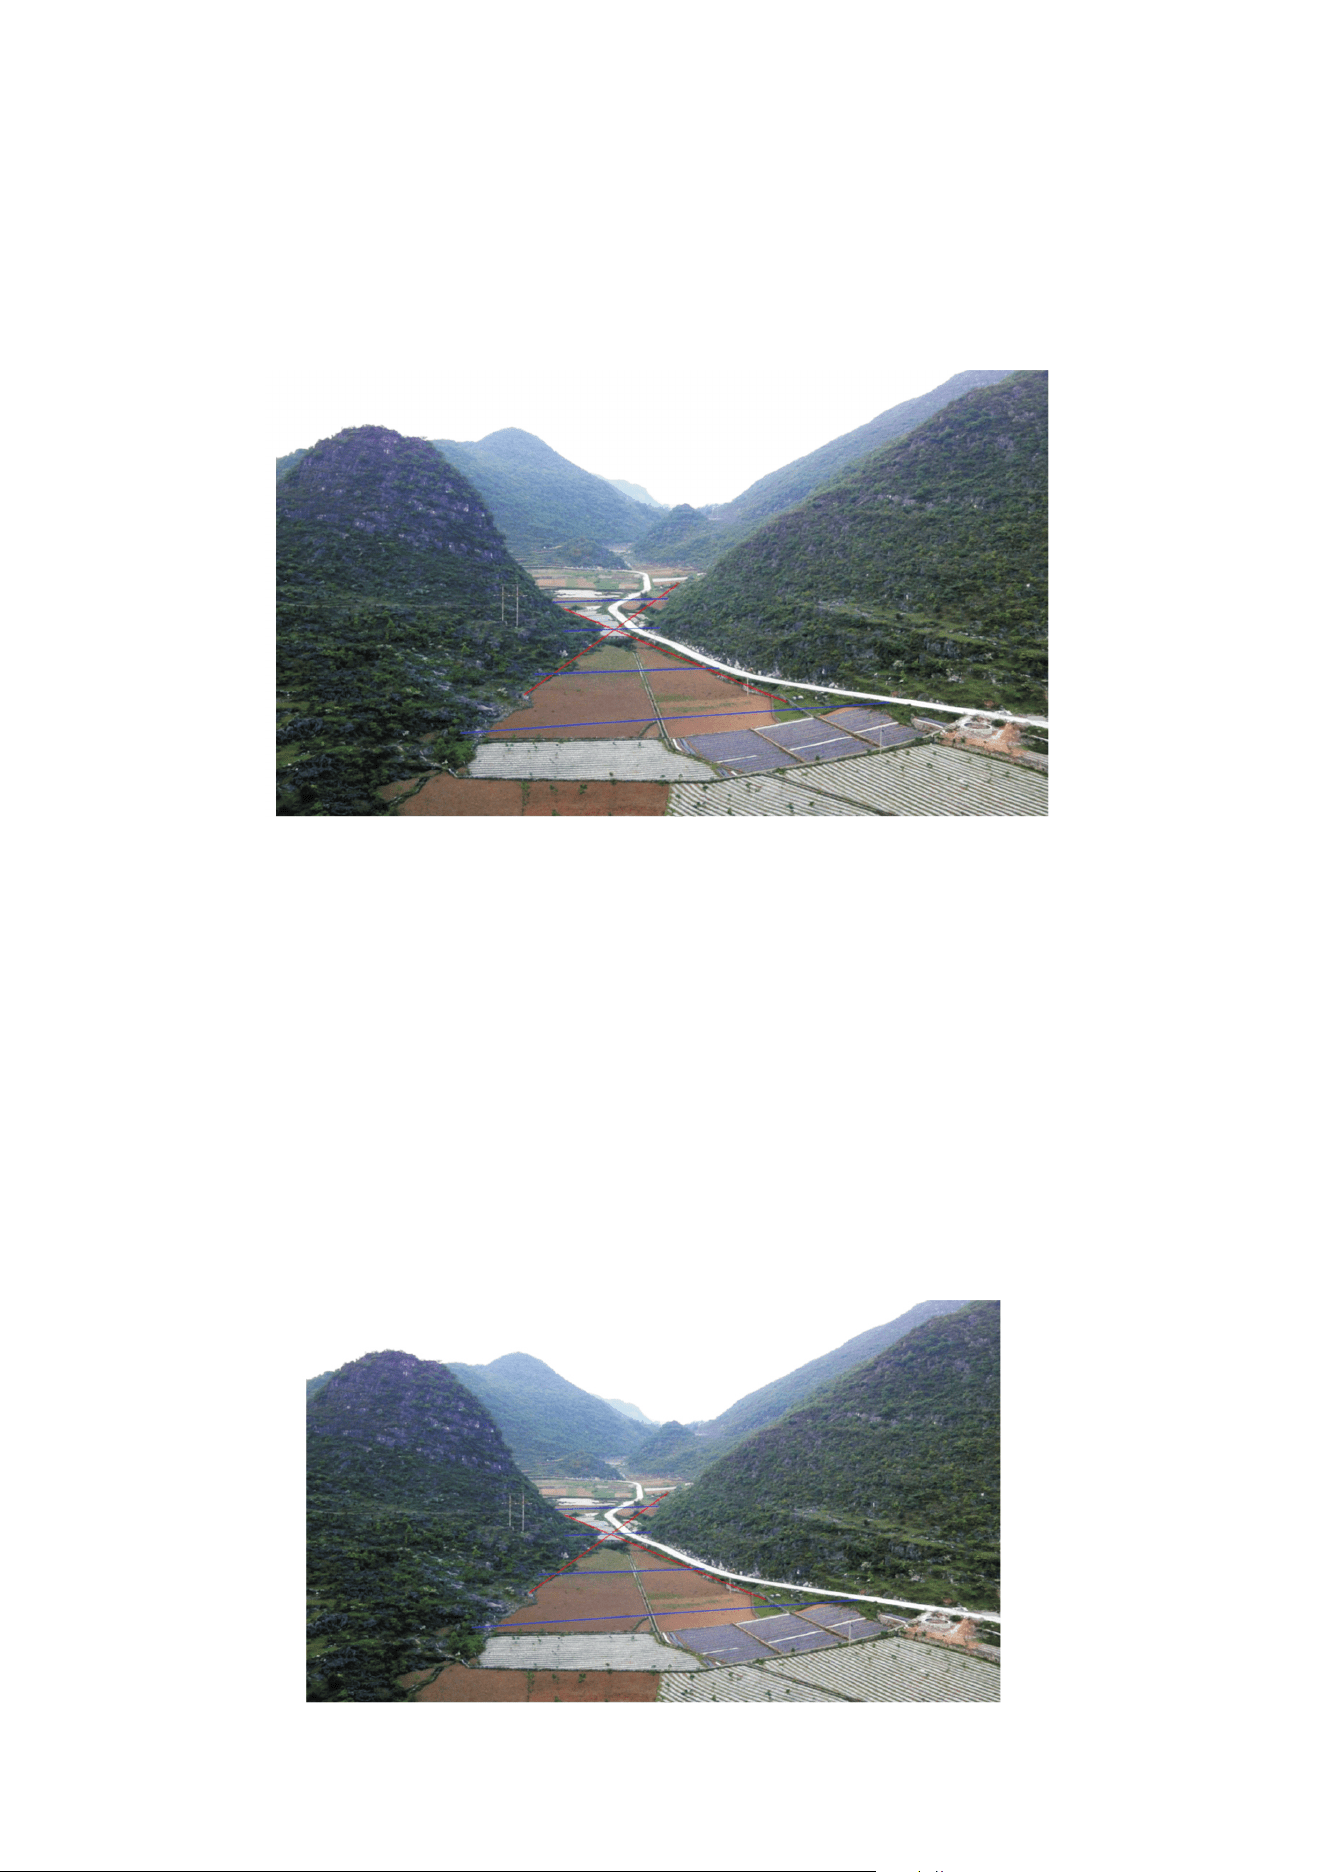
Advised Measurement Approach
In order to locate accurately, judge the location of the abnormal ground point, generally
using lining rope as straight line, carry out paint markers at the beginning or middle
position, so that find the corresponding position according to the test results of graph
after measuring.
Cross Method
-42-
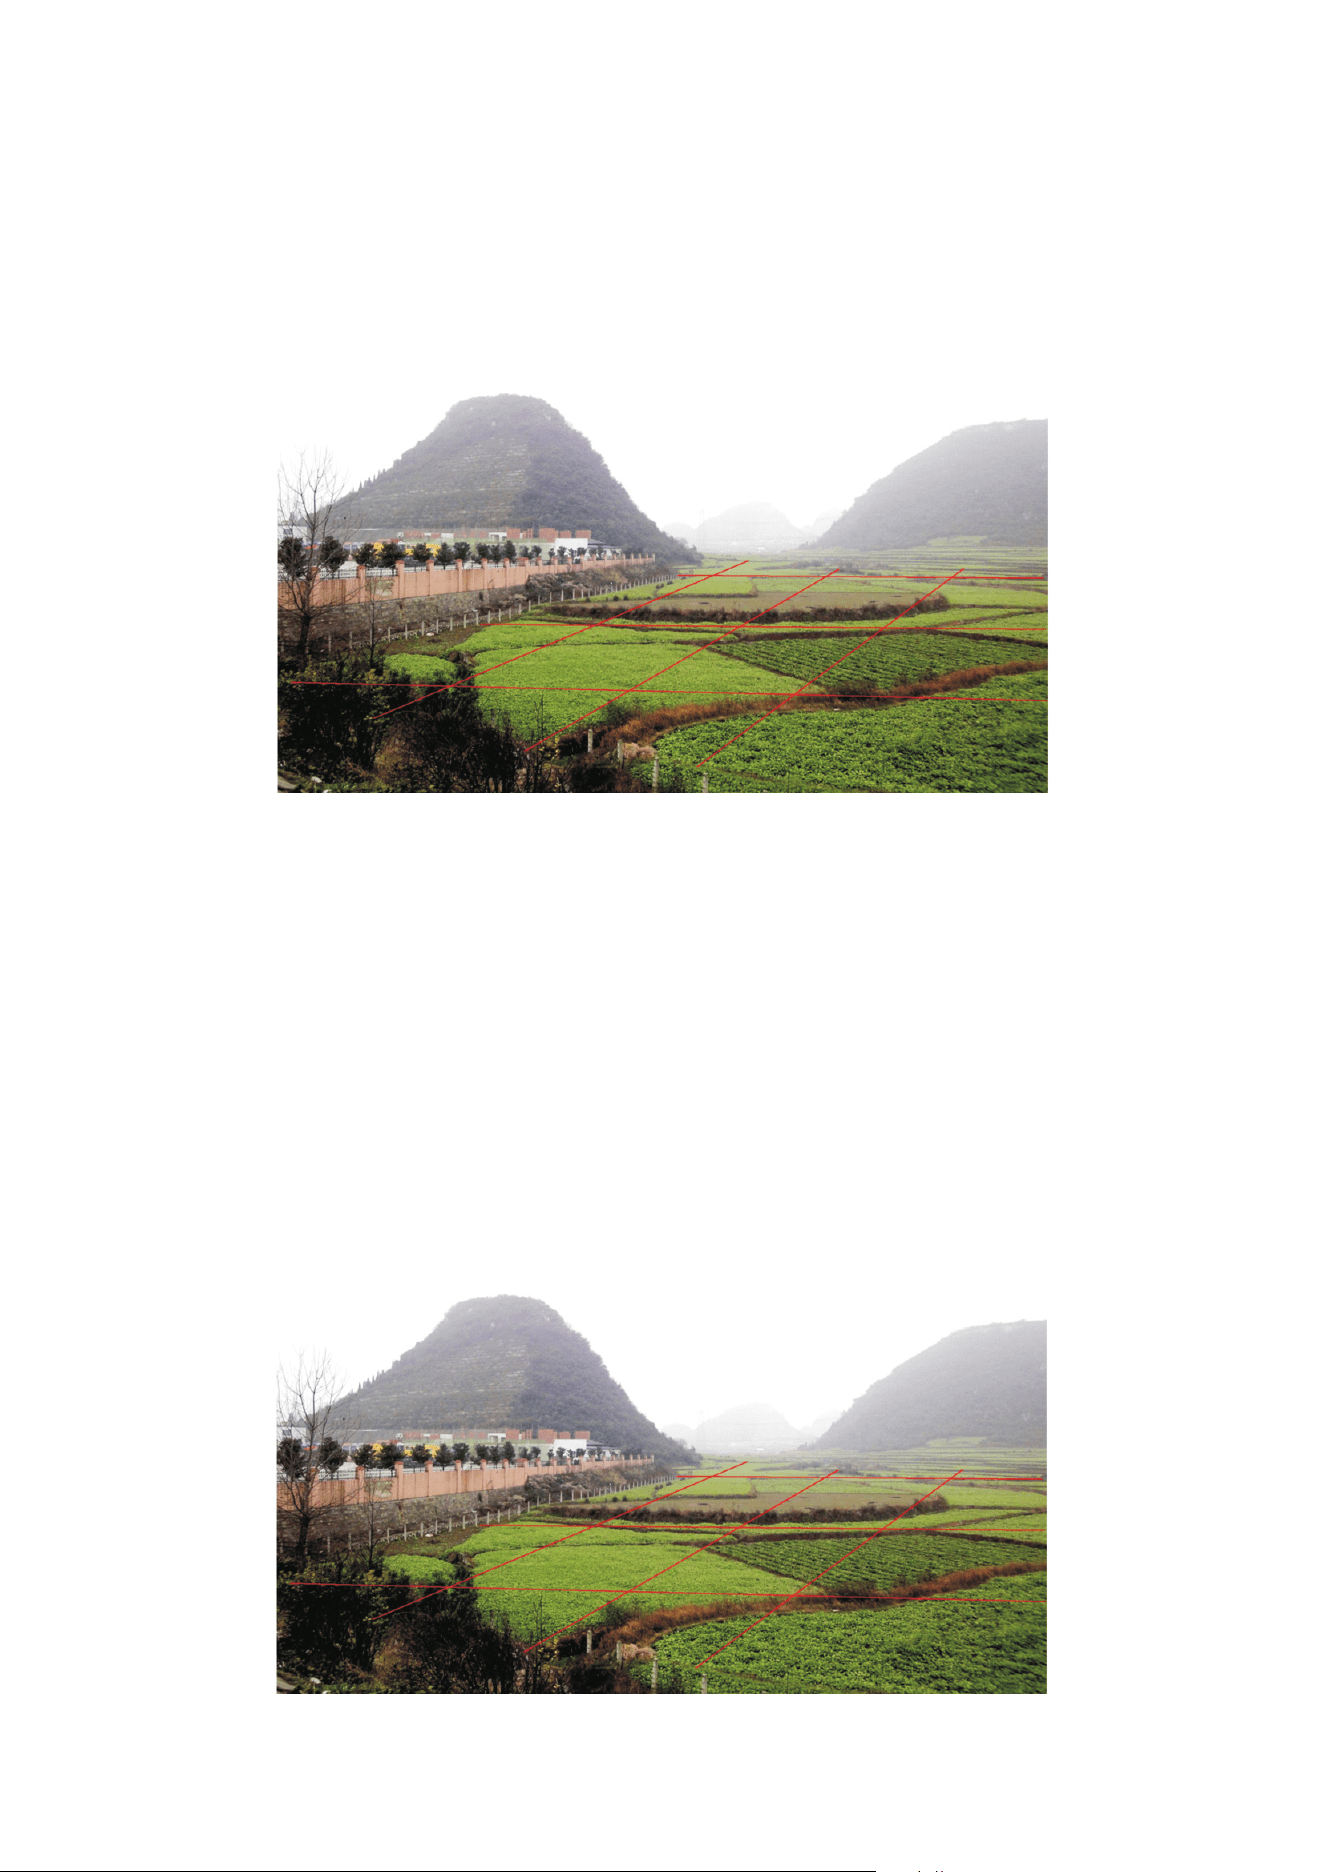
Grid Method
Open area-grid or vertical cross-wiring:the terrain is relatively open,flat,reference to the
ground vallegy,can not directly determine the direction of underground tectonic line.The
square grid is used to detect the underground structure.As shown above in red line mark;
-43-
Grid Method
Open area-grid or vertical cross-wiring:the terrain is relatively open,flat,reference to the
ground vallegy,can not directly determine the direction of underground tectonic line.The
square grid is used to detect the underground structure.As shown above in red line mark;
-43-

Guide for After-sale Services
Within two years of the purchase date, if instrument quality problems, please send us
the photos, we will send the required part or repair for you. Each of us shall take care
of the corresponding shipping cost on each side.
Please save the purchase-related bills and warranty certificate together as a warranty
certificate, warranty card shall not be painted .Otherwise, the warranty will be invalid.
Instrument warranty does not cover the accident, misuse, neglect, alteration,
modification, ma
gnetized, unauthorized service and damage caused by prolonged
exposure in corrosive salt mixture.
If need to purchase related accessories, you can contact Hunan Puqi Geologic
Exploration Equipment Institute customer service.
Sales service providers have the obligation to provide quality service to Hunan Puqi
Geological Exploration Equipment Institute Customer , such as objection to the
quality of their services can directly complaints to our customer service .
-44-

Configuration Table
-45-
H ost m achine
1 set
Electrode Cable
1 pc
Charger
1 pc
A llo y Electrode B ar
1 pair
Copper Electrode
1 pair
USB stick
1 pc
Universal adapter
plugs
1 pc
Configuration Table
-45-
H ost m achine
1 set
Electrode Cable
1 pc
Charger
1 pc
A llo y Electrode B ar
1 pair
Copper Electrode
1 pair
USB stick
1 pc
Universal adapter
plugs
1 pc

Copyright Notice
1. Hunan Puqi Geologic Exploration Equipment Institute has the final interpretation of the
operating instructions.
2. Hunan Puqi Geologic Exploration Equipment Institute reserves right to modify
equipment specification without any advance notice.
3. All pictures for reference only in operation manual, please in kind prevail.
4. Please observe local laws and regulations, Hunan Puqi Geologic Exploration Equipment
Institute will not be responsible for any legal issu
es which caused by the instrument.
5. The products of Hunan Puqi Geologic Exploration Equipment Institute are patented
products, If anyone imitates, we would investigate his legal liabilit.
6.The product of collected data is for reference only.Geophysical prospecting has multiple
solutions. Please combine the local hydrological and geological conditions to analyze. The
institute does not bear all the consequences and losses caused by it.
-46-
Copyright Notice
1. Hunan Puqi Geologic Exploration Equipment Institute has the final interpretation of the
operating instructions.
2. Hunan Puqi Geologic Exploration Equipment Institute reserves right to modify
equipment specification without any advance notice.
3. All pictures for reference only in operation manual, please in kind prevail.
4. Please observe local laws and regulations, Hunan Puqi Geologic Exploration Equipment
Institute will not be responsible for any legal issues which caused by the instrument.
5. The products of Huna
n Puqi Geologic Exploration Equipment Institute are patented
products, If anyone imitates, we would investigate his legal liabilit.
6.The product of collected data is for reference only.Geophysical prospecting has multiple
solutions. Please combine the local hydrological and geological conditions to analyze. The
institute does not bear all the consequences and losses caused by it.
-46-