Loading ...
Loading ...
Loading ...
Chapter 5 Vertical System
81
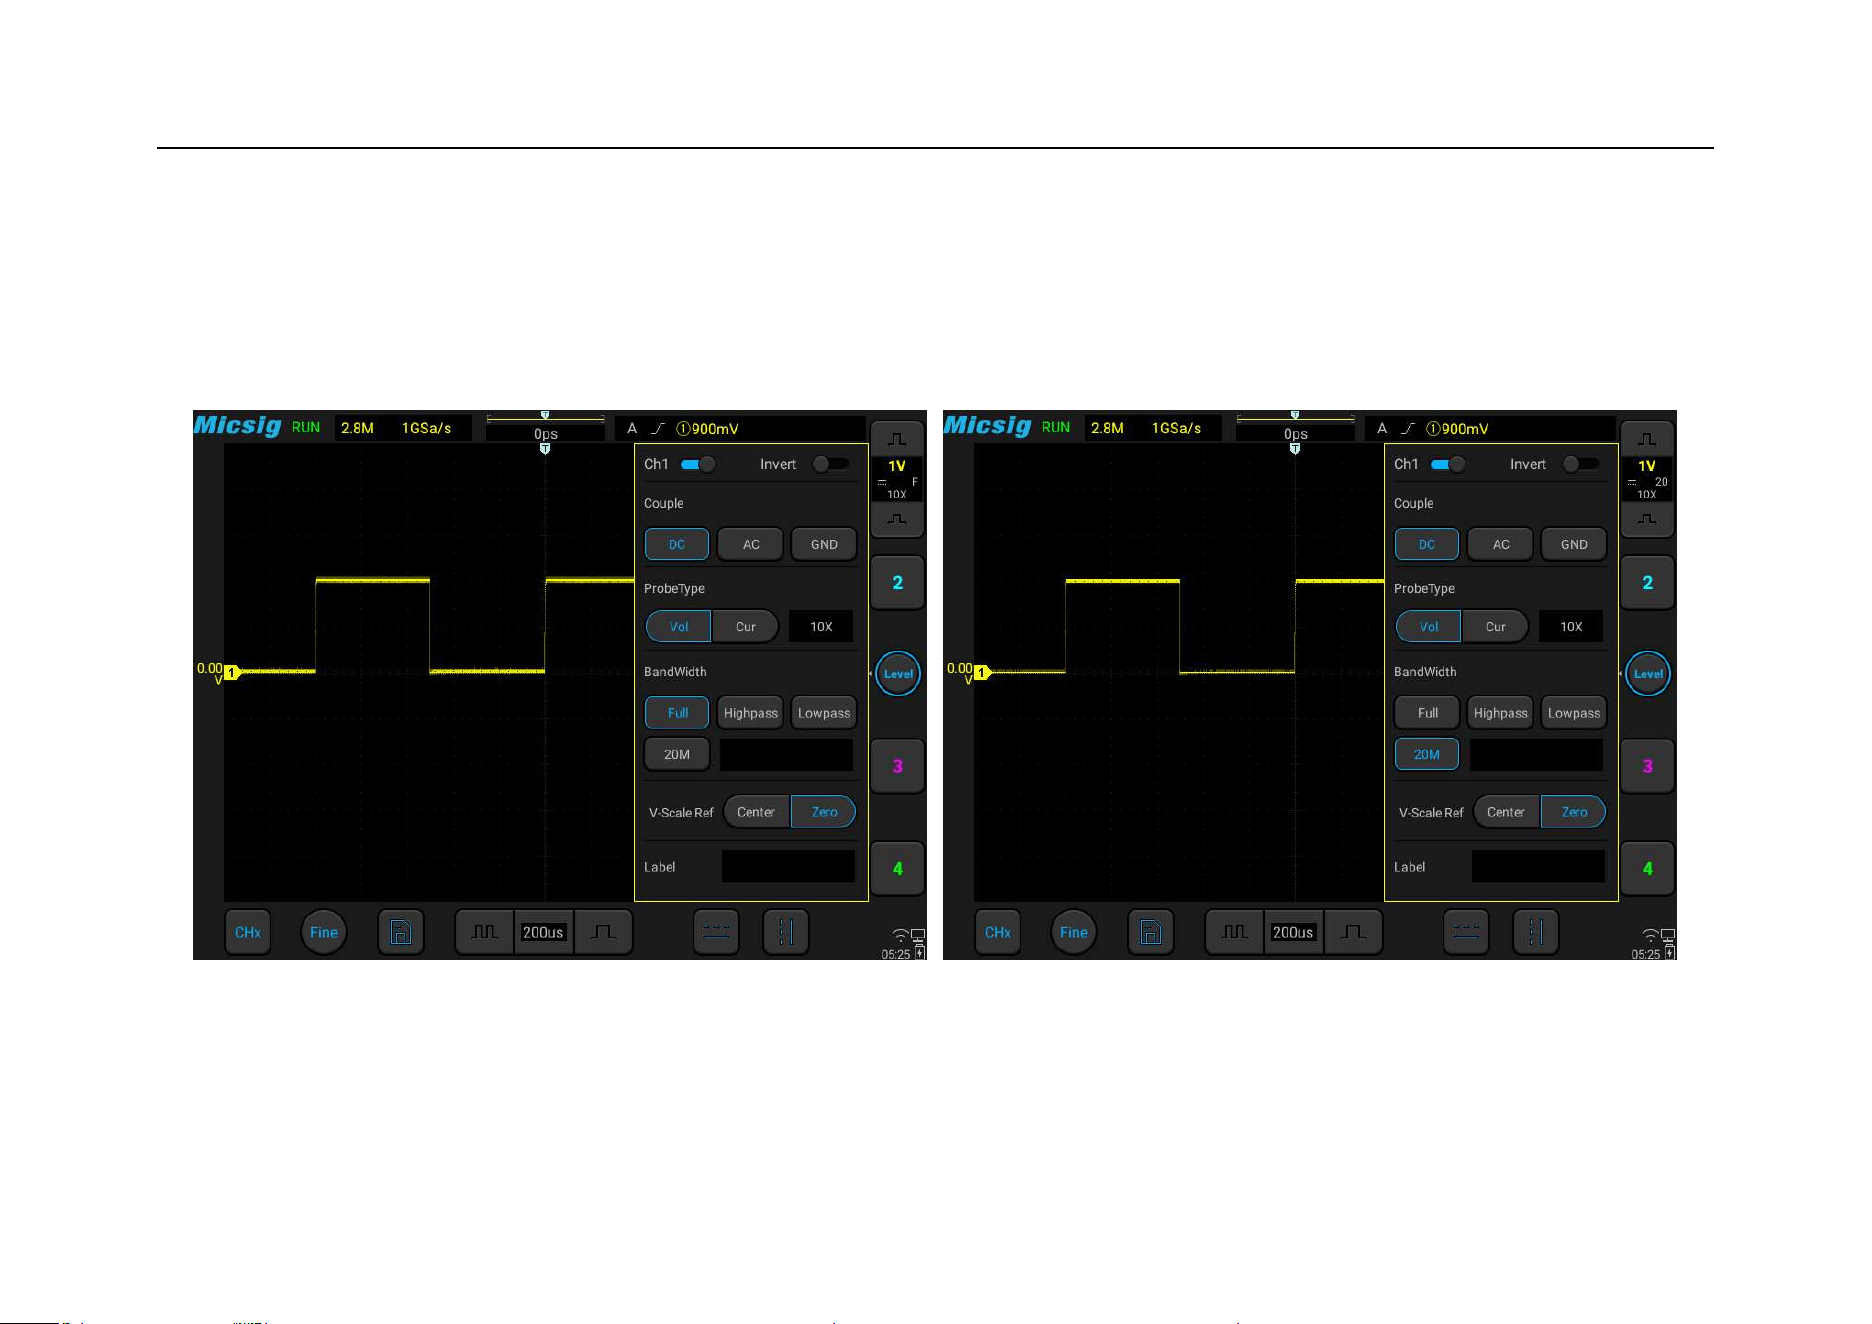
The difference in bandwidth limitation can be visualized by the waveform. The full bandwidth is shown in Figure
5-10, the 20M bandwidth is shown in Figure 5-11, the high pass is shown in Figure 5-12, and the low pass is shown
in Figure 5-13.
Figure 5-10 Full Bandwidth
Figure 5-11 20M Bandwidth
Loading ...
Loading ...
Loading ...