Loading ...
Loading ...
Loading ...

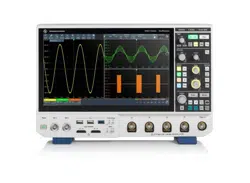
Rohde & Schwarz R&S®MXO4 Series Oscilloscope 21
Perform low-frequency response analysis
The R&S®MXO4-K36 frequency response analysis (FRA)
option lets you perform low-frequency response analy-
sis on your oscilloscope easily and quickly. It character-
izes the frequency response of a variety of electronic
devices, including passive filters and amplifier circuits.
For switched-mode power supplies, it measures the con-
trol loop response (CLR) and power supply rejection ratio
(PSRR).
The FRA option uses the oscilloscope’s built-in waveform
generator to create stimulus signals ranging from 10Hz to
100MHz. Measuring the ratio of the stimulus signal and
the output signal of the DUT at each test frequency, the
oscilloscope plots gain and phase logarithmically.
FREQUENCY RESPONSE ANALYSIS
Features and functionalities
Amplitude profile
The R&S®MXO4-K36 provides user-configurable profiles of
the amplitude output level from the generator. This helps
improve signal-to-noise ratio (SNR) at different frequency
ranges when performing measurement on CLR and PSRR.
Users can also load lookup tables for generator settings.
Improved resolution and marker support
This includes user configurable points per decade to adjust
needed resolution and sweep time. Markers are available
on the traces with a table to show corresponding coordi-
nates. Users can easily determine the phase and gain mar-
gin with an auto placement function.
Parallel display of time domain
Having both time and frequency domain views allows the
user to monitor if the injected signal causes distortion that
leads to errors in the measurement. These effects are hard
to spot from just the Bode plot. Using the time domain
window of the oscilloscope is a great way to adjust the
amplitude profile to the optimal level.
Measurement table
The table of measurement results provides information
about each measured point, consisting of frequency, gain
and phase shift. The markers and table allow interactive
display of the selected information. For reporting pur-
poses, screenshots, table results or both can be quickly
saved to a USB device.
Broad probe portfolio
Accurate CLR and PSRR characterization is highly depen-
dent on choosing the right probes since the peak-to-peak
amplitudes of both V
in
and V
out
can be very low at some
test frequencies. These values could be buried in the oscil-
loscope’s noise floor and in the switching noise of the DUT
itself. We recommend the low-noise R&S®RT-ZP1X 38MHz
bandwidth 1:1 passive probes to reduce attenuation error
and provide the best SNR.
Making bode plots with R&S®MXO4 series
Loading ...
Loading ...
Loading ...