Loading ...
Loading ...
Loading ...
23
ment based on the measurements can be dangerous. Always
follow your GP’s instructions.
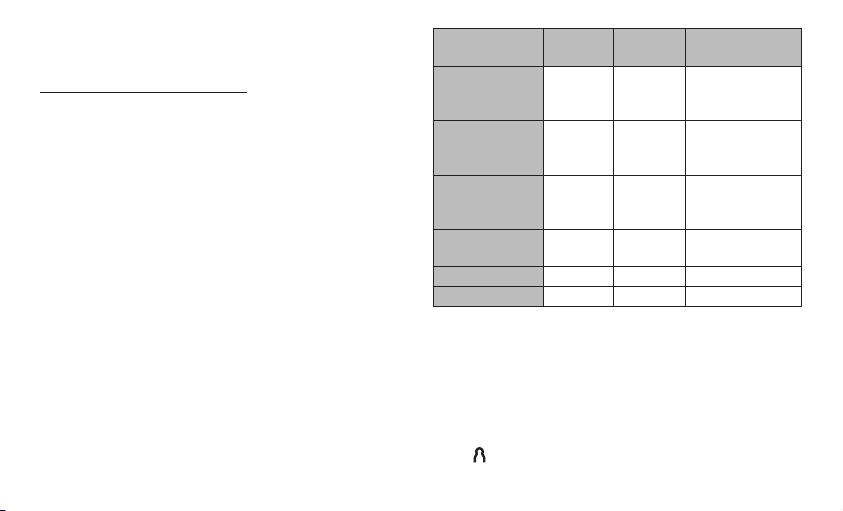
Classification of measurements:
The measurements can be classified and evaluated in accord-
ance with the following table.
However, these standard values serve only as a general guide-
line, as the individual blood pressure varies in different people
and different age groups etc.
It is important to consult your doctor regularly for advice. Your
doctor will tell you your individual values for normal blood pres-
sure as well as the value above which your blood pressure is
classified as dangerous.
The bar chart on the display and the scale on the unit show
which category the recorded blood pressure values fall into. If
the values of systole and diastole fall into two different cate-
gories (e.g. systole in the ’High normal’ category and diastole
in the ’Normal’ category), the graphical classification on the
device always shows the higher category; for the example given
this would be ’High normal’.
Blood pressure
value category
Systole
(in mmHg)
Diastole
(in mmHg)
Action
Setting 3:
severe hyper-
tension
≥ 180 ≥ 110
seek medical
attention
Setting 2:
moderate hyper-
tension
160 – 179 100 – 109
seek medical
attention
Setting 1:
mild hyperten-
sion
140 – 159 90 – 99
regular monitoring
by doctor
High normal 130 – 139 85 – 89
regular monitoring
by doctor
Normal 120 – 129 80 – 84 self-monitoring
Optimal < 120 < 80 self-monitoring
Source: WHO, 1999 (World Health Organization)
6. Saving and displaying measurements
•
The results of every successful measurement are stored
together with the date and time. If there are more than 60
measurements, the oldest measurements are lost.
•
Pressing the M button takes you directly to the stored meas-
urements. You can change the user memory by pressing
the button. Pressing the M button displays the average
Loading ...
Loading ...
Loading ...