Loading ...
Loading ...
Loading ...
18
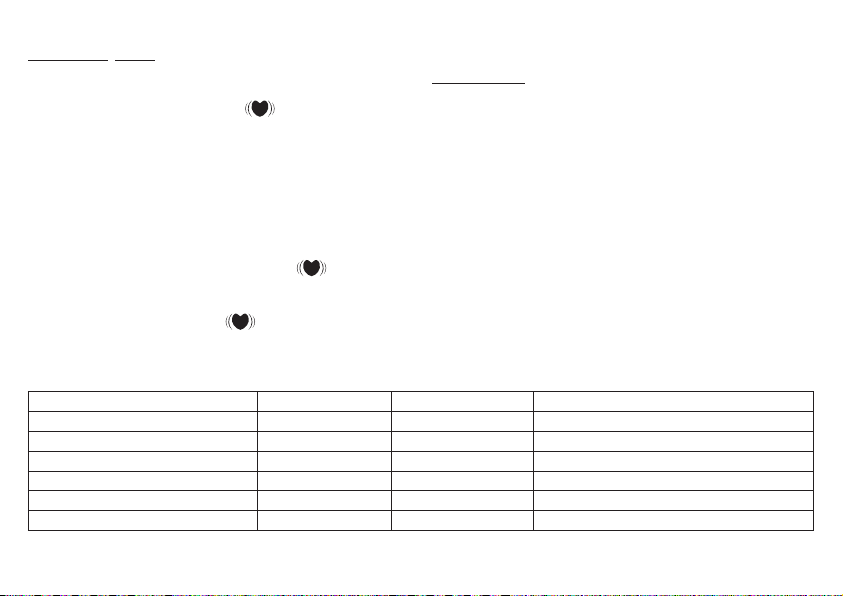
Range of blood pressure values
Systolic (in mmHg)
Diastolic (in mmHg)
Measure
Grade 3: Severe hypertension ≥= 180 ≥ 110 Seek medical advice
Grade 2: Moderate hypertension 160 – 179 100 – 109 Seek medical advice
Grade 1: Mild hypertension 140 – 159 90 – 99 Have it checked regularly by doctor
High-normal 130 – 139 85 – 89 Have it checked regularly by doctor
Normal 120 – 129 80 – 84 Check it yourself
Optimal < 120 < 80 Check it yourself
Source: WHO, 1999
Evaluating results
Cardiac arrhythmia:
This instrument can identify possible cardiac arrhythmia
disorders during measurement and if necessary indicates the
measurement with the flashing icon
.
This may be an indicator for arrhythmia. Arrhythmia is a condi-
tion where the heart rhythm is abnormal as a result of defects
in the bioelectrical system controlling the heart beat. The
symptoms (omitted or premature heart beats, slow or exces-
sively fast heart rate) may be caused, among other things, by
heart disease, age, physical predisposition, excessive use of
stimulants, stress or lack of sleep. Arrhythmia can only be as-
certained through examination by your doctor.
Repeat the measurement if the flashing icon
is displayed
after the measurement. Please note that you should rest for
5 minutes between measurements and not talk or move dur-
ing the measurement. If the icon appears often, please
contact your doctor. Any self-diagnosis and treatment based
on the test results may be dangerous. It is vital to follow your
doctor’s instructions.
Risk indicator:
The measurements can be classified and evaluated in accord-
ance with the following table.
However, these standard values serve only as a general guide-
line, as the individual blood pressure varies in different people
and different age groups etc.
It is important to consult your doctor regularly for advice. Your
doctor will tell you your individual values for normal blood pres-
sure as well as the value above which your blood pressure is
classified as dangerous.
The bar graph in the display and the scale on the unit indicate
the range of the blood pressure which has been recorded.
If the values for systolic and diastolic pressure are in two differ-
ent ranges (e.g. systolic in the high-normal range and diastolic
pressure in the normal range) the graphic classification on the
unit indicates the higher range (high-normal in the example
described).
Loading ...
Loading ...
Loading ...