Loading ...
Loading ...
Loading ...
21
First Steps
The DISP/BACK Buttion
■ Electronic View nder/LCD Monitor: Playback
Indicators displayed Indicators hidden Favorites Photo information
100-0001
100-0001
12 / 31 / 2050
12 / 31 / 2050
1 / 1000 F4 .5
10 : 00
AM
10 : 00
AM
2
-
1
3
3:2
3:2
F
F
200
100-0001
100-0001
3
12 / 31 / 2050 10 : 00
AM
:
:
:
: OFF
ISO
200
1/1000
F
4.5
2
3
-
1
12 / 31 / 2050 10 : 00
AM
100-0001
3:2
F
Q The optical view nder can not be used for playback.
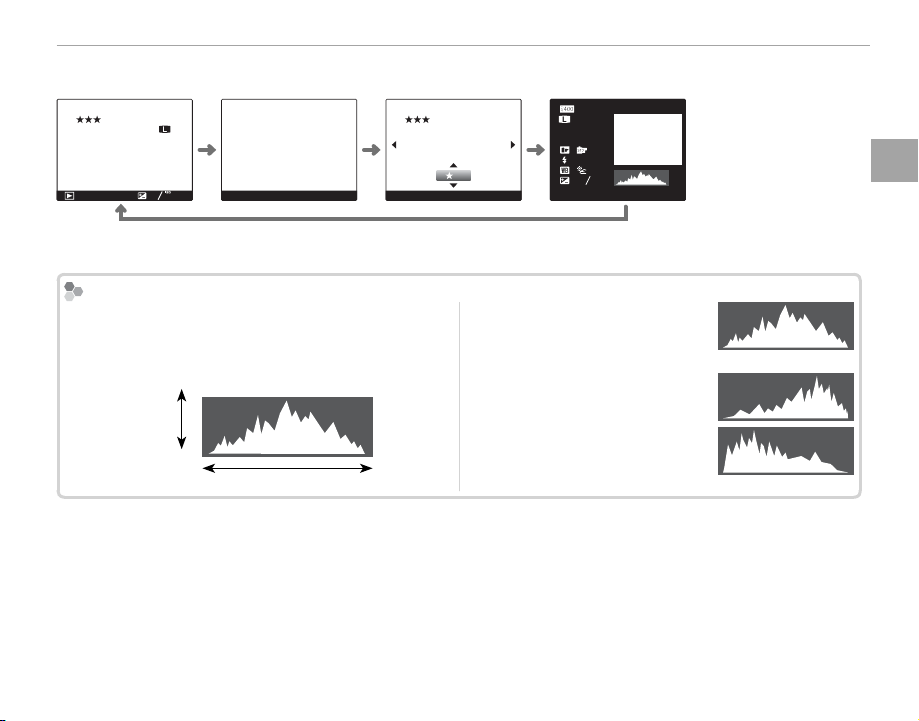
Histograms
Histograms
Histograms show the distribution of tones in the im-
age. Brightness is shown by the horizontal axis, the
number of pixels by the vertical axis.
Pixel brightness
No. of pixels
Shadows Highlights
Optimal exposure: Pixels are distrib-
uted in an even curve through-
out the tone range.
Overexposed: Pixels are clustered
on the right side of the graph.
Underexposed: Pixels are clustered
on the left side of the graph.
Loading ...
Loading ...
Loading ...