Loading ...
Loading ...
Loading ...
23
which the heart rhythm is abnormal because of flaws in
the bioelectrical system that regulates the heartbeat. The
symptoms (skipped or premature heart beats, pulse being
slow or too fast) can be caused by factors such as heart
disease, age, physical make-up, excess stimulants, stress
or lack of sleep. Arrhythmia can only be determined through
an examination by your doctor. If the symbol is shown
on the display after the measurement has been taken,
repeat the measurement. Please ensure that you rest for 5
minutes beforehand and do not speak or move during the
measurement. If the symbol
appears frequently, please
consult your doctor. Self-diagnosis and treatment based on
the measurements can be dangerous. Always follow your
GP’s instructions.
Risk indicator:
The measurements can be classified and evaluated in ac-
cordance with the following table.
However, these standard values serve only as a general
guideline, as the individual blood pressure varies in different
people and different age groups etc.
It is important to consult your doctor regularly for advice.
Your doctor will tell you your individual values for normal
blood pressure as well as the value above which your blood
pressure is classified as dangerous.
The bar chart on the display and the scale on the unit show
which category the recorded blood pressure values fall into.
If the values of systole and diastole fall into two different
categories (e.g. systole in the High normal category and
diastole in the Normal category), the graphical classification
on the device always shows the higher category; for the
example given this would be High normal.
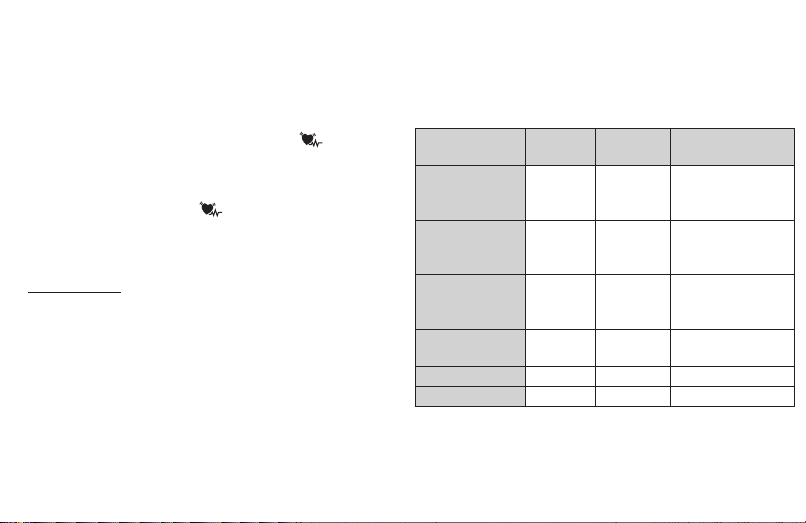
Blood pressure
value category
Systole
(in mmHg)
Diastole
(in mmHg)
Action
Setting 3:
severe hyper-
tension
≥ 180 ≥ 110
seek medical at-
tention
Setting 2:
moderate hyper-
tension
160 – 179 100 – 109
seek medical at-
tention
Setting 1:
mild hyperten-
sion
140 – 159 90 – 99
regular monitoring
by doctor
High normal 130 – 139 85 – 89
regular monitoring
by doctor
Normal 120 – 129 80 – 84 self-monitoring
Optimal < 120 < 80 self-monitoring
Source: WHO, 1999 (World Health Organization)
Loading ...
Loading ...
Loading ...