Loading ...
Loading ...
Loading ...
For help, go to lyric.honeywell.com 12
App dashboard
The app dashboard displays historical information about temperature and humidity
readings taken at the detector locations. It displays an alarm screen when a leak is
detected.
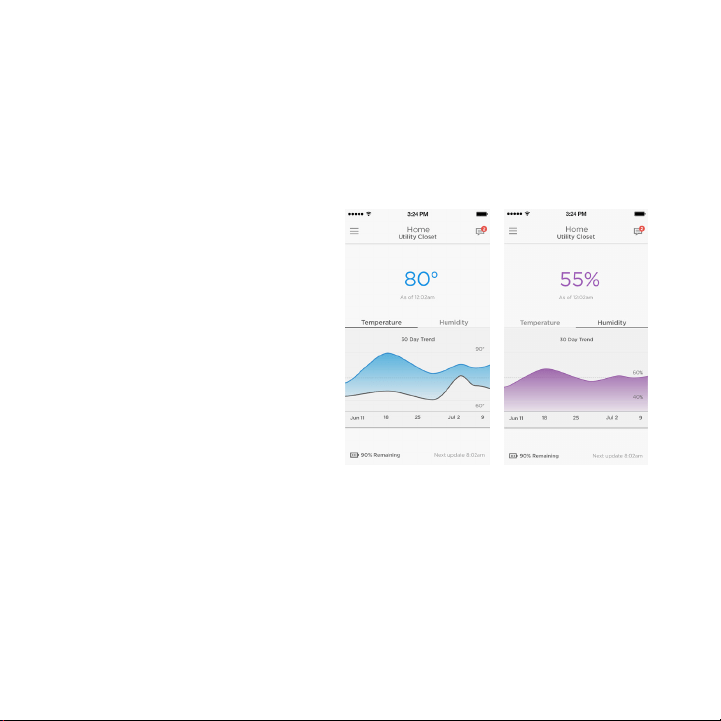
Temperature/Humidity trend
Here is an example of the dashboard
showing the 30-day trend of
temperature and humidity settings.
Press Temperature or Humidity to
change from one to the other.
The remaining battery life of the
detector is displayed in the bottom-left
corner of the screen.
The next scheduled update between the
detector and the app is displayed in the
bottom-right corner of the screen. To
change the schedule see page 10.
Loading ...
Loading ...
Loading ...