Loading ...
Loading ...
Loading ...
-13-
For all other objects (with different emissivity
levels), the displayed color differences can
be used as an indication of temperature
relationships.
Material
Emissivity
32 ºF to 212 ºF (0 ºC to 100 ºC)
Concrete 0.93
Plaster/mortar 0.93
Roofing tiles 0.93
Roofing felt 0.93
Radiator paint 0.93
Wood 0.91
Linoleum 0.88
Paper 0.89
Notes on the Measuring Conditions
Highly reflective or shiny surfaces (e.g. shiny
tiles or polished metals) may distort or impair
the results shown. If necessary, mask the
surface to be measured with a dark, matt
adhesive tape that conducts heat well. Allow
the tape to acclimatize briefly on the surface.
Make sure that a favorable measuring angle
is used on reflective surfaces in order to
ensure that the thermal radiation reflected
by other objects does not distort the result.
For example, the reflection of your own body
heat may interfere with the measurement
when measuring head-on from a perpendicular
position. On a level surface, the outline and
temperature of your body could therefore be
displayed (reflected value), and these values
do not correspond to the actual temperature
of the measured surface (emitted value or
real value of the surface). Measuring through
transparent materials (e.g. glass or transparent
plastics) is fundamentally not possible.
The accuracy and reliability of the measuring
results increase with better and more stable
measuring conditions.
Infrared temperature measurement is impaired
by smoke, vapor/ high air humidity or dusty air.
Information for achieving improved
measurement accuracy:
– Get as close as possible to the measuring
object to minimize interfering factors
between you and the surface to be
measured.
– Ventilate indoor areas prior to measurement,
especially when the air is contaminated or
extremely steamy. After ventilating, allow
the room to acclimatize for a while until the
usual temperature has been reached again.
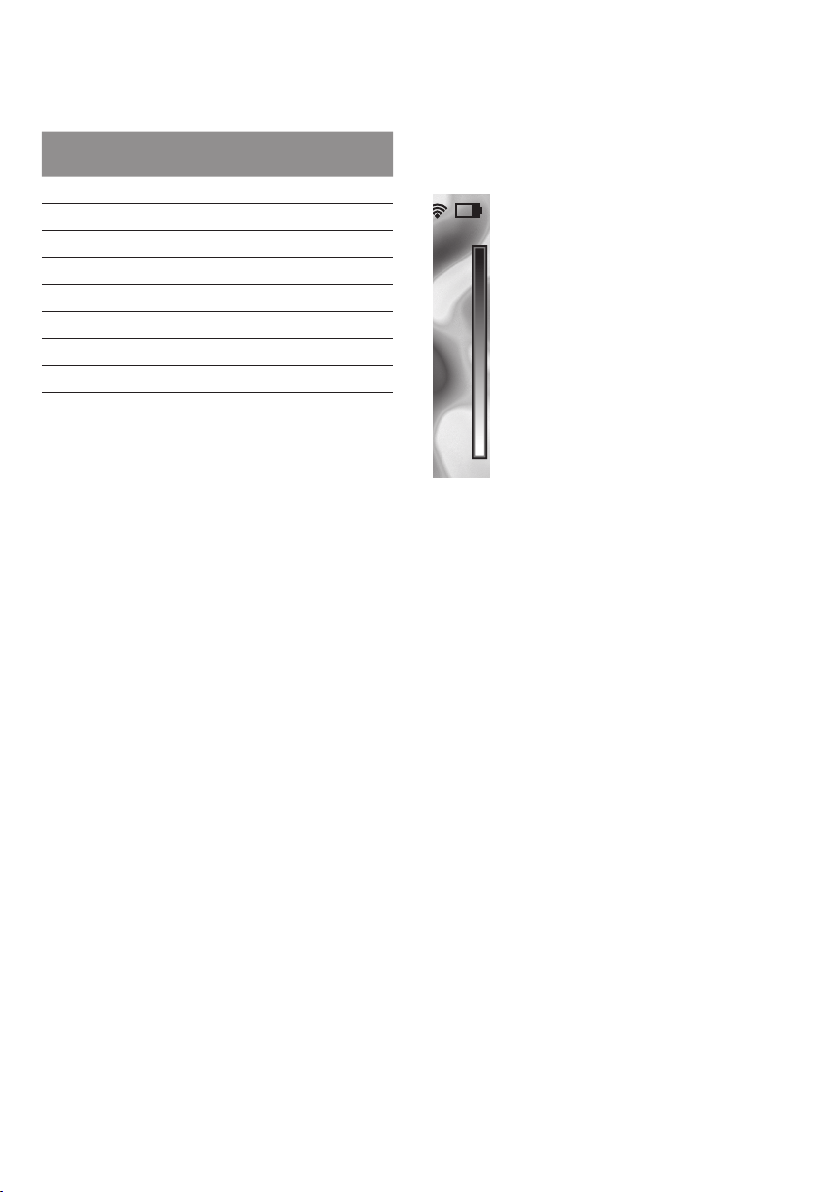
Assigning temperatures on the basis
of the scale
21,8 °C
32,5 °C
A scale is shown on the right-hand
side of the display. The values at the
top and bottom end are oriented to
the maximum and minimum
temperature recorded in the thermal
image. Colors are assigned to
temperature values with a uniform
distribution in the image (linearly).
Different shades can therefore be
used to assign temperatures within
these two limit values. For example,
a temperature that is exactly
between the maximum and minimum
value can be assigned to the center
color range of the scale.
To determine the temperature of a specific
area, move the measuring tool so that the
crosshairs with temperature display l are
aimed at the required point or area.
In the automatic setting, the color spectrum
of the scale is always distributed linearly (=
uniformly) across the entire measurement
range between the maximum and minimum
temperatures.
The thermal imaging camera displays all
measured temperatures in the measurement
range in relation to one another. If heat is
displayed as blue in the color palette in an
area, for example in a color representation,
this means that the blue areas are among
the colder measured values in the current
measurement range. However, these areas
may be in a temperature range that could
cause injuries in certain circumstances. You
should therefore always note the temperatures
displayed on the scale or at the crosshairs
themselves.
Loading ...
Loading ...
Loading ...