1
TFT COLOR DISPLAY WIFI WEATHER
STATION
Operation Manual
Model: HP3500
Thank you for purchasing this TFT Color Display Weather Station! This
device provides accurate weather readings and is Wi-Fi capable to stream
data from the weather station to Internet based weather services.
This manual will guide you, step-by-step, through setting up your weather
station and console, and understanding the operation of your weather station.
Use this manual to become familiar with your professional weather station
and save it for future reference.
2
*Please scan the QR code to read
English manual and keep it for
future reference
*
Bitte scannen Sie den QR-Code
zudeutsche Anleitung lesen und
aufbewahren füZukunftsbezug
*Si prega di scansionare il codice
QR perleggi il manuale italiano e
conservalo perReferenza futura
Instruction manuals
https://www.ecowitt.com/support/download/31
Help
Our product is continuously changing and improving, particularly online se-
rvices and associated applications. To download the latest manual and addit-
ional help, please contact our technical support team:
support@ecowitt.com
support.eu@ecowitt.net (EU/UK)

3
1 Table of Contents
1 TABLE OF CONTENTS ...................................................................................... 3
2 UNPACKING ......................................................................................................... 5
3 OVERVIEW ........................................................................................................... 7
3.1 DISPLAY CONSOLE .............................................................................................7
3.2 INDOOR SENSOR:................................................................................................8
3.3 FEATURES .......................................................................................................... 8
4 SET UP GUIDE ....................................................................................................10
4.1 SENSOR PACKAGE ASSEMBLY .........................................................................10
4.1.1 Install U-bolts and metal plate ................................................................. 11
4.1.2 Install wind vane ...................................................................................... 12
4.1.3 Install wind speed cups ............................................................................ 13
4.1.4 Install Batteries in sensor package ........................................................... 13
4.1.5 Mount assembled outdoor sensor package ...............................................14
4.1.6 Reset Button and Transmitter LED ..........................................................17
4.2 INDOOR SENSOR SET UP ................................................................................. 17
4.3 MULTI-CHANNEL TEMPERATURE AND HUMIDITY SENSOR (OPTIONAL) .......... 18
4.3.1 Install batteries ......................................................................................... 18
4.3.2 Sensor Placement ..................................................................................... 20
5 OPERATING THE CONSOLE ......................................................................... 21
5.1 NORMAL MODE ................................................................................................21
5.1.1 Outdoor or “Feels Like” ...........................................................................21
5.1.2 Rain data .................................................................................................. 22
5.1.3 Graphed data ............................................................................................ 22
5.2 SETTING MODE ................................................................................................23
5.2.1 Backlight .................................................................................................. 24
5.2.2 Data Units ................................................................................................ 24
5.2.3 Coefficients .............................................................................................. 25
5.2.4 Barometer .................................................................................................25
5.2.5 Rainfall .....................................................................................................26
5.2.6 Graph Time .............................................................................................. 26
5.2.7 Time Format .............................................................................................26
5.2.8 Date Format ..............................................................................................26
5.2.9 Date and Time ..........................................................................................26
5.2.10 Sensor Type ............................................................................................27
5.3 CALIBRATION MODE ....................................................................................... 28
5.3.1 Calibration of barometric pressure settings. ............................................ 29
5.4 ALARM MODE ................................................................................................. 32
5.5 TEMPERATURE MAX/MIN MODE .................................................................... 33
5.6 OTHER MAX/MIN MODE ................................................................................. 33

4
5.7 RAINFALL ........................................................................................................ 34
5.8 FACTORY MODE .............................................................................................. 34
5.9 DISPLAY MODE FOR OPTIONAL SENSOR(S) ..................................................... 35
5.9.1 Sensor management mode for optional sensors(s) ...................................37
5.9.2 Graph mode for optional sensors(s) ......................................................... 45
6 OTHER CONSOLE FUNCTIONS .................................................................... 46
6.1 HISTORICAL DATA STORAGE ........................................................................... 46
6.2 FIRMWARE UPDATE ......................................................................................... 47
6.3 BEAUFORT WIND FORCE SCALE ..................................................................... 47
7 PUBLISHING TO INTERNET WEATHER SERVICES ............................... 49
7.1 WI-FI CONNECTION FOR THE WEATHER STATION CONSOLE ..........................50
7.1.1 Configure Device – Connect your console with WIFI ............................ 50
7.2 ADDING WEATHER SERVICES ...........................................................................52
7.2.1 Ecowitt Weather .......................................................................................53
7.2.2 Viewing data on ecowitt.net .....................................................................55
7.3 WEATHER UNDERGROUND .............................................................................. 58
7.4 VIEWING DATA ON WUNDERGROUND.COM ..................................................... 61
7.5 DEVICE LIST .....................................................................................................65
7.6 MANAGE WUNDERGROUND ............................................................................ 65
7.7 UNIT SETTINGS ................................................................................................66
7.8 MANAGE ECOWITT .......................................................................................... 67
8 PC SOFTWARE OPERATION ......................................................................... 69
8.1 INSTALLATION AND CONFIGURATION ..............................................................69
8.1.1 Connect the display console to the PC .....................................................69
8.2 SETUP FUNCTIONS ........................................................................................... 70
8.2.1 Basic Settings ...........................................................................................70
8.2.2 Alarm Settings ..........................................................................................71
8.2.3 Calibration Settings ..................................................................................72
8.2.4 Rain Totals ............................................................................................... 73
8.3 RECORD AND RECORDING FUNCTIONS .............................................................73
8.3.1 Max/Min ...................................................................................................74
8.3.2 SDCard File ..............................................................................................75
9 MAINTENANCE ................................................................................................. 76
10 TROUBLESHOOTING GUIDE ...................................................................... 78
11 GLOSSARY OF COMMON TERMS ............................................................. 82
12 SPECIFICATIONS ............................................................................................85
13 WARRANTY INFORMATION .......................................................................87
5
2 Unpacking
Open your weather station box and inspect that the contents are intact
(nothing broken) and complete (nothing missing). Inside you should find the
following:
QT
Y
Item Description
1
Display Console
1
Outdoor Sensor Body with built-in: Thermo-hygrometer / Rain
Gauge / Wind Speed Sensor/ Wind Direction Sensor, Light and UV
sensor, Solar panel
1
Wind speed cups (to be attached to outdoor sensor body)
1
Wind vane (to be attached to outdoor sensor body)
1
USB Cable (for console to PC connectivity)
1
Indoor sensor unit
2
U-Bolts for mounting on a pole
4
Threaded nuts for U-Bolts (M5 size)
1
Metal mounting plate to be used with U-Bolts
1
Wrench for M5 bolts
1
AC adapter
1
User manual (this manual)
Table 1: Package content
If components are missing from the package, or broken, please contact
customer service to resolve the issue.
Note: The console can store historical data on a memory card. This
memory card is not included. If you want to use one you will need
a microSD memory card. There is no required size for this card. A
1GB card will store more than 10 years’ worth of data, so you do
not need a very large capacity card. There is also no requirement on
the speed class of this card as data writing happens infrequently and
is not speed critical.

6
Note: Batteries for the outdoor sensor package are not included. You will
need 2 AA size batteries, alkaline or Lithium batteries (Lithium
recommended for colder climates).
Note: The console operates using an AC adapter. The included adapter is a
switching-type adapter and can generate a small amount of electrical
interference with the RF reception in the console, when placed too
close to the console. Please keep the console display at least 2 ft. or
0.5 m away from the power adapter to ensure best RF reception
from the outdoor sensor package.
Note: Please visit www.ecowitt.com and under the product of HP3500,
you can always check for its updated manual and firmware upgrade
available. This manual is based on console firmware v1.7.0.
7
3 Overview
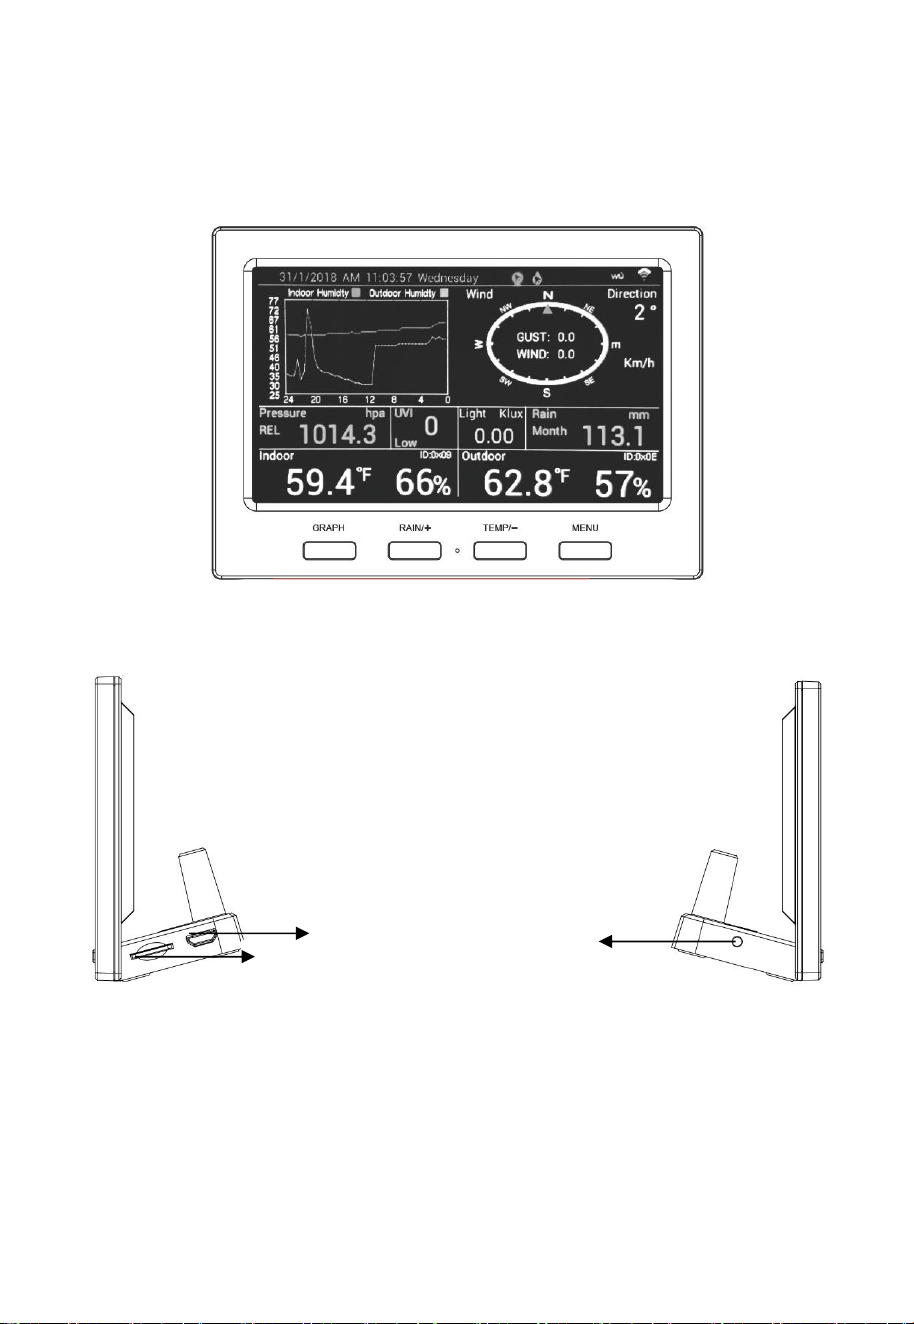
3.1 Display console
Figure 1: Display console screen
Figure 2: Display console side views
DC Connector
microSD Card
USB Port
8
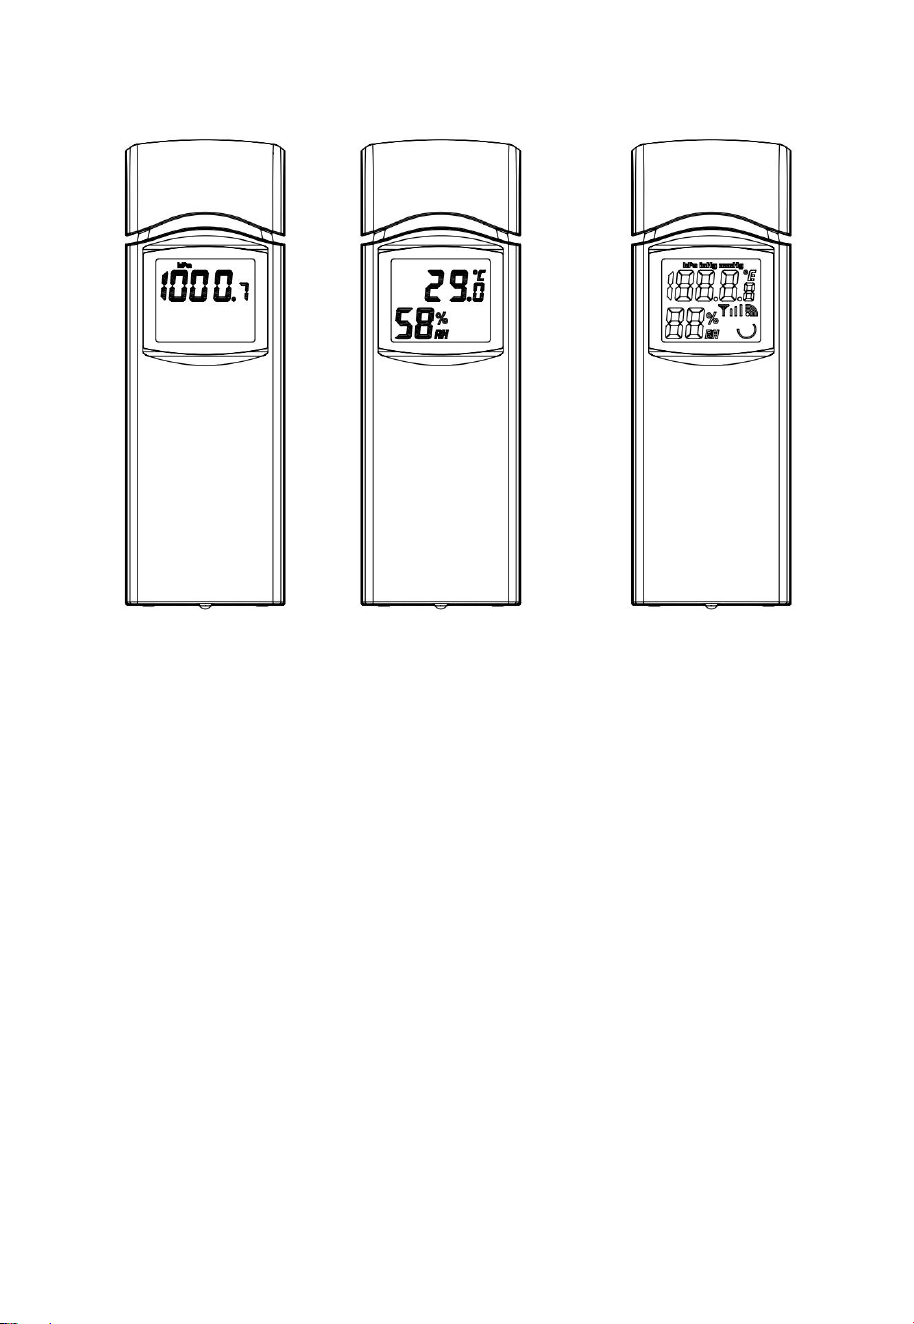
3.2 Indoor sensor:
Figure 3: Indoor sensor 3 display variations
The indoor sensor will display indoor temperature, humidity and barometric
pressure alternately. The sensor will use US or metric units, as appropriate
for the locale where the unit was sold.
3.3 Features
4.3" TFT full color display
Time and date
Indoor/Outdoor temperature and humidity
Wind speed, gust speed, and wind direction (red arrow icon for the
current wind direction and blue dot icon for the previous wind direction
on the compass)
Absolute and Relative barometric pressure
Rainfall rate and totals for day, week, month, and year
Calculated wind chill, dew point and heat index display
Solar light intensity and UV index

9
Selectable display units for each sensor: C or F (temperature); mph,
km/h, m/s, knots or Beaufort (wind speed); inHg, hPa or mmHg
(pressure); in or mm (rainfall); lux, fc or w/m
2
(solar lighting)
Barometric history graph (12, 24, 48, or 72 hr.)
Maximum and minimum values for sensor with time stamp
High/low alarm options for sensors
Historical data preserved during power outage on optional SD card
PC software (requires USB connection)
Additional/optional sensors:
One WH57 lightning sensor
Up to 8 WN31 multi-channel temperature and humidity sensors
Up to 8 WH51 soil moisture sensors
Up to 4 WH41 PM2.5 air quality sensors
Up to 4 WH55 Water leak sensors (pending)
Pushes sensor data to cloud weather services:
https://www.ecowitt.net
https://www.wunderground.com
https://www.weathercloud.com/
https://www.wow.com
Custom own server data hosting possible when server data exchange
is compatible with either Wunderground or Ecowitt protocol.
Mobile application (WS View PLUS or Ecowitt APP)
Configure the console to Wi-Fi network
View WU Dashboard (data obtained from the Weather Underground
server).
Data storage service on Ecowitt server: https://ecowitt.net
Stores data for past year days at 5-minute intervals
Stores data for past 2 years at 30-minute intervals
Note: The optional sensors can be purchased separately. If more info
needed, please visit our website: http://www.ecowitt.com. Make
sure to select the model of the units with the same RF frequency as
your gateway (the frequency is different for various countries
because of regulations).
10
4 Set up Guide
To complete assembly you will need a Philips screwdriver (size PH0) and a
wrench (size M5; included in package).
Note: We suggest you assemble all components of the weather station,
including console in one location so you can easily test functionality.
After testing, place the outdoor sensor package in the desired
location. Note, however, that movement during assembly, and
movement after assembly can cause the rain sensor to “falsely”
register rain. It is therefore best if you do not connect the console to
any Internet services until you have reset these false readings using
the console. The errant values may be hard to remove from Internet
services if you do not reset first.
Attention:
Follow suggested order for battery installation (outdoor sensor first,
console second)
Ensure batteries are installed with correct polarity (+/-)
Do not mix old and new batteries
Do not use rechargeable batteries
If outdoor temperature may go below 32F or 0C for prolonged periods,
Lithium based batteries are suggested over alkaline type batteries for the
outdoor sensor array
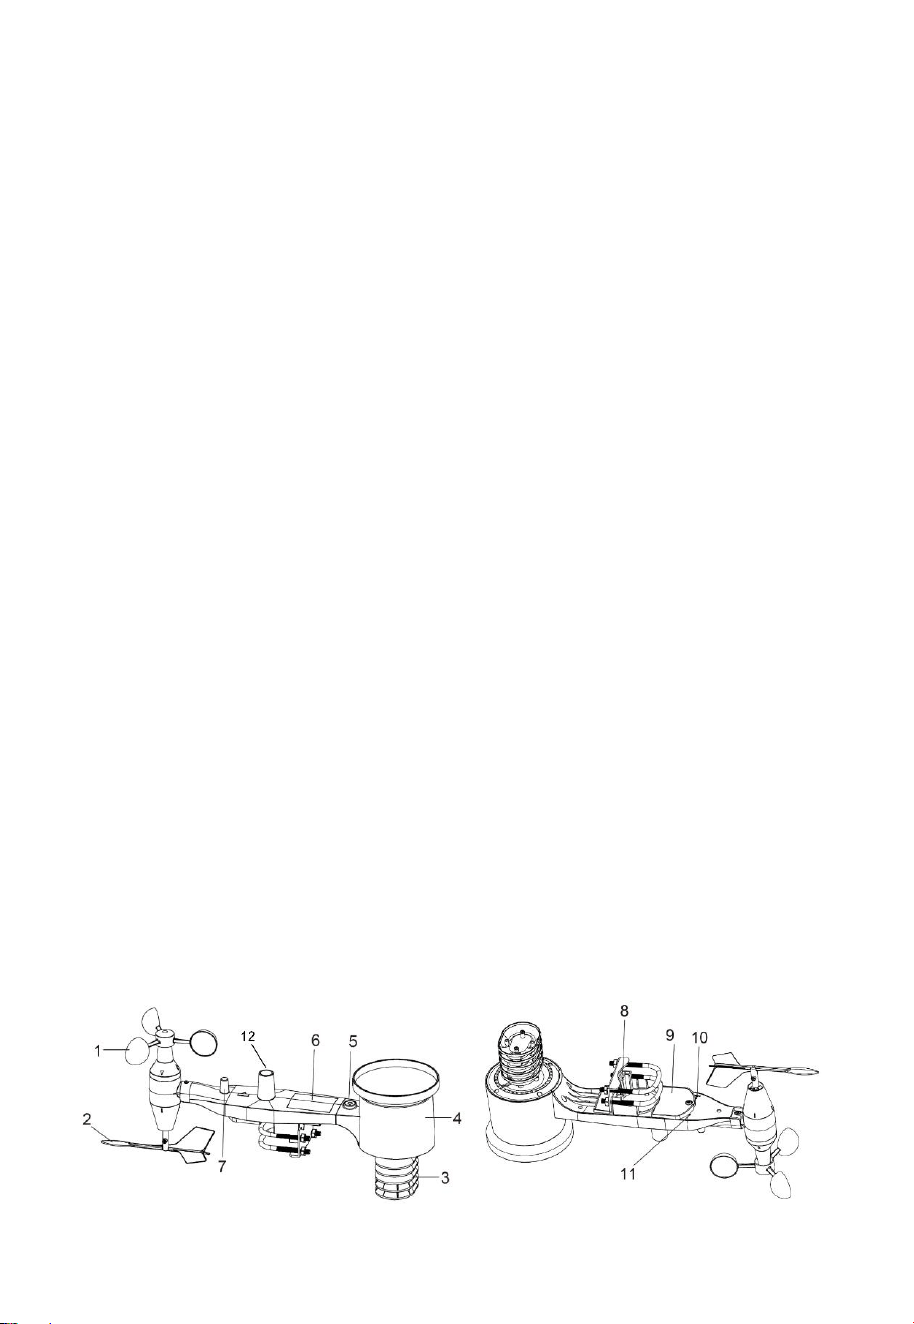
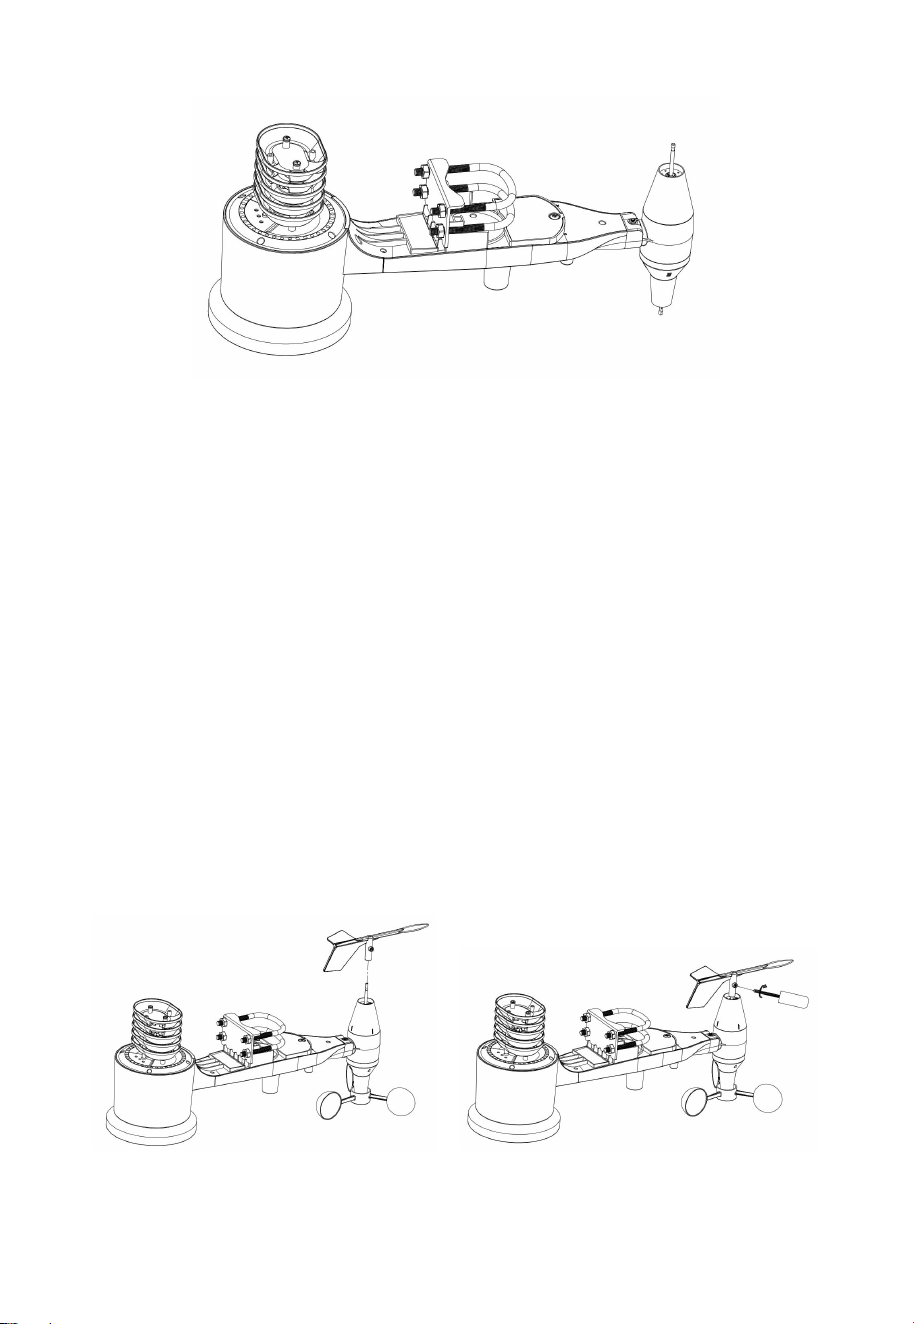
4.1 Sensor Package Assembly
See Figure 4 to locate and understand all the parts of the outdoor sensor
package once fully assembled.
Figure 4: Sensor assembly components
11
1. Wind Speed cups
7. Antenna
2. Wind Vane
8. U-Bolts
3. Thermo- and hygro-meter sensors
9. Battery compartment door
4. Rain collector
10. Reset button
5. Bubble level
11. LED (red) to indicate data
transmission
6. Solar panel
12. Light sensor and UV sensor
Table 2: Sensor assembly detailed items
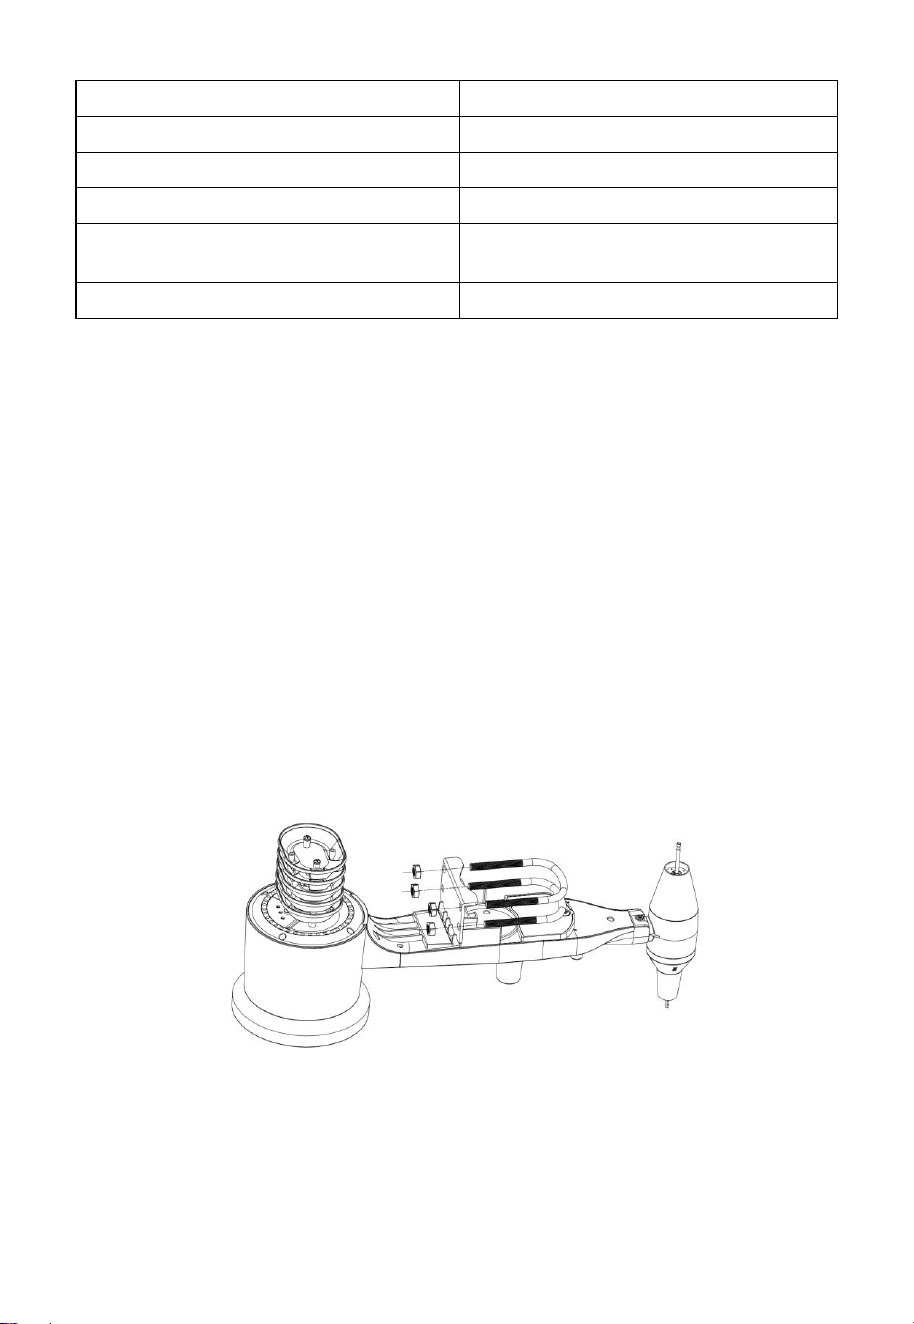
4.1.1 Install U-bolts and metal plate
Installation of the U-bolts, which are in turn used to mount the sensor
package on a pole, requires installation of an included metal plate to receive
the U-bolt ends. The metal plate, visible in Figure 5 on the right side, has
four holes through which the ends of the two U-Bolts will fit. The plate itself
is inserted in a groove on the bottom of the unit (opposite side of solar
panel). Note that one side of the plate has a straight edge (which goes into
the groove), the other side is bent at a 90-degree angle and has a curved
profile (which will end up “hugging” the mounting pole). Once the metal
plate is inserted, remove nuts from the U-Bolts and insert both U-bolts
through the respective holes of the metal plate as shown in Figure 5.
Figure 5: U-Bolt installation
Loosely screw on the nuts on the ends of the U-bolts. You will tighten these
later during final mounting. Final assembly is shown in Figure 6.
12
Figure 6: U-Bolts and nuts installed
The plate and U-Bolts are not yet needed at this stage but doing this now
may help avoid damaging wind vane and wind speed cups later on. Handling
of the sensor package with wind vane and speed cups installed to install
these bolts is more difficult and more likely to lead to damage.
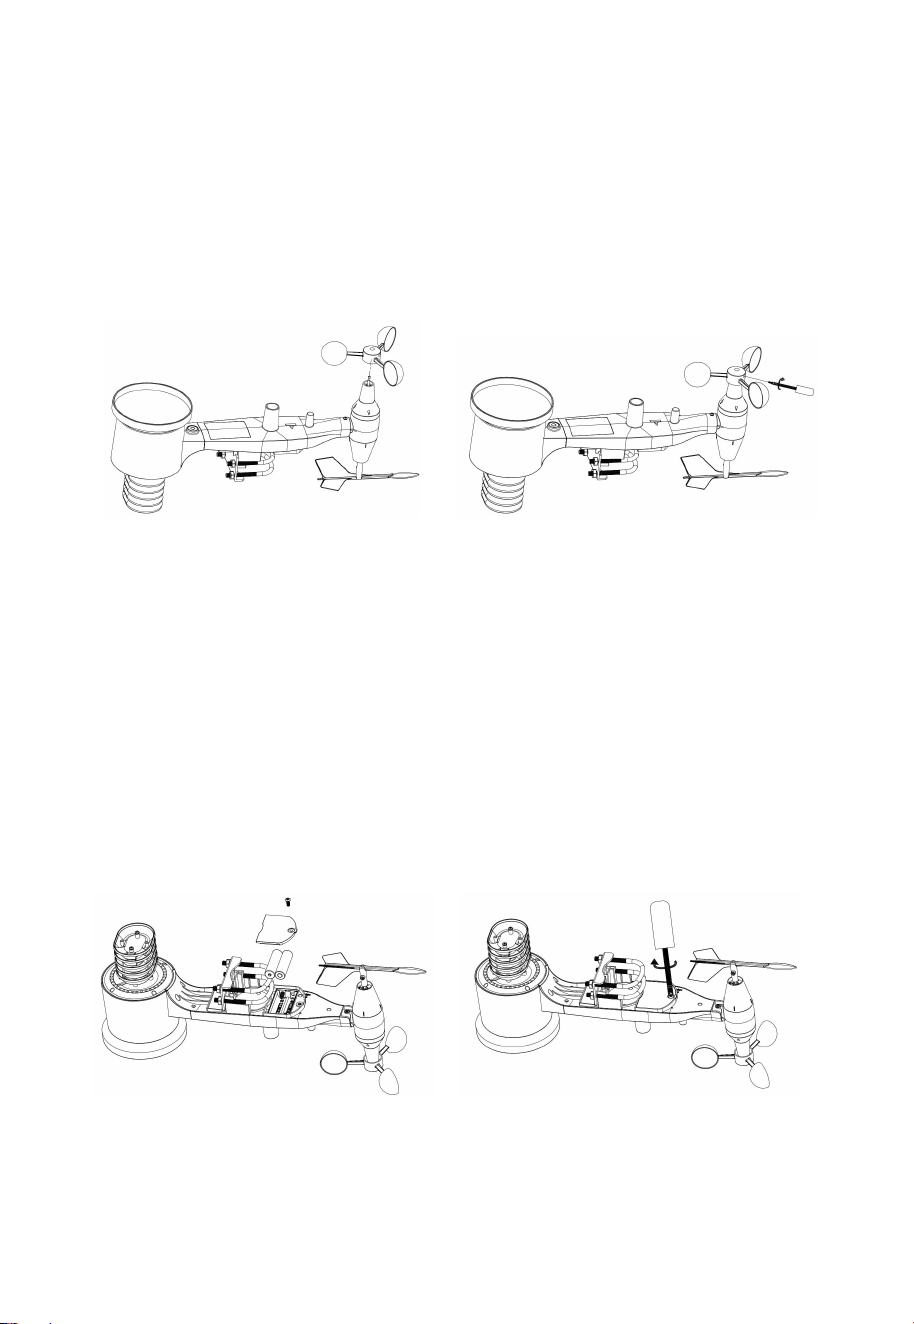
4.1.2 Install wind vane
Push the wind vane onto the shaft on the bottom side of the sensor package,
until it goes no further, as shown on the left side in Figure 7. Next, tighten
the set screw, with a Philips screwdriver (size PH0), as shown on the right
side, until the wind vane cannot be removed from the axle. Make sure the
wind vane can rotate freely. The wind vane’s movement has a small amount
of friction, which is helpful in providing steady wind direction
measurements.
Figure 7: Wind vane installation diagram
13
4.1.3 Install wind speed cups
Push the wind speed cup assembly onto the shaft on the opposite side of the
wind vane, as shown in Figure 8 on the left side. Tighten the set screw, with
a Philips screwdriver (size PH0), as shown on the right side. Make sure the
cup assembly can rotate freely. There should be no noticeable friction when
it is turning.
Figure 8: Wind speed cup installation diagram
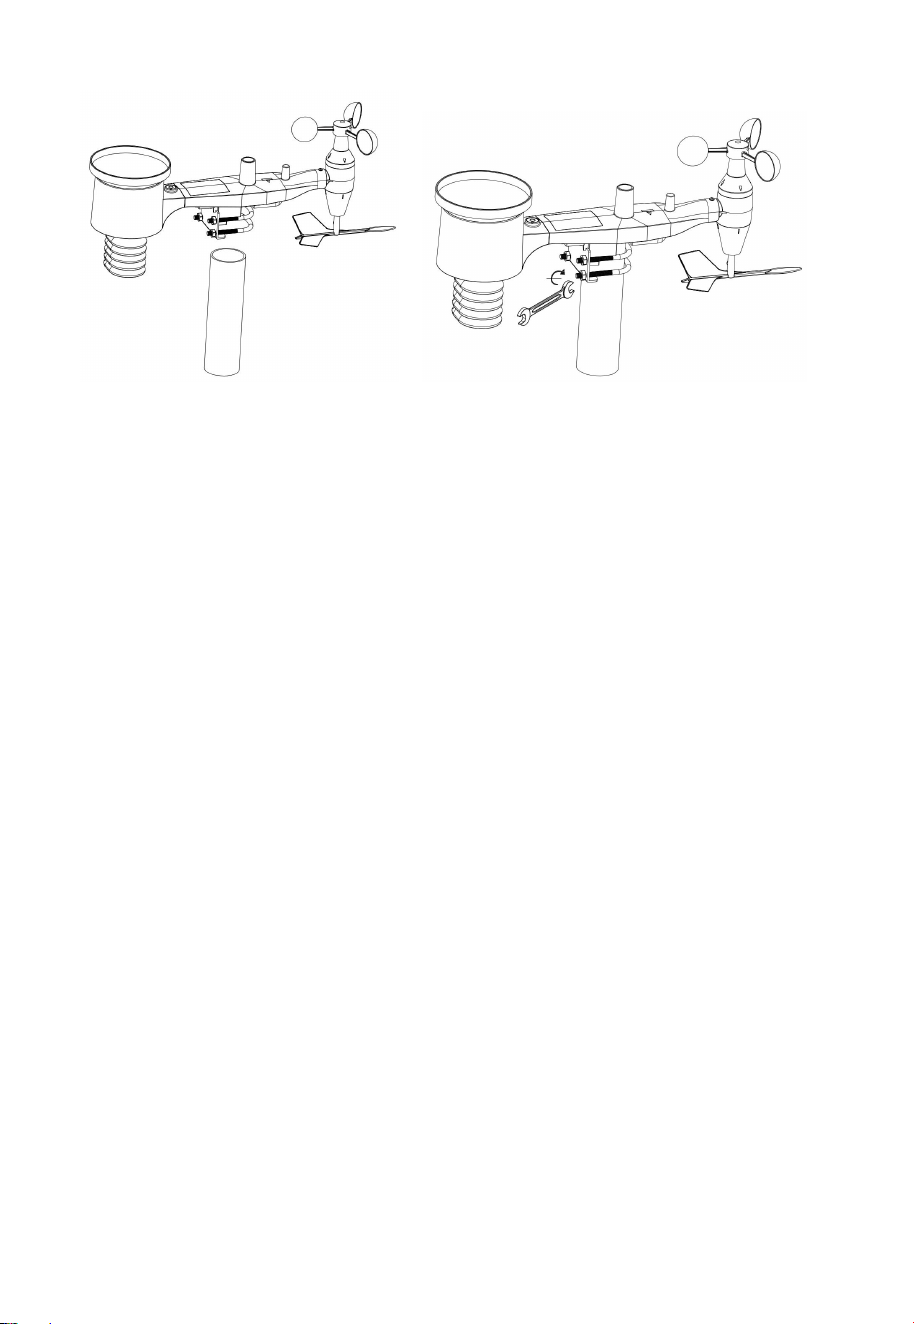
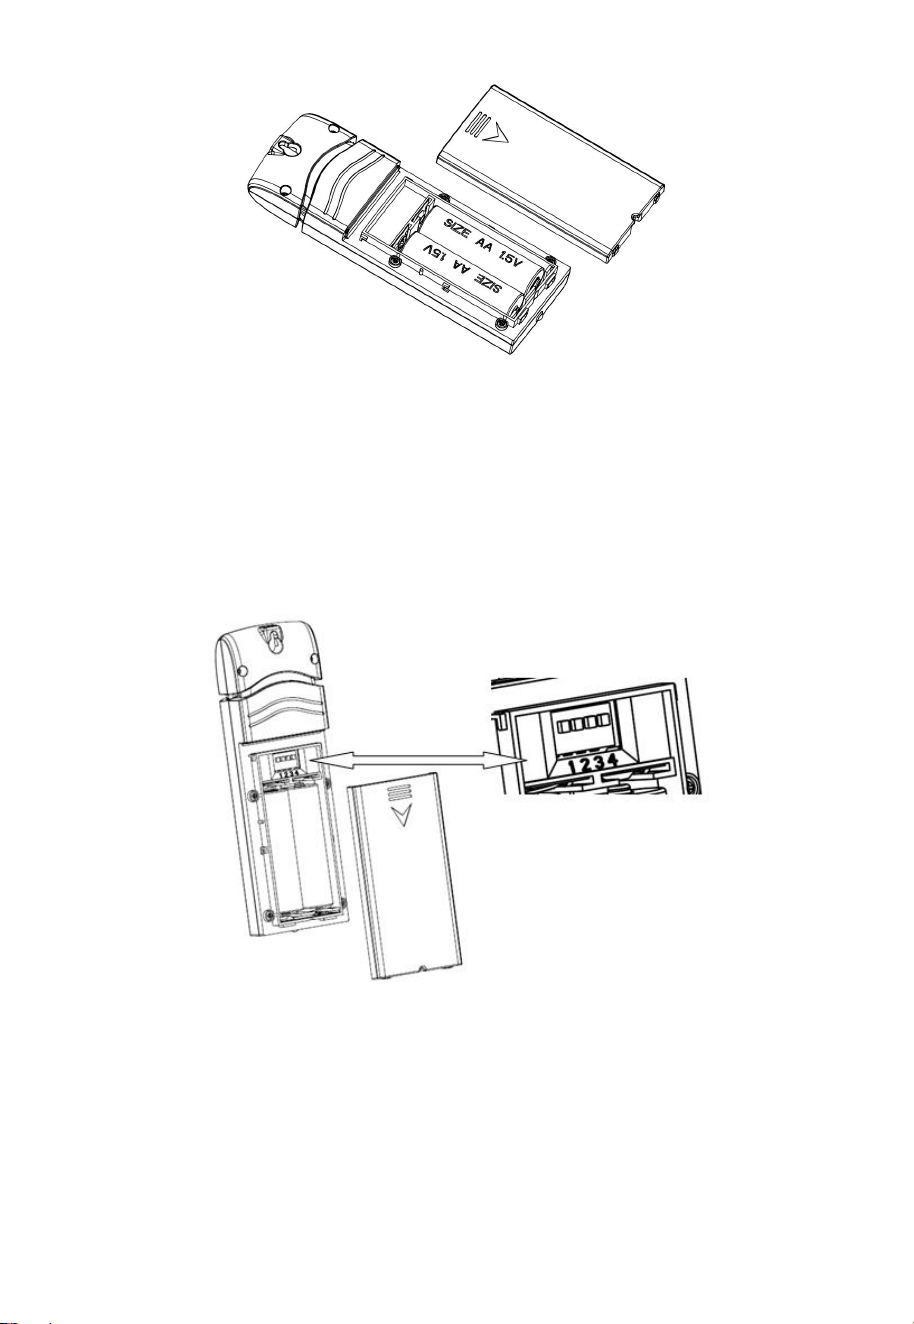
4.1.4 Install Batteries in sensor package
Open the battery compartment with a screwdriver and insert 2 AA batteries
in the battery compartment. The LED indicator on the back of the sensor
package (item 9) will turn on for four seconds and then flash once every 16
seconds indicating sensor data transmission. If you did not pay attention,
you may have missed the initial indication. You can always remove the
batteries and start over, but if you see the flash once every 16 seconds,
everything should be OK.
Figure 9: Battery installation diagram

14
Note: If LED does not light up or is on permanently, make sure the battery
is inserted the correct way and inserted fully, starting over if
necessary. Do not install the batteries backwards as it may
permanently damage the outdoor sensor.
Note: We recommend Lithium batteries for cold weather climates, but
alkaline batteries are sufficient for most climates. Rechargeable
batteries have lower voltages and should never be used.
4.1.5 Mount assembled outdoor sensor package
4.1.5.1 Before you mount
Before proceeding with the outdoor mounting detailed in this section, you
may want to skip to setup instructions in section 4.2 and onwards first, while
you keep the assembled outdoor sensor package nearby (although preferably
not closer than 5 ft. from the console). This will make any troubleshooting
and adjustments easier and avoids any distance or interference related issues
from the setup.
After setup is complete and everything is working, return here for outdoor
mounting. If issues show up after outdoor mounting they are almost
certainly related to distance, obstacles etc.
4.1.5.2 Mounting
Your package includes two U-Bolts, 4 nuts, and a metal mounting plate for
the U-Bolts. You can attach a pipe (not included) to a permanent structure
and then attach the sensor package to it (see Figure 10). The U-Bolts will
accommodate a pipe diameter of 1-2 inches.
15
Figure 10: Sensor package mounting diagram
The mounting plate will slide into a slot on the bottom of the sensor package
and then you can provisionally insert the U-Bolts from the other side
through the holes provided holes. Next place a nut on each of the four ends
of the U-Bolts and tighten by hand several turns so they will not fall off.
Next prepare the mounting pipe in the desired location and make sure it is
vertical, or very close to it. Use a level if needed.
Finally, place the sensor package on top of the prepared mounting pipe. The
U-Bolts should be loose enough to allow this but loosen the nuts as
necessary. Once placed, hand tightens all four nuts, taking care to do so
evenly. Do not use a wrench yet!
Now you will need to align the whole package in the proper direction by
rotating it on top of the mounting pipe as needed. Locate the arrow labeled
“WEST” that you will find on top of the sensor package right next to the
light sensor, on the opposite side of the solar panel. You must rotate the
whole sensor package until this arrow points due west. To achieve proper
alignment, it is helpful to use a compass (many cell phones have a compass
application). Once rotated in the correct orientation, lightly tighten the bolts
a little more (use a wrench) to prevent further rotation.
Note: The orientation to WEST is necessary for two reasons. The most
important one is to position the solar panel and light sensor in the

16
most advantageous position for recording solar radiation and
charging internal capacitors. Secondly it causes a zero reading for
wind direction to correspond to due NORTH, as is customary. This
orientation is correct for installations in the northern hemisphere. If
you are installing in the southern hemisphere, the correct orientation
to achieve the same optimal positioning is to have the “WEST”
arrow actually point due EAST! This has the side effect, however,
of lining up the 0 reading of the wind direction with SOUTH. This
needs to be corrected using a 180-degree offset in the calibration
settings (see section 5.3 on page 27).
Now look at the bubble level. The bubble should be fully inside the red
circle. If it is not, wind direction, speed, and rain readings may not operate
correctly or accurately. Adjust the mounting pipe as necessary. If the bubble
is close, but not quite inside the circle, and you cannot adjust the mounting
pipe, you may have to experiment with small wooden or heavy cardboard
shims between the sensor package and the top of the mounting pole to
achieve the desired result (this will require loosening the bolts and some
experimentation).
Make sure you check, and correct if necessary, the westerly orientation as
the final installation step, and now tighten the bolts with a wrench. Do not
over tighten, but make sure strong wind and/or rain cannot move the sensor
package.
Note: If you tested the full assembly indoors and then came back here for
instructions and mounted to sensor package outdoor you may want
to make some further adjustments on the console. The transportation
from indoor to outdoor and handling of the sensor is likely to have
“tripped” the rainfall sensing bucket one or more times and
consequently the console may have registered rainfall that did not
really exist. You can use console functions to clear this from history.
Doing so is also important to avoid false registration of these
readings with weather services.
17
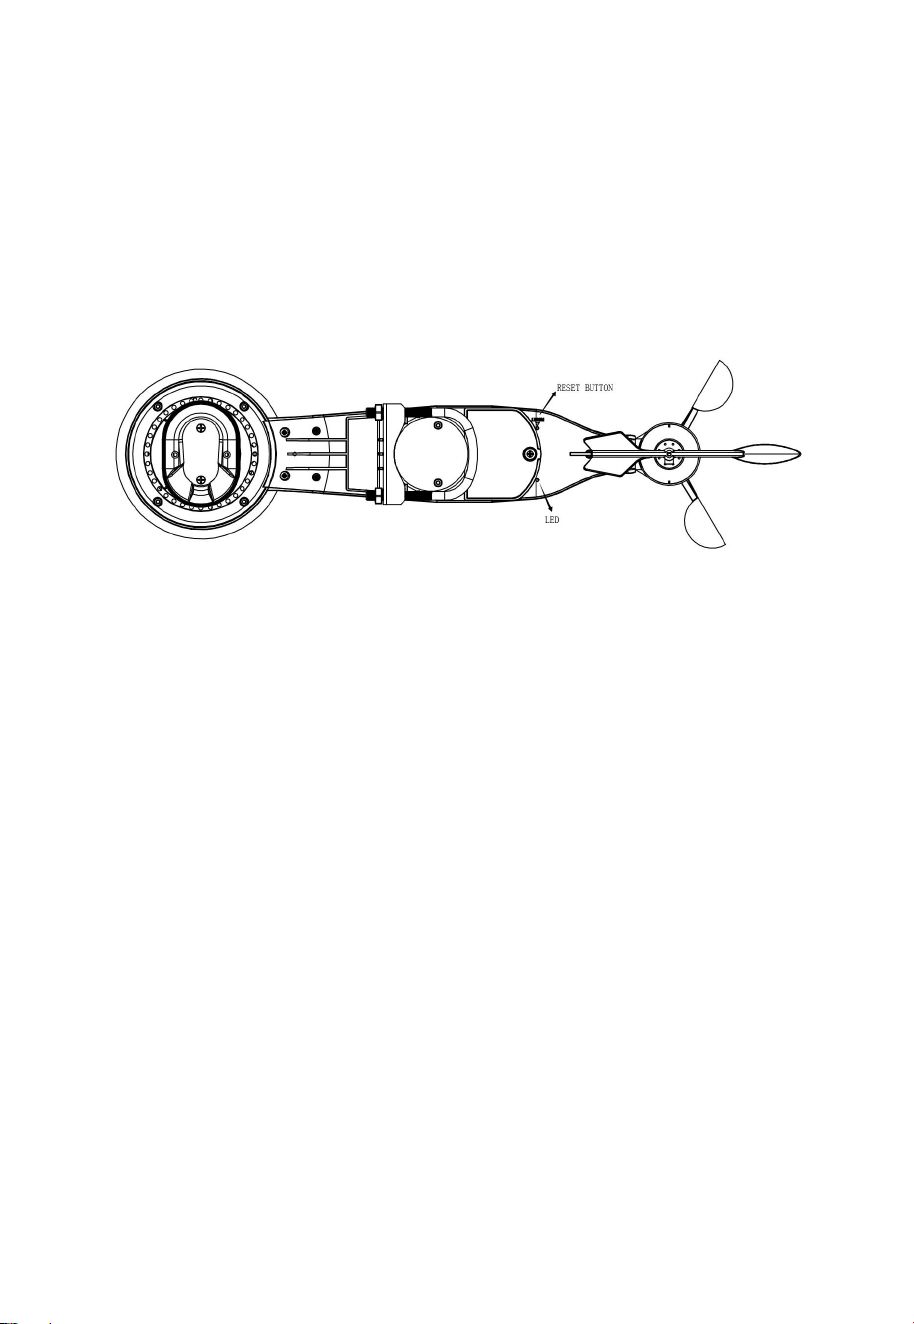
4.1.6 Reset Button and Transmitter LED
In the event the sensor array is not transmitting, reset the sensor array.
Using a bent-open paperclip, press and hold the RESET BUTTON (see
Figure 11) to affect a reset: the LED turns on while the RESET button is
depressed, and you can now let go. The LED should then resume as normal,
flashing approximately once every 16 seconds.
Figure 11: Reset button and Transmitter LED location
4.2 Indoor Sensor Set Up
Note: To avoid permanent damage, please take note of the battery polarity
before inserting the batteries. Looking at Figure 13 from left to right
the left-most (or bottom) battery is to be installed with its + terminal
pointing down, and the other battery with its + terminal pointing up.
Remove the battery door on the back of the sensor by sliding it in the
direction of the arrow. Insert two AA batteries as described and put
compartment door back and slide it in the opposite direction to lock.
18
Figure 12: Indoor sensor battery installation
4.3 Multi-channel temperature and humidity sensor (Optional)
4.3.1 Install batteries
1. Remove the battery door on the back of the transmitter(s) by sliding
down the battery door, as shown in Figure 13.
Figure 13: Battery installation for Multi-channel sensor
2. BEFORE inserting the batteries, locate the dip switches on the
inside cover of the lid of the transmitter.
3. Channel Number: The device supports up to eight sensors. To set
each channel number, change Dip Switches 1, 2 and 3, as referenced
in Figure 14 .
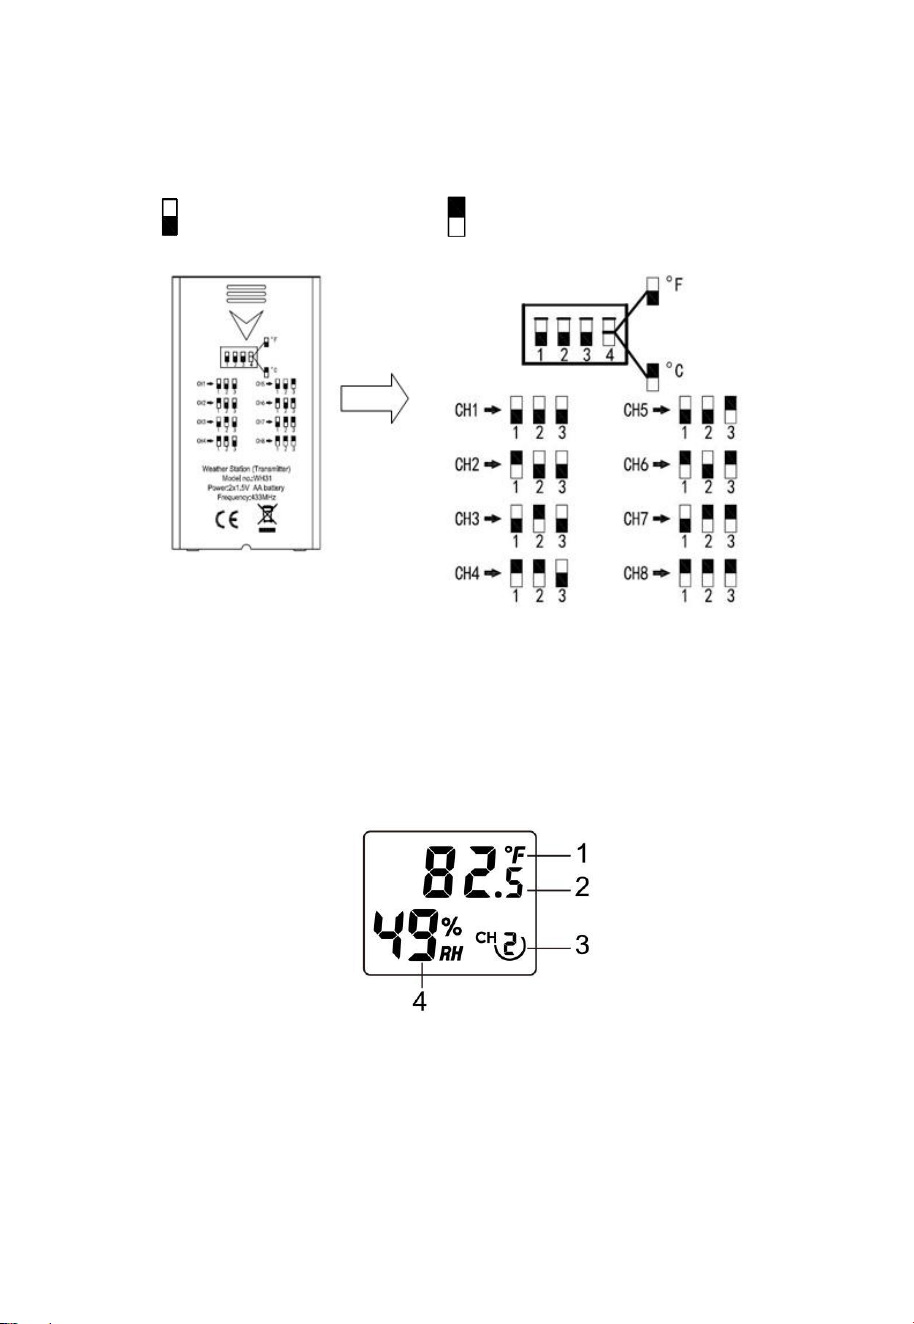
19
4. Temperature Units of Measure: To change the transmitter display
units of measure (°F vs. °C), change Dip Switch 4, as referenced in
Figure 14 .
5. Switch in down position. Switch in up position.
Figure 14: Dip Switch diagram
6. Insert two AA batteries.
7. Verify the correct channel number (CH) and temperature units of
measure (°F vs. °C) are on the display, as shown in Figure 15 .
Figure 15: sensor LCD display
(1) temperature
(2) temperature units (°F vs. °C)
(3) channel number
(4) relative humidity
20
8. Close the battery door.
Repeat for the additional remote transmitters, verifying each remote is on a
different channel.
4.3.2 Sensor Placement
The best mounting location for the indoor sensor is in a location that never
receives direct sunlight, not even through windows. Also, do not install in a
location where a nearby radiant heat source (radiator, heaters, etc.) will
affect it. Direct sunlight and radiant heat sources will result in inaccurate
temperature readings.
The sensor is meant to provide indoor conditions for display on the console,
but if you would rather have a second source for outdoor conditions instead,
you can mount this unit outside. The unit is weatherproof, but besides
heeding the placement instructions above, you should also attempt to mount
the unit under cover (eve or awning or similar).
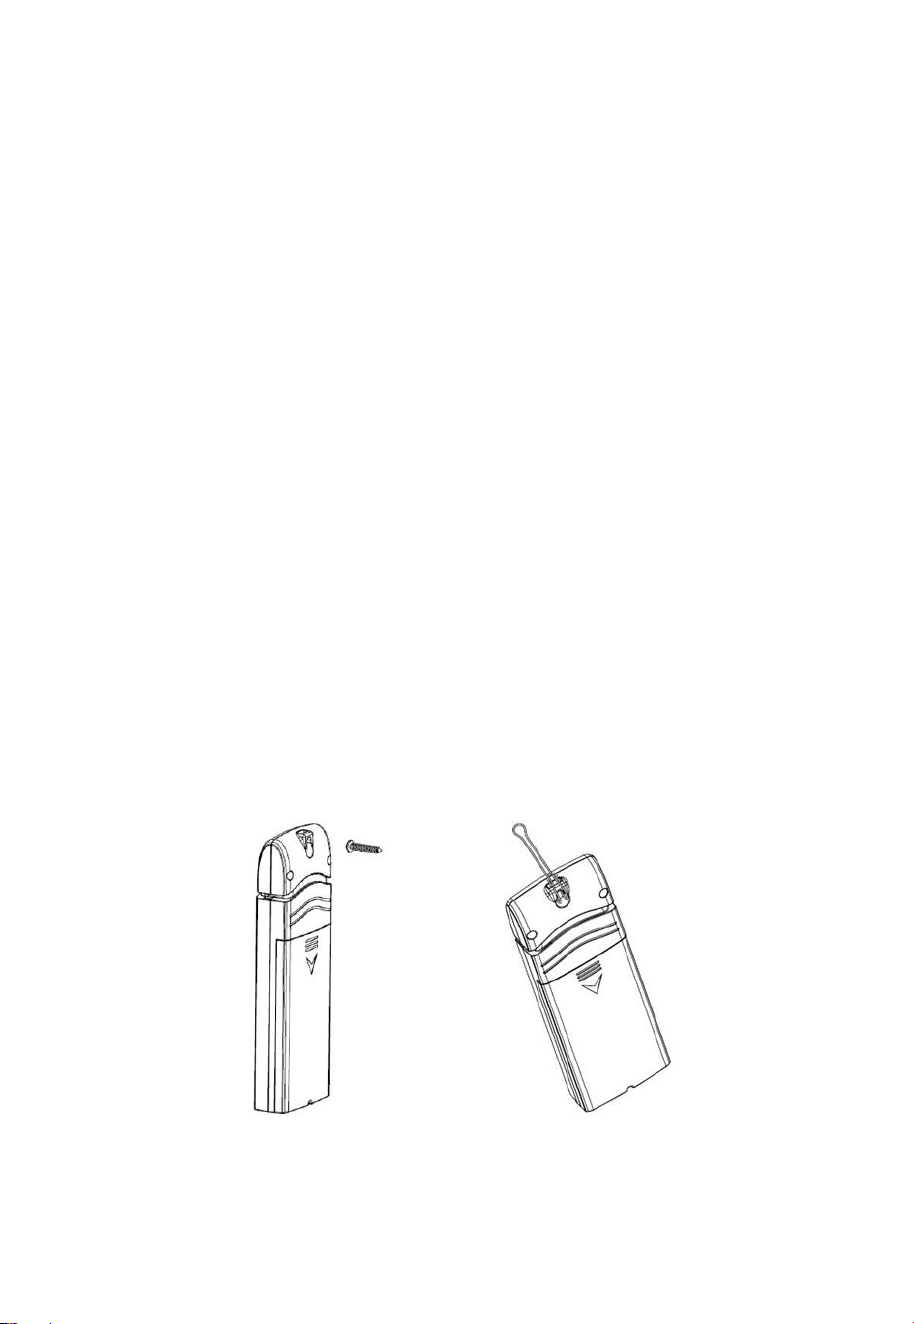
To mount or hang the unit on a wall or wood beam:
Use a screw or nail to affix the remote sensor to the wall, as shown on
the left side of Figure 16, or
Hang the remote sensor using a string, as shown in right side of Figure
16
Figure 16: Indoor sensor mounting

21
Note: Make sure the sensor is mounted vertically and not lying down on a
flat surface. This will insure optimum reception. Wireless signals
are impacted by distance, interference (other weather stations,
wireless phones, wireless routers, TVs and computer monitors), and
transmission barriers, such as walls. In general, wireless signals will
not penetrate solid metal and earth (down a hill, for example).
5 Operating the console
The display console has seven modes. Normal, or display, mode shows you
various weather quantities and will be your “normal” use mode. Use the
MENU key to enter the various setup modes. Press the MENU key
repeatedly to reach the various setup pages and, eventually, return back to
normal mode. You may hold down the MENU key at any time to force a
return to normal mode, or if you do not press any key for 30 seconds, the
console will also return to normal mode.
The following sections will discuss each of the modes and the items and
options available in each. When not in “normal” mode the console buttons
are used for various functions. The current function of each button is
depicted graphically with a symbol directly above the hardware button.
Typical functions are “NEXT” indicated with a right arrow, “PREVIOUS”
indicated with a left arrow, and “+” and “-”.
5.1 Normal mode
Normal mode is the most often used mode. It is used to display most current
sensor information for quick inspection. Information is displayed in several
rectangular shaped areas. Some of these areas can be configured to display
different content.
5.1.1 Outdoor or “Feels Like”
In the normal mode press the TEMP/- button to alternate the display
between:

22
Outdoor temperature and outdoor humidity, or
“Feels Like” temperature (depending on the weather this will either
indicate wind-chill temperature, or heat-index), and dew point
temperature.
Wind chill and heat index are perceptual values (that’s why they are
described as “Feels Like”) that indicate the air temperature as experienced
by humans, as opposed to the measured ambient air temperature. The
passing flow of lower temperature air makes it feel “colder” and this is
reflected in the wind chill temperature. Conversely, if it feels warmer than
the measured air temperature due to the effects of humidity, we use a
heat-index temperature to indicate how warm it feels.
The “dew point” is not a perceptual value, but it is calculated from the
sensor values (temperature and humidity). The dew point is the temperature
to which air has to be cooled to become saturated, and beyond which
airborne water vapor would become liquid (dew).
5.1.2 Rain data
The normal mode has a segment for displaying rainfall related data. Press
the RAIN/+ button to alternate the display between:
Rain rate: amount of rainfall accumulated in the past 60 minutes
Rain day: amount of rainfall accumulated since midnight
Rain week: amount of rainfall accumulated since the start of the week.
The week starts when Sunday begins and ends exactly 7 days later
Rain month: amount of rainfall accumulated since the start of the current
month
Rain year: amount of rainfall accumulated since the start of the year
5.1.3 Graphed data
The normal mode has an area that displays a graph of historical data. The
graph will span a period of 12, 24, 48 or 72 hr. This is controlled from a
setup menu (see section 5.2.6). Press the GRAPH button to alternate the
displayed graph between:
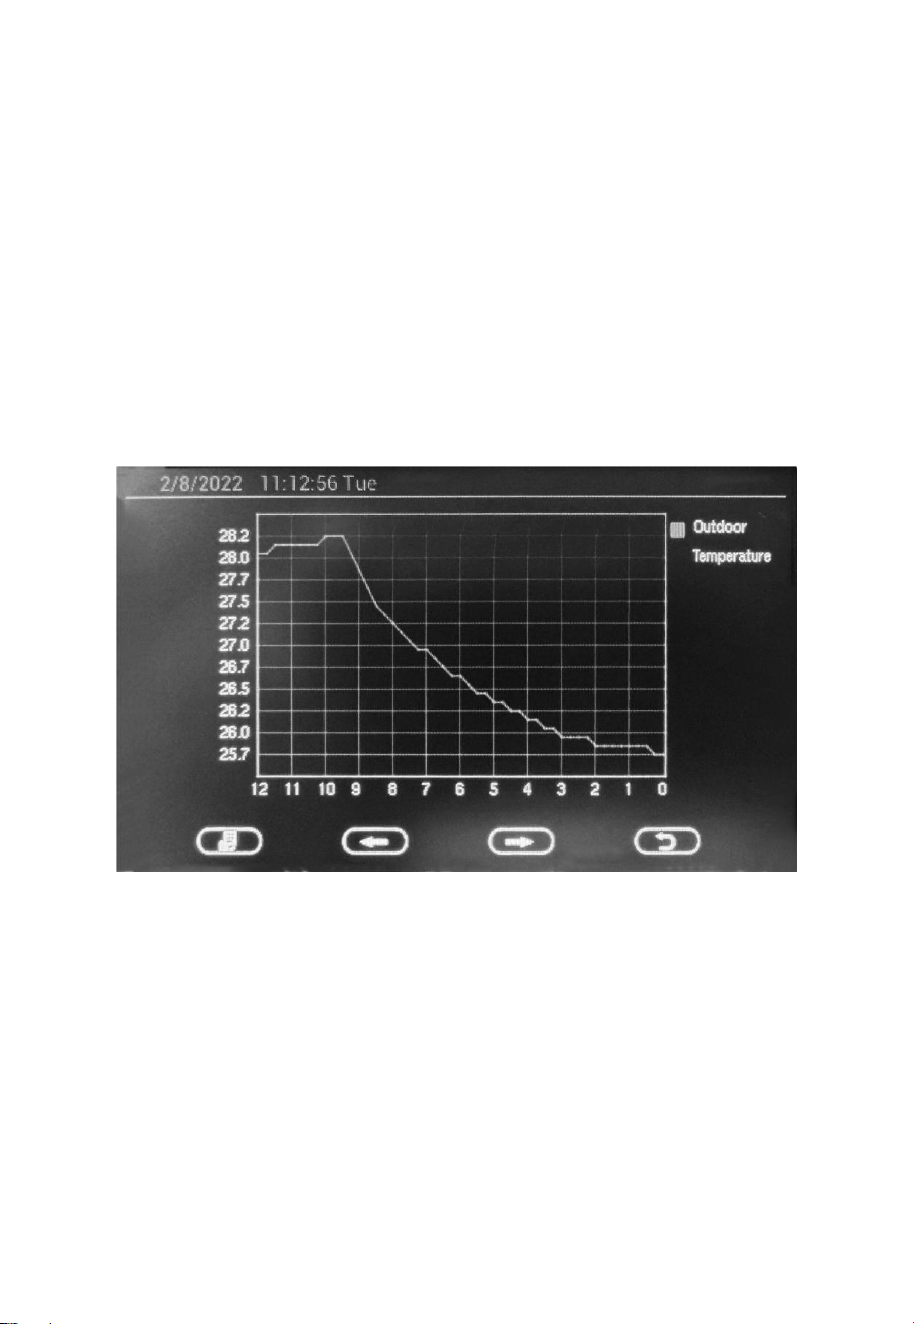
23
Indoor and outdoor temperature
“Feels Like” temperature and dew point temperature
Indoor and outdoor humidity
Absolute (ABS) and Relative (REL) barometric pressure
Wind speed and gust speed
UV-index
Solar Radiation (Light)
Rain rate
Note: In normal display, hold the Graph button for 5 seconds can full
display the graph:
5.2 Setting Mode
Settings mode can be activated from “normal mode” by pressing the MENU
once. Doing so will show a screen titled “Setup” that offers 10 individual
buttons for changing configuration of specific settings.
Use the GRAPH or TEMP button to move to the next, or previous, setting
(indicated by a right arrow above the button). The selected setting will be
highlighted in yellow. Press the RAIN button to change the settings for the
selected item. For some items you will now be able to change its value, for

24
others (when labeled “Setup” you will enter a sub-menu that again allows
you to select a specific item first. Use the RAIN/+ and TEMP/- buttons to
change the value selected in small changes or hold these buttons for two
seconds or more to make rapidly repeating large changes. In the following
buttons will sometimes be referred to as just “next”, “previous”, “+” or “-”
if that is their function.
Press MENU again to return to the previous menu or normal mode.
5.2.1 Backlight
In backlight setting mode you use the GRAPH/next button to move between
the items you can change:
Enable or disable time-based backlight control. When disabled the
backlight stays on permanently, otherwise the backlight will be switched
on and off at designated times. Backlight off means the display is off!
Turn on backlight: Use next button to move between controlling hours
or minutes and use “+” and “-” buttons to changes the values.
Turn off backlight: Use next button to move between controlling hours
or minutes and use “+” and “-” buttons to changes the values.
Current brightness: Use “+” and “-” buttons to change brightness level,
indicated by the size of the yellow bar.
Use a single press of MENU to go back to the Setup menu, or a long press
to go back to normal mode.
5.2.2 Data Units
In the data unit sub-menu, you can change settings for the following:
Temperature: Select between F and C by repeatedly pressing the “+”
button
Barometer units: Select between hPa, inHg, and mmHg by repeatedly
pressing the “+” button
Wind speed: Select between mph, knots, m/s, km/h and bft by
repeatedly pressing the “+” button

25
Solar radiation: Select between w/m2, klux and fc by repeatedly
pressing the “+” button
Rainfall: Select between in and mm by repeatedly pressing the “+”
button
Use a single press of MENU to go back to the Setup menu, or a long press
to go back to normal mode.
5.2.3 Coefficients
In the coefficients sub-menu, you can change settings for the gain value of
some sensor values, Gain means that the sensor value is multiplied by a
“gain” or “factor”, When “gain” is larger than 1 value are increased
proportionally, when it is less than 1 they are decreased proportionally.
Generally, you should not have to change these gain values, but if you know
for sure that your sensor readings are systematically incorrect by a
proportional amount (not an offset), you can edit the following:
Rain: Register rain in greater amounts (> 1) or lesser amounts (< 1).
Wind: Register wind at greater speeds (> 1) or lesser speeds (< 1).
Solar radiation: Register light in greater amounts (> 1) or lesser amounts
(< 1).
UV: Register UV radiation in greater amounts (> 1) or lesser amounts (<
1). This gain is initially set to 1 and cannot be changed.
Lux conversion factor: This is not a gain for a sensor, but rather a
conversion factor, Conversion from w/m
2
to lux and vice versa needs to
take into account the wavelength of the light. The standard conversion
factor is 126.7 lux per w/m
2
, This value cannot be changed.
Use a single press of MENU to go back to the Setup menu, or a long press
to go back to normal mode.
5.2.4 Barometer
The “Barometer” setting can be used to control whether in normal mode the
barometer displays absolute pressure (ABS), which is pressure as measured
at the sensor, or relative pressure (REL) which represents the measured

26
pressure corrected to sea level elevation. Use the “+” button to switch
between the two.
5.2.5 Rainfall
The “Rainfall” setting can be used to control which rainfall value is
displayed. Use the “+” button repeatedly to select from “Rate” ,“Daily”,
“Weekly”, “Monthly” or “Yearly”.
5.2.6 Graph Time
The “Graph Time” setting controls how far back the historical data graph
looks to present data. Press the “+” button repeatedly to select from “12”,
“24”, “48” or “72” hours.
5.2.7 Time Format
The “Time Format” setting controls how time is displayed. Press the “+”
button repeatedly to select between “AM h:mm:ss”, “h:mm:ss AM”, and
“h:mm:ss”. The first two will use a 12-hr clock system and display AM or
PM as appropriate either before the time, or after the time. The last format
uses a 24-hr clock system.
5.2.8 Date Format
The “Date Format” setting controls how dates are displayed. Press the “+”
button repeatedly to select between “DD-MM-YYYY”, “YYYY-MM-DD”,
and “MM-DD-YYYY”.
5.2.9 Date and Time
The “Date and Time” setting can be used to manually set the time, and it can
be used to set the console’s time zone and whether or not daylight savings
time should be handled automatically. If you are using the units with Wi-Fi
connected, the time setting itself will be handled for you automatically, but
you will have to set the correct time zone and daylight savings time
handling.
27
Use the “next” and “previous” buttons to move to the desired input box and
then use the “+” and “-” keys to change the value.
The automatic daylight savings time adjustments are enabled when the box
is solid red.
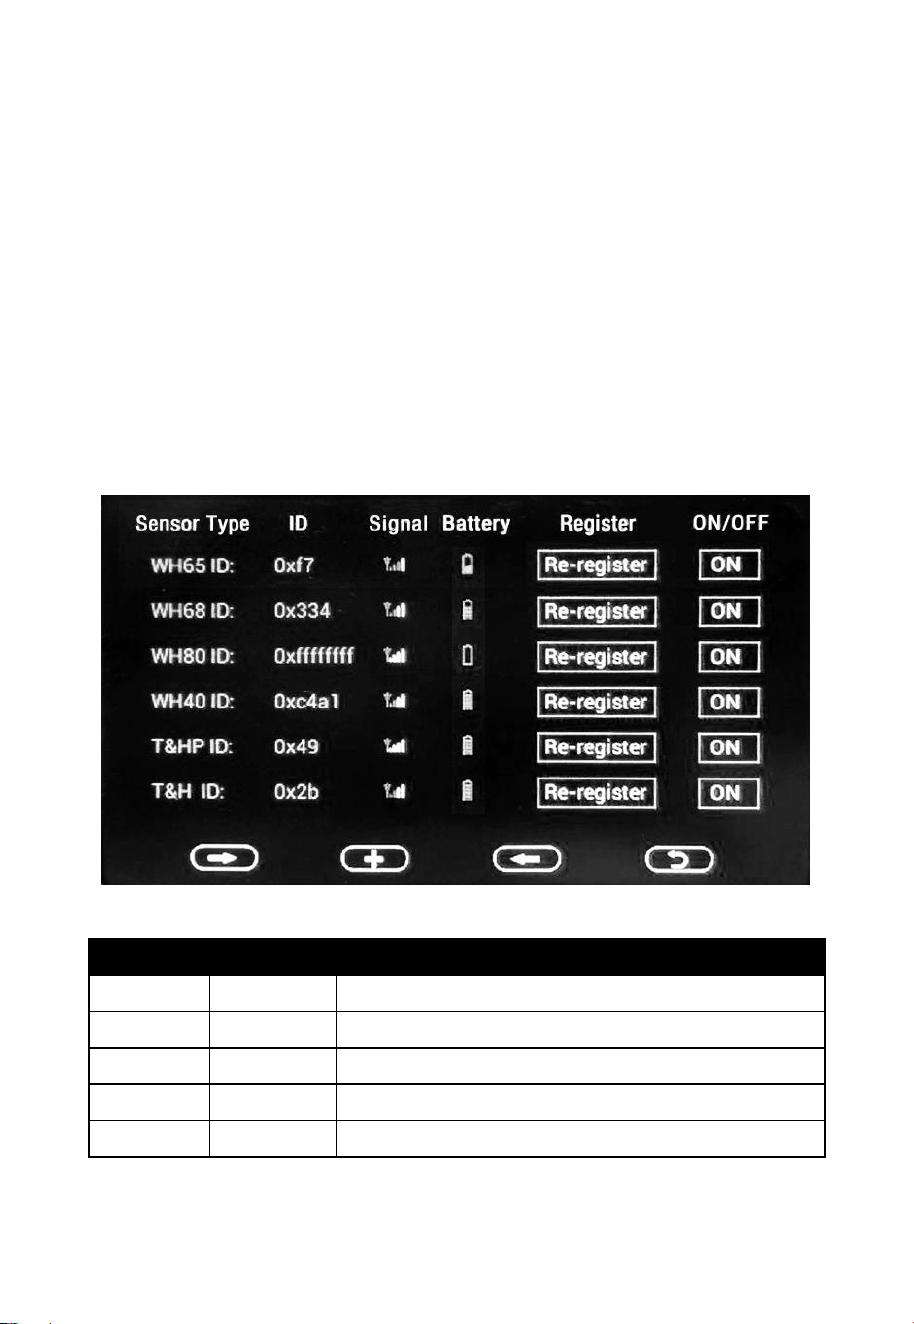
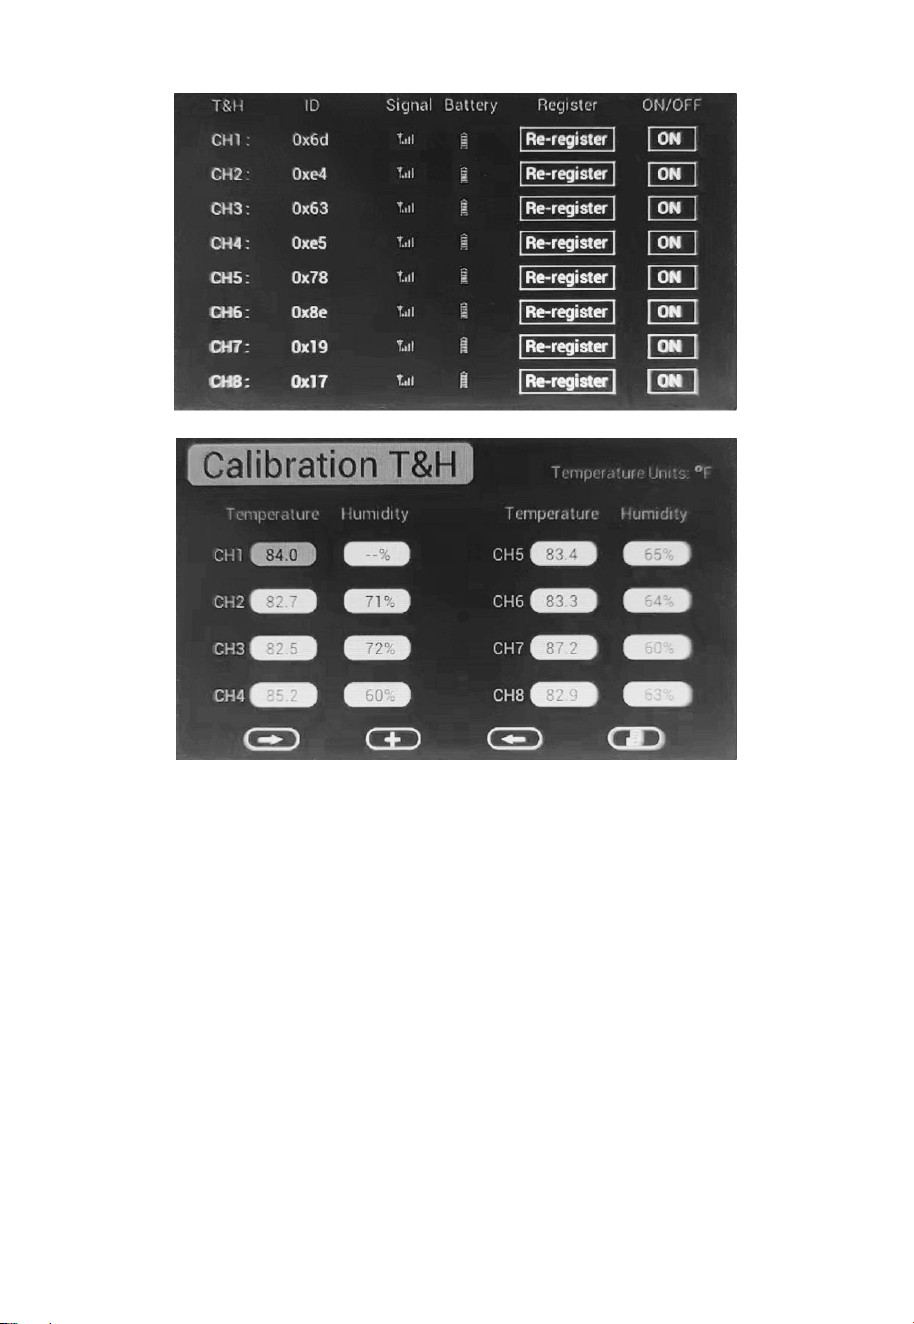
5.2.10 Sensor Type
On this page you can set the following:
View sensor ID, signal strength and battery power condition. 1-4 bars
means 1-4 successful successive signal receptions without missed ones.
Register the sensor when offline.
Enable or disable the sensor.
Here’s the signal icon and battery icon instruction:
ICON
Color
Item Description
Signal
White
No sensor data received
Signal
Green
Display signal strength
Battery
Blank
No sensor data received sensor body)
Battery
Green
Display battery power condition
Battery
Red
Display low battery alert
Note: When it displays “0xffffffff” on the ID place, it means that no sensor
data received.

28
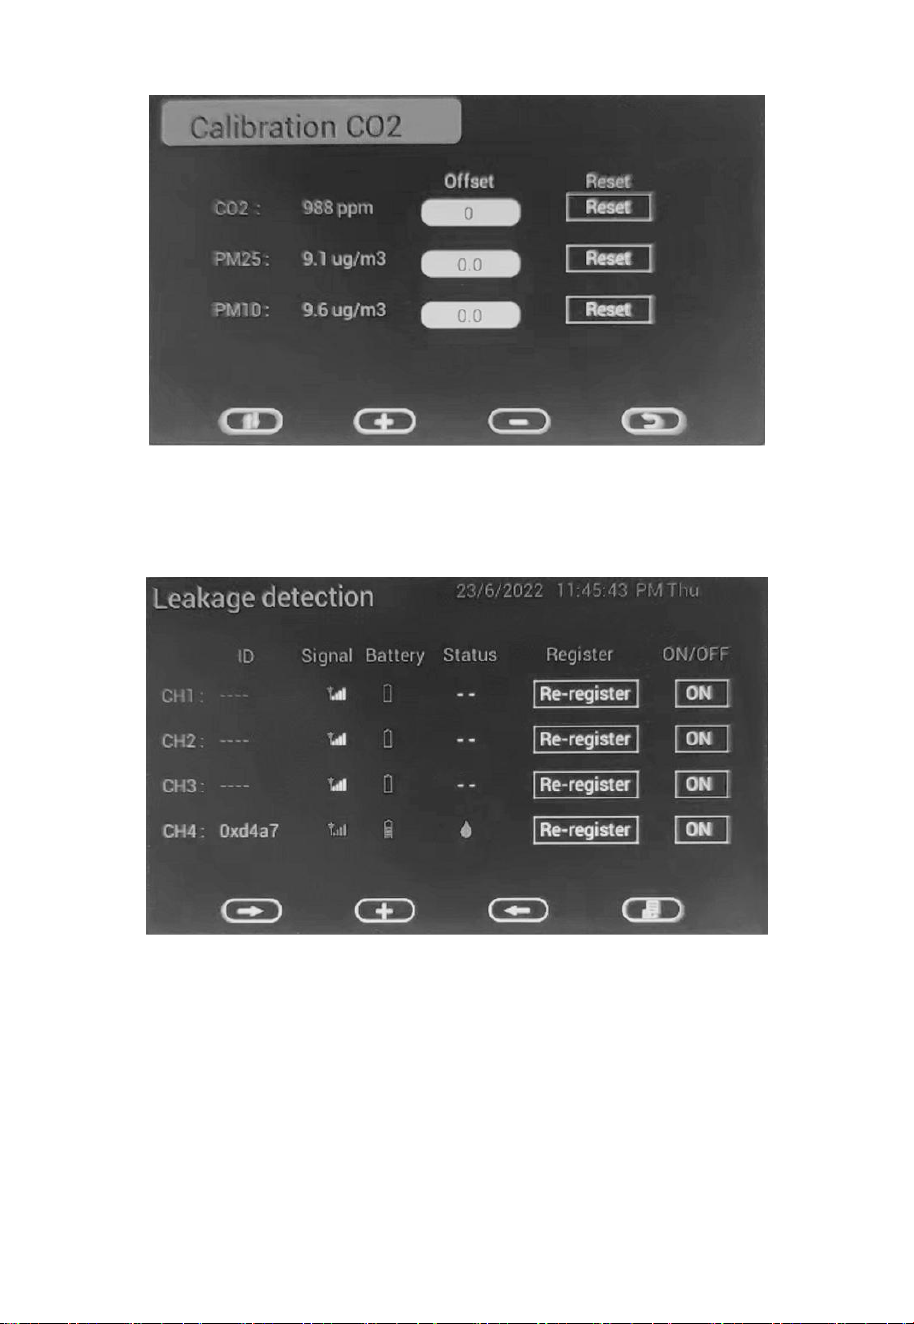
5.3 Calibration Mode
Calibration mode can be activated from “normal mode” by pressing the
MENU twice. Doing so will show a screen titled “Calibration” that offers 11
individual buttons for changing calibration values for specific sensors.
Use the GRAPH or TEMP button to move to the next, or previous, setting
(indicated by a right arrow above the button). The selected setting will be
highlighted in yellow. Press the RAIN button to change the settings for the
selected item. You will be shown a page with just that one value on it,
highlighted in yellow. You are now able to change the value for the
highlighted item. Use the RAIN/+ and TEMP/- buttons to change the value
in small amounts or hold these buttons for two seconds or more to make
rapidly repeating large changes. In the following buttons will sometimes be
referred to as just “next”, “previous”, “+” or “-” if that is their function.
In all cases you will change the value that would be displayed to a new value.
So, if you have determined (through a reference instrument for example)
that temperature is indicating 0.2F too high, you will select it and the page
will display the temperature that is too high. You now press the “-” key
twice to reduce it by 0.2 and press the MENU key to return to the previous
menu. The following can be adjusted in this manner:
Indoor temperature
Indoor humidity
Outdoor temperature
Outdoor humidity
Wind direction (compensate for inaccurate positioning during mounting)
Daily Rain total
Weekly Rain total
Monthly Rain total
Yearly Rain total
Absolute (ABS) barometric pressure (measured at the console)
Relative (REL) barometric pressure (calculated from ABS to correspond
to sea level)

29
The rain values are not corrections, but rather reflect totals accumulated so
far. They can be adjusted up or down as desired.
5.3.1 Calibration of barometric pressure settings.
Calibration of barometric pressure requires some additional understanding,
which we will provide here. Also provided is a step by step procedure for
calibrating correctly.
Absolute barometric pressure, can be calibrated at manufacturing time by
comparing with a precise instrument that measures pressure at the same
location. In practice, sometimes small adjustments of a few hPa may be
needed. The relative pressure represents what the air pressure would indicate
if your station was at sea level and depends on the altitude of your console
and cannot be known in advance. This is why it needs an adjustment.
There are different manners in which to handle this adjustment. We will
outline a reliable procedure below, which requires adjusting both pressures.
The method assumes that you have an official airport sufficiently nearby to
act as a reliable reference. Usually distances of up to 25 miles work reliably,
but this is not always true and depends on geography. We start by assuming
that your station’s absolute pressure reading is correct and needs no offset
correction.
The procedure below assumes you are starting from the console’s factory
setting. With those settings, ABS and REL should, at this time, be
displaying the same value. We also assume, for the moment, that ABS
pressure is 100% correct.
1. For this procedure we will get the most precise results if our display for
pressure is in hPa units. Even if you do not want to use those units
eventually, set the console to use them for now.
2. Determine the altitude, or elevation above sea level, of your station’s
console. This measurement is necessary to account for the difference in
air pressure caused by the elevation of your console. Elevation above
sea level reduces the absolute pressure measured by your sensor.
Determine this altitude using a GPS, or look it up using a tool such as

30
this web site: https://www.freemaptools.com/elevation-finder.htm. You
can input your location’s GPS coordinates, or manipulate the map to
your location. Click on “Estimate Elevation” and observe the result. For
an example we will use a console location at 42 ft. above sea level.
3. This tool will provide the ground level elevation at your location, so
you will need to add the right amount for how high above ground level
your console is. If you are on a ground floor and have the console on a
desk, you’ll have to add something like 3-4 ft. If you are using a GPS
system that tells you elevation, make sure it is right next to the console
and you’ll be able to read the correct elevation right from the GPS
results without further adjustment.
4. With the correct altitude/elevation in hand you will need to determine
the correct offset. To be added to the absolute pressure reading in order
to compute relative pressure (sea level equivalent). Correction tables
can be found on-line in many places. One example is the table found at
the web site at
https://novalynx.com/manuals/bp-elevation-correction-tables.pdf
5. Locate your elevation in the first column and read the correction in the
third column. This table, however is rather coarse, making it hard to be
precise. An alternative is an on-line calculator such as the one found
here:
6. http://www.csgnetwork.com/barcorrecthcalc.html
7. For our example of 42 ft. above sea level we input 42 ft. of elevation
and a standard pressure of 1013.25 hPa/mb and press calculate. We find
an “absolute barometer value” that should be -1.5626061222588443
hPa lower than at sea level. The inverse (because relative pressure is
higher than absolute pressure) of this number will be our “REL PRESS
OFFSET” value. Use the settings procedure to increase REL by +1.6
(nearest rounded value we can input).
8. Now we need a reliable reference for pressure at sea level. Locate the
official identifier for the nearest airport. Refer to “World Airport Codes”
at https://www.world-airport-codes.com or a similar reference. Enter
your location or nearby airport name, and press “Search.” Select the

31
correct airport from your search results and click on it. For example,
search for “Mountain View” and click on “Moffet Field”.
9. From the resulting page find the ICAO code, if listed. Otherwise use
the IATA code. For the example above, you would find IATA code
“NUQ”.
10. Now go to a web site like AVIATION WEATHER CENTER (for US
locations) at https://www.aviationweather.gov/metar?gis=off and enter
the code you found in step 2, and click “Decoded” (to make the next
step easier) before requesting the METAR information. For the
example we would enter “KNUQ” and find a result output like: “30.09
inches Hg (1019.0 mb) [Sea level pressure: 1019.1 mb]”.
11. Go to the calibration settings page and observe the “REL Barometer
value (this is the value we just adjusted in step 4 above). Compare the
REL value with the value from the airport. IN our example, the REL
display was 1022.9 where we expected 1019.1. This then tells us that
our displayed REL pressure is 1022.9 – 1019.1 = 3.8 hPa different from
the reference source.
12. Since we assumed the absolute pressure measured was correct, and we
presumably calculated the elevation related offset correctly, we must
conclude that the absolute pressure was not correct after all. It appears
to be 3.8 too high, so we’ll now enter a correction of -3.8 in the settings
for “ABS Barometer” until it reads a value 3.8 hPa lower than before.
This kind of correction is entirely normal as during manufacturing
small shifts in the pressure sensor readings can be introduced.
13. For a more precise procedure, locate a very precise barometer that you
can place right next to the console, you would adjust “ABS Barometer”
until the ABS pressure reads identical. You would then still adjust
“REL barometer” until it displays the value from the reference airport.
This procedure would also produce the correct relative pressure, but
due to a precise calibration of the absolute pressure, it too is correct.
The first procedure above generally works quite well, but for stations at
fairly high altitudes (e.g. 5,000 ft. or higher) it may be more incorrect than at

32
lower altitudes. In such cases comparisons with other known correct, and
nearby at similar altitude, stations may help.
Now that calibration is complete, feel free to change the pressure units to
whatever you like.
Note: Airport METAR data is often only updated every 10, 15 or even 30
minutes. If you use the information in the procedure above, you may
be looking at pressure data that is out of date by as much as the
update interval. To get best results observe several times and figure
out the update interval and then use two values for the procedure:
one taken immediately after an update, another taken about halfway
through the interval.
Note: It is also a good idea to observe some more after the calibration
procedure is complete to make sure the numbers are correct.
5.4 Alarm Mode
In ALARM mode you can activate alarms that will alert you to the presence
of alarmingly high or low sensor values. From normal mode, you can enter
alarm mode by pressing the MENU key three times to get to the “Indoor”
alarms page, or four times to get to the “Outdoor” alarms page.
When an alarm condition is met, the alarm will sound a loud beep, and the
alarm icon ( ) will flash on the top of the display. Press any button to
silence the alarm beep. The flashing alarm icon will stay until the alarm
condition itself is no longer satisfied (e.g. temperature drops below alarm
value, etc.)
You will see sensor values for which you can set alarm conditions. Each
sensor displays an editable high and low value, each followed by a
“bell/alarm” icon. Values, and the bell icon, can be changed using “+” and
“-” keys. The alarm is enabled when the bell icon is yellow and disabled
when it is gray. Use the MENU button to go to the next menu or long press
it to return to normal mode.

33
Alarms can be set for:
Indoor temperature
Indoor Humidity
Indoor absolute (ABS) barometer
Indoor relative (REL) barometer
Outdoor temperature
Outdoor humidity
Outdoor “Feels Like” temperature
Outdoor dew point temperature
Wind speed (high value alarm only)
Wind gust (high value alarm only)
5.5 Temperature Max/Min Mode
The “Temperature Max/Min” mode can be entered by pressing the MENU
button repeatedly from normal mode. The page displays maximum and
minimum values encountered, and the time and date of such, for the
following sensor values:
Indoor temperature
Indoor humidity
Outdoor temperature
Outdoor humidity
Dew point temperature
“Feels Like” temperature
The values are for observation only and cannot be changed.
5.6 Other Max/Min Mode
The “Other Max/Min” page can be entered from the “Temperature
Max/Min” page by pressing the MENU button once (long press to return to
the normal mode).
The page displays maximum and minimum values encountered, and the time
and date of such, for the following sensor values:

34
ABS Barometer
REL Barometer
Wind speed
Gust wind speed
Solar Radiation
UVI (UV-Index)
5.7 Rainfall
The “Rainfall” summary page can be entered from the normal mode by
repeatedly pressing the MENU key. The page displays (left column) the
current rain rate, and accumulated values for rainfall for the day, week,
month and year. On the right hand side, you will find the largest value ever
seen (since device installation or reset) for each of these values, along with
date and time that maximum value was observed.
5.8 Factory Mode
The “Factory” mode page can be entered from the normal mode by
repeatedly pressing the MENU key.
Use the GRAPH or TEMP button to move to the next, or previous, option
(indicated by a right arrow above the button). The selected option will be
highlighted in yellow. Press the RAIN button to change or activate the
selected option. In all cases you will next be asked if you want to proceed
with the chosen action, answering “Yes” or “No” by using the “next,” and
“previous” buttons to highlight (in yellow) the desired answer and press “+”
to select that answer.
The following options are available:
Factory Reset: Any and all customization to settings, calibration and
historical data will be erased and reset to factory default values.
Clear Max/Min: Removes all recorded maximum and minimum values
(for temperature in “section 5.5” and “other” in “section 5.6”)

35
Re-register Indoor: Forces the console to forget which indoor sensor it is
receiving and then start “looking” for available sensors and “registering”
the first one found.
Re-register Outdoor: Forces the console to forget which outdoor sensor
it is receiving and then start “looking” for available sensors and
“registering” the first one found. Both options should rarely be needed,
unless you have had to replace indoor or outdoor sensor(s) or in case of
troubleshooting
About: Displays various technical information that may be useful to
troubleshooting or for communication of issues with customer service.
Press MENU to return to the “Factory” mode page.
English: Displays the console’s language. Currently cannot be changed,
but future versions may allow choice of other languages.
Reconnect Wi-Fi: Disconnects the console from the Wi-Fi network and
then lets it reconnect using the already configured network name and
password. This should rarely be necessary but might be useful after you
have moved the console or Wi-Fi access point and want to check the
console is able to re-connect.
Wi-Fi Reset: Reset Wi-Fi to factory setting. This causes the already
configured network name and password to be erased. The console will
enter the Wi-Fi search mode and you will have to use your mobile
application to (re)configure a Wi-Fi connection as described in section
TBD.
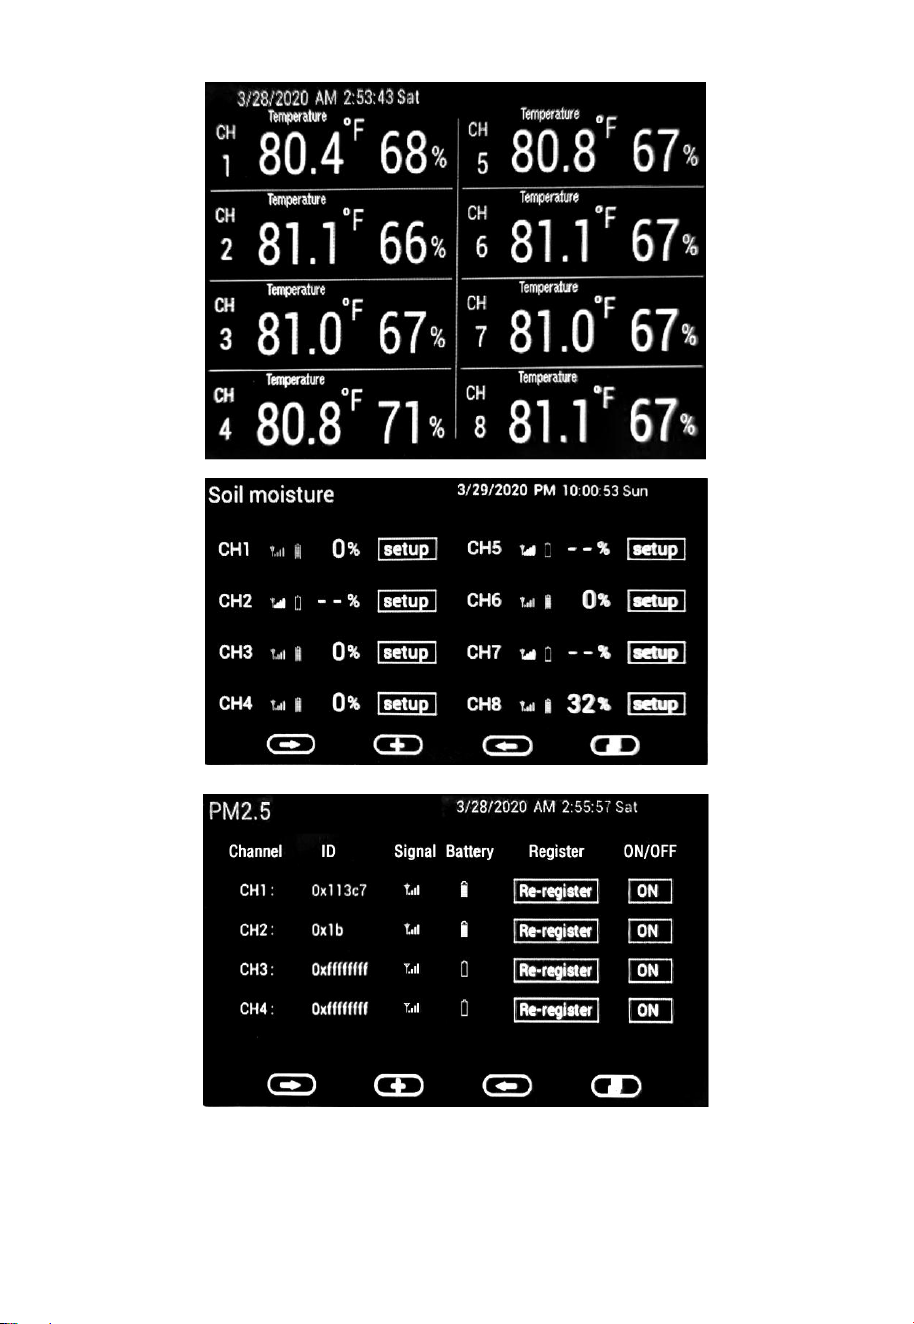
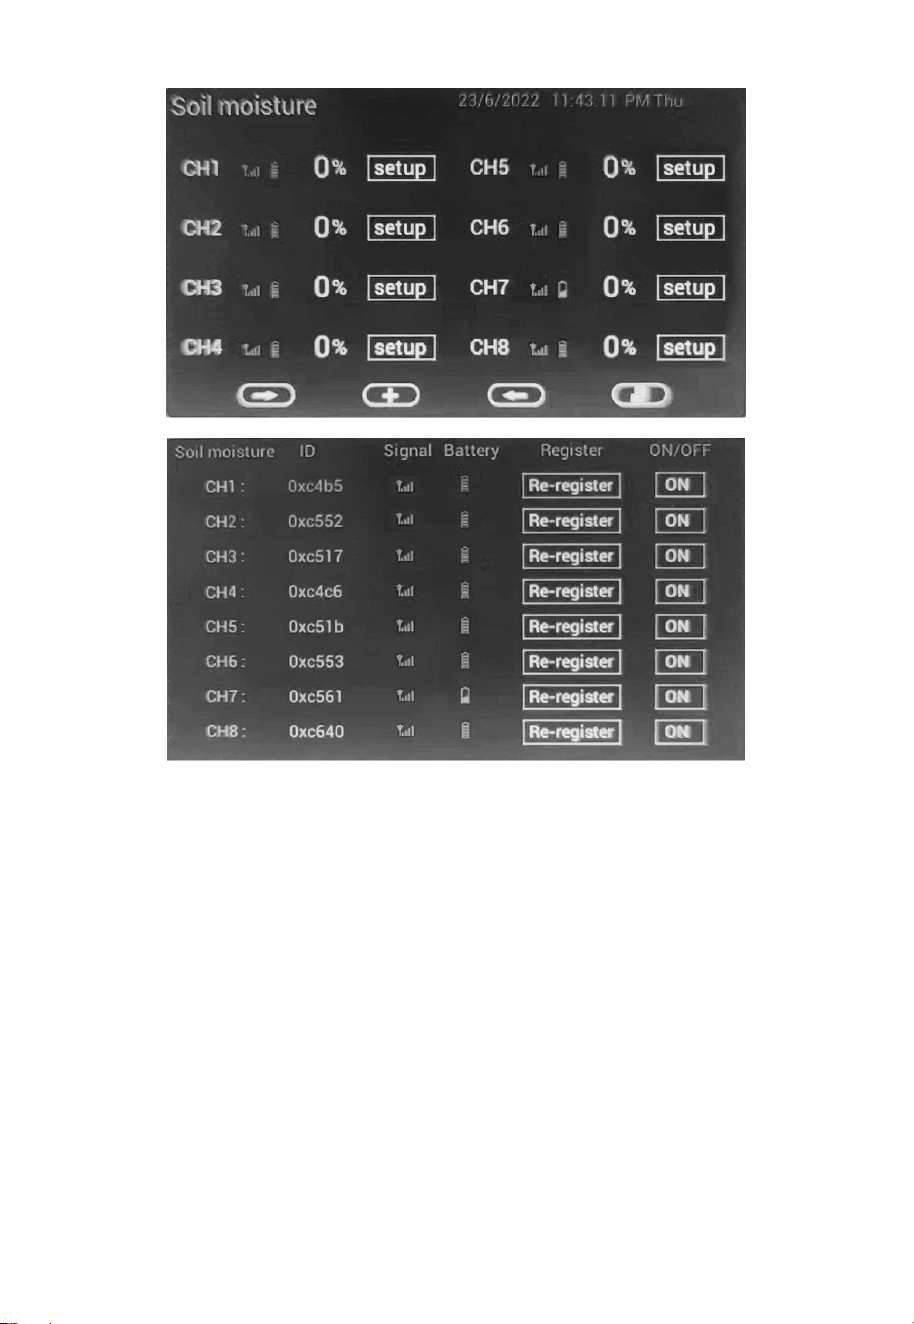
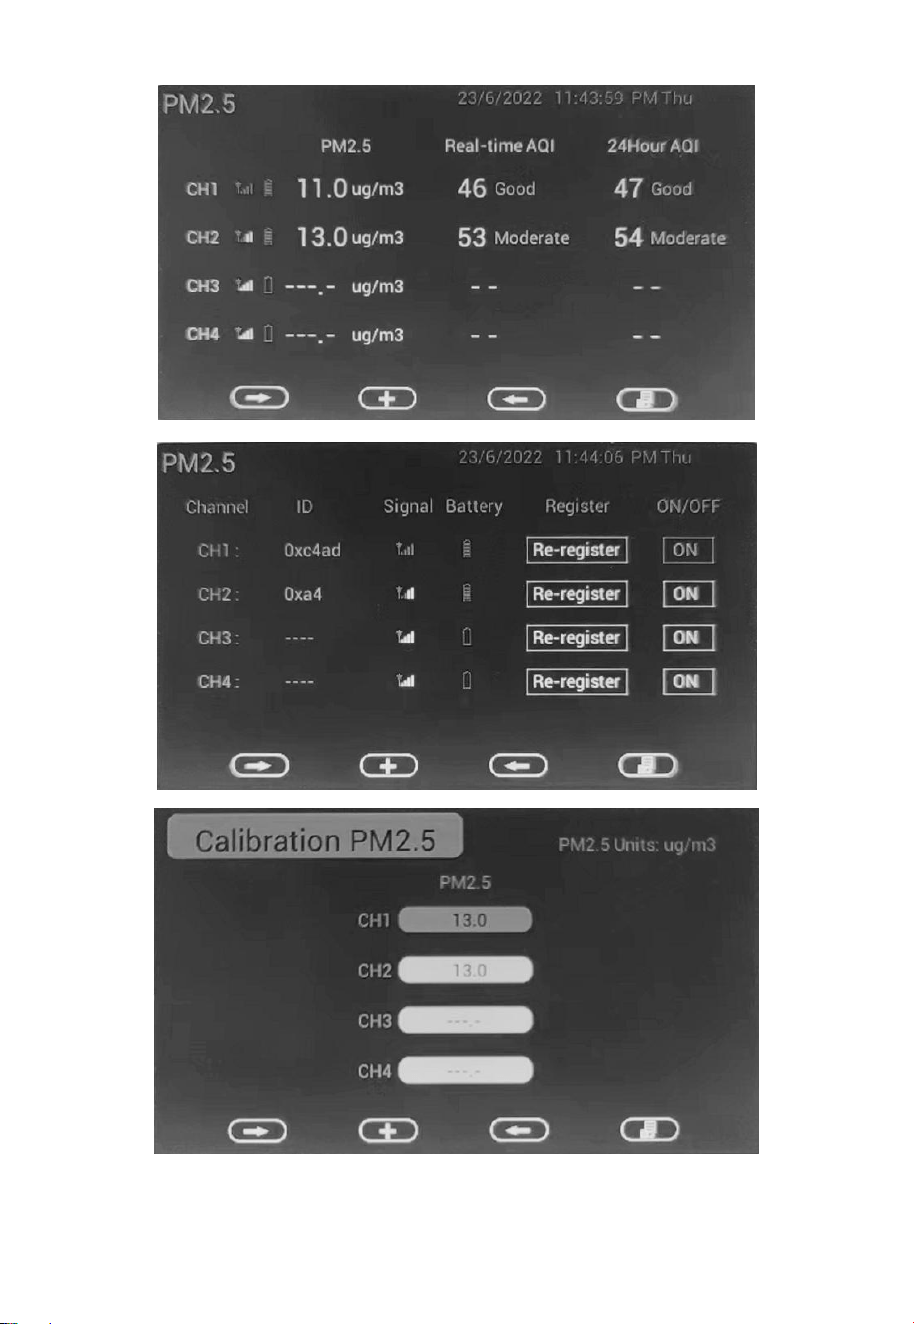
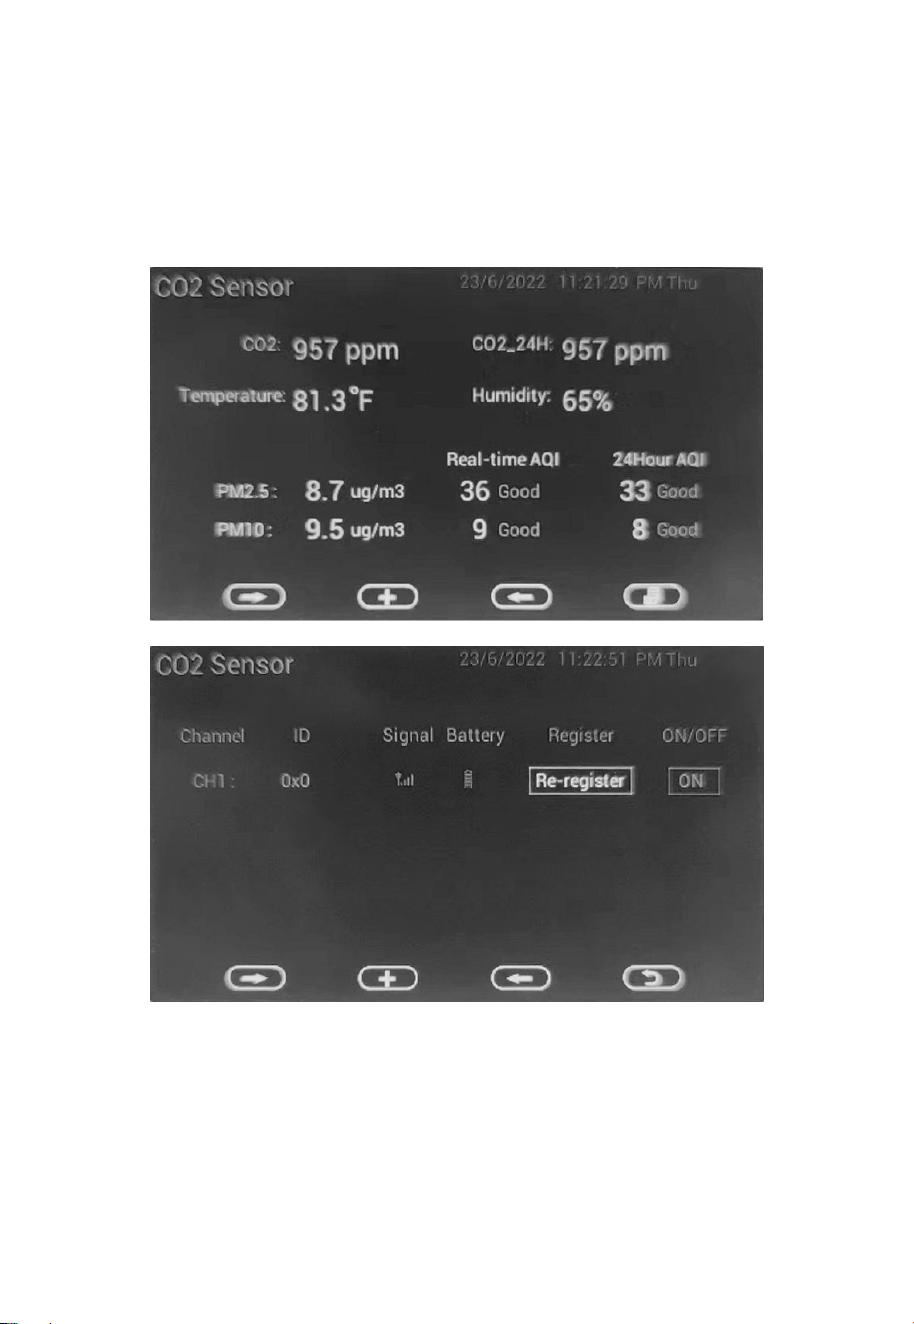
5.9 Display Mode for optional sensor(s)
In normal mode, hold the TEMP/- button for 5 seconds will enter the
optional sensor(s) display mode. Press the MENU button can skip to full
display another type of optional sensor(s):
36
37
Note:
1. In optional sensor(s) display mode, hold the RAIN/+ button for 5s will
enter corresponding calibration mode.
2. In soil moisture sensor display mode, select the setup button will enter
the calibration mode.
3. For the calibration setting of each kind of sensor, please refer to the
corresponding sensor manual on our website.
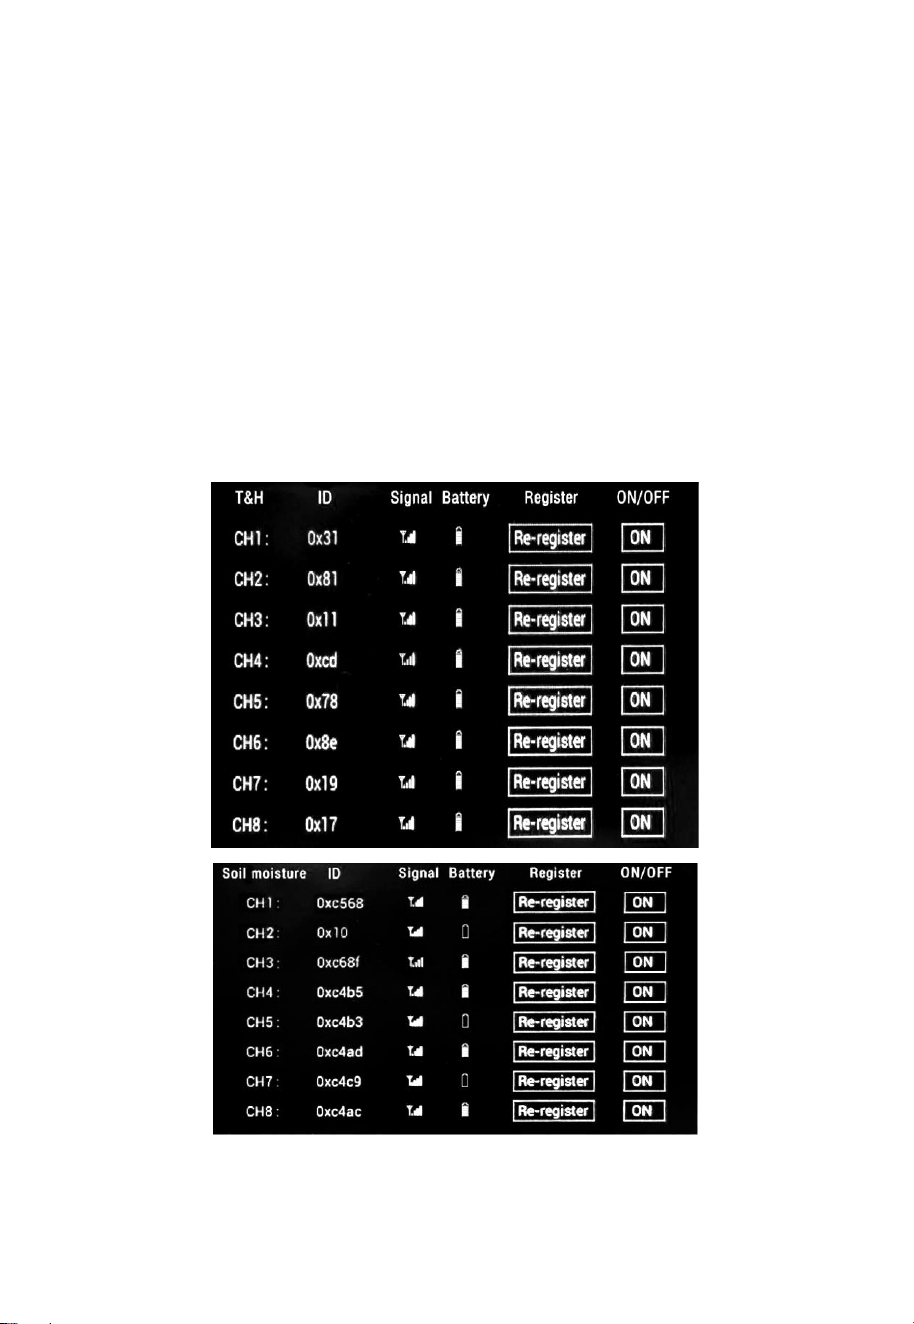
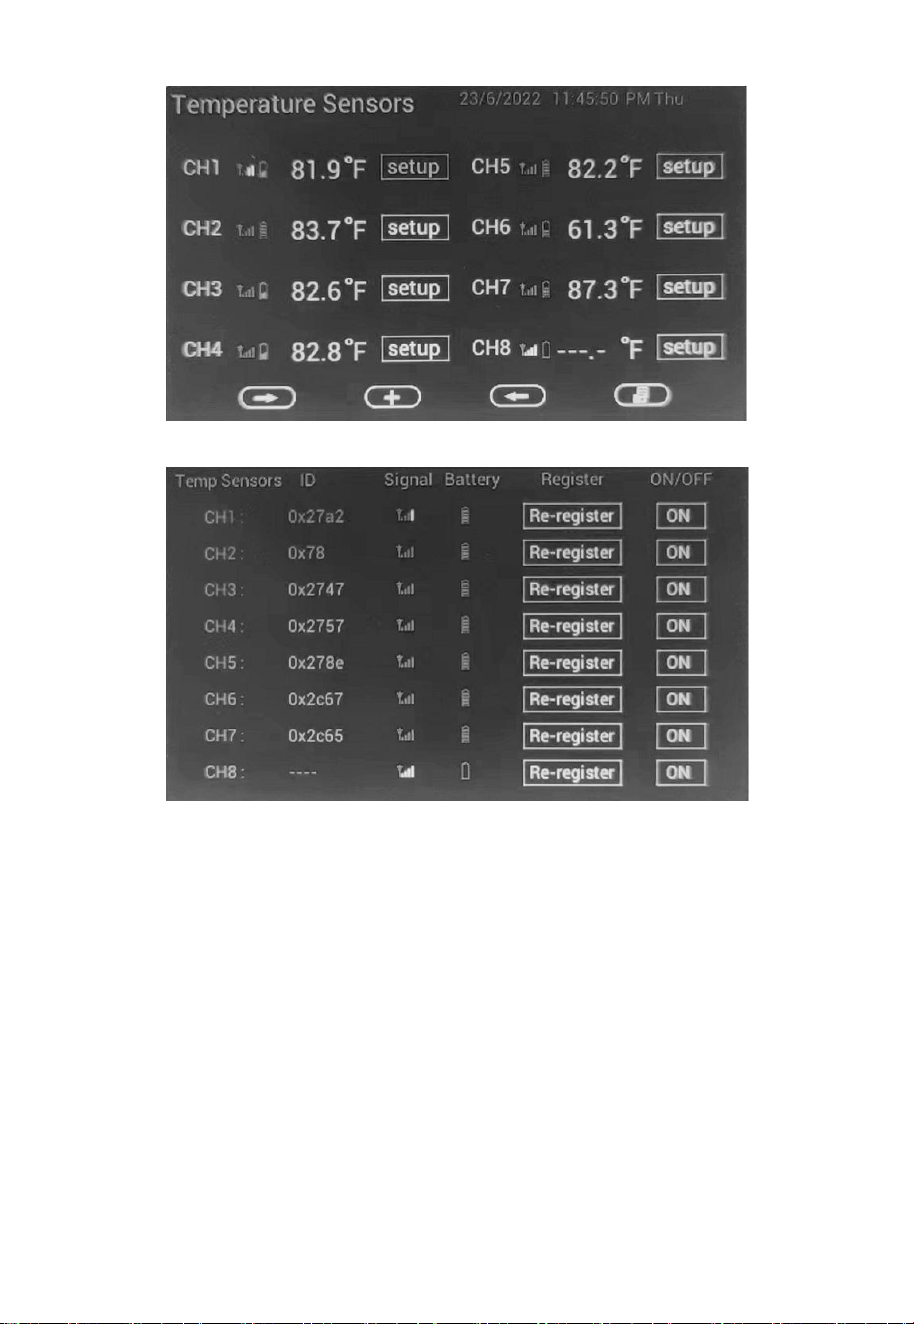
5.9.1 Sensor management mode for optional sensors(s)
In each optional sensor(s) display mode, hold the TEMP/- button for 5
seconds will enter sensor management mode:
38
On this mode you can set the following:
View sensor ID, signal strength and battery power condition. 1-4 bars
means 1-4 successful successive signal receptions without missed ones.
Register the sensor when offline.
Enable or disable the sensor.
ADDON Sensors:
Accessory Sensor Management is also possible. For the extra sensor type
supported, it needs the following handling to activate the setup page for
these different sensor types:
1. WH31/WN36 multi channel temp sensor
Hold “TEMP/-” button 5 seconds to enter multi-channel sensor
management page. Hold “RAIN/+” button 5 seconds to enter calibration
mode.
39
2. WH51 Soil Sensor
Hold “TEMP/-“ button 5 seconds to enter multi-channel display page,
then press “menu” button once to enter wh51 soil sensor page
management page. Hold “TEMP/-“ button 5 seconds to enter sensor ID
register page.
40
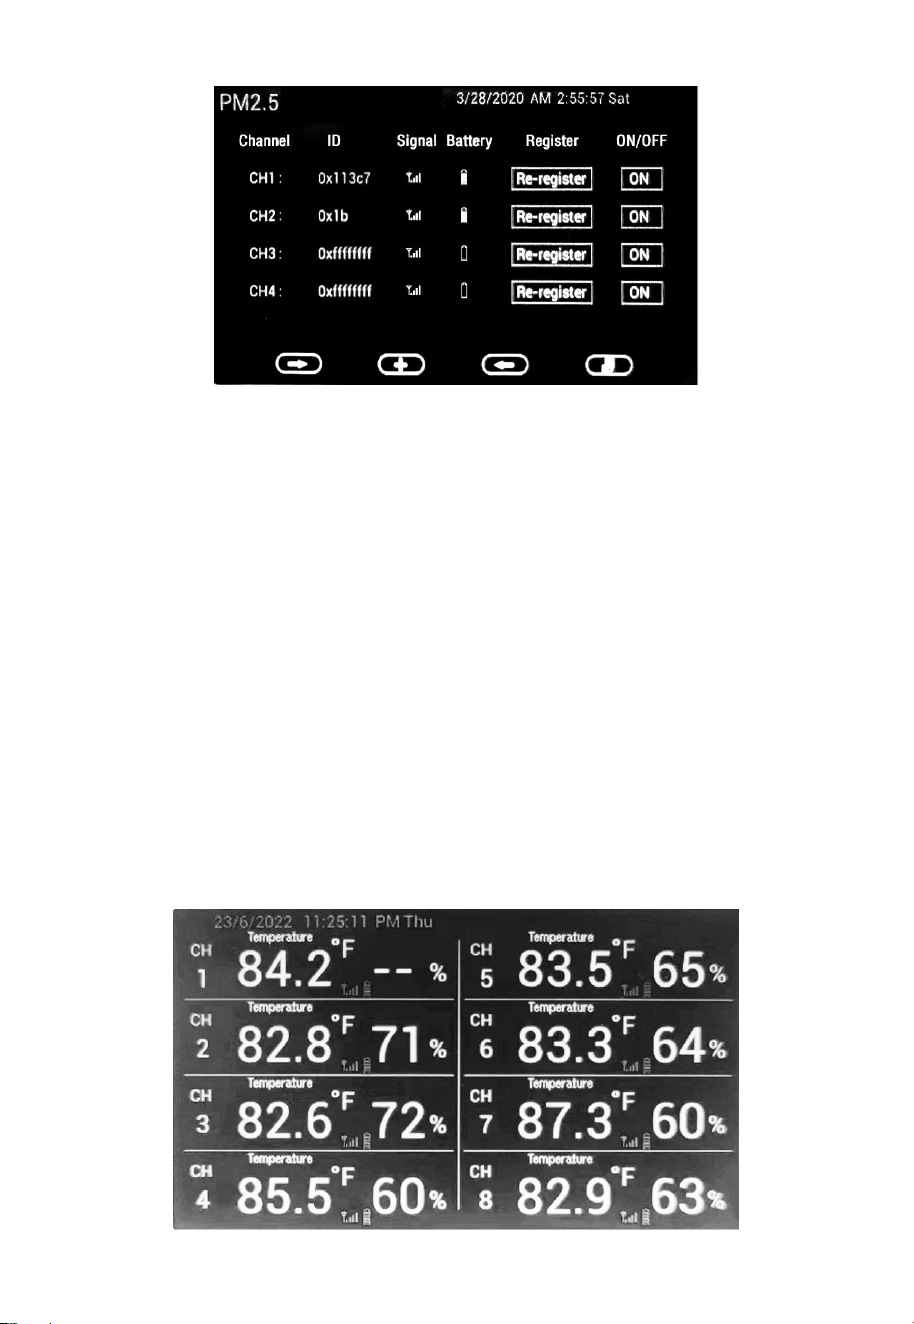
3. PM2.5 Sensor WH41/43
Hold “TEMP/-” button 5 seconds to enter the multi-channel sensor
management page. Press “menu” button twice to enter PM2.5 sensor
management page. Hold “TEMP/-” button 5 seconds to enter sensor ID
register page. Hold “RAIN/+” button 5s to enter calibration mode.
41
42
4. CO2/PM2.5 WH45 sensor
Hold “TEMP/-“ button 5s to enter multi-channel sensor page. Press
“menu” button for 3 times to enter CO2 sensor display page. Hold
“TEMP/-“ button 5s to enter sensor ID register page, or hold “RAIN/+”
button 5s to enter calibration mode.
43
5. Water Leak Sensor
(
WH55
)
Hold “TEMP/-“ button 5s to enter multi-channel sensor display page.
Press “menu” button 4 times to enter wh55 sensor register page.
6. WN34 Temp Sensor
Hold “TEMP/-“ key 5s to enter multichannel sensor display page, then
press “menu” button for 5 times until Temperature Sensors page
displayed. Press “TEMP/-” button 5s to enter ID setting page: move
cursor to “setup” and you can enter the sensor ID register page.
44
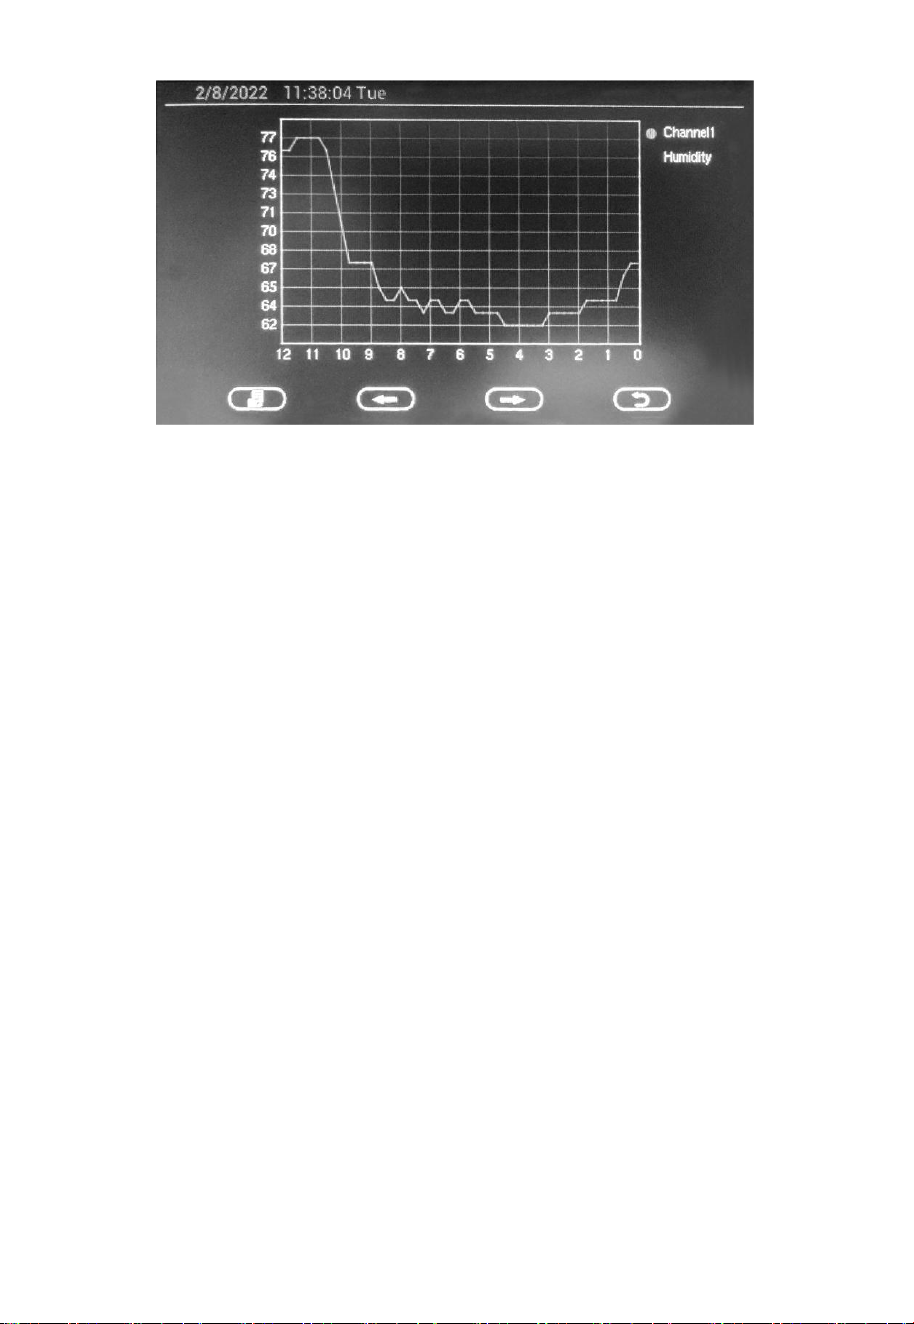
7. Leaf wetness sensor WN35
Press “TEMP/-”button 5s to enter multi-channel display page. Press
“menu” button for 6 times to enter wh35 sensor page. Hold pressing
“TEMP/-“button 5s to enter sensor ID register page.
45
5.9.2 Graph mode for optional sensors(s)
In each optional sensor(s) display mode, hold the GRAPH button for 5
seconds will enter graph mode:
46
6 Other Console Functions
6.1 Historical data storage
The console can record historical weather data when an appropriate
microSD card is inserted in the slot available for this purpose. This is an
optional feature so there will be no problem if you do not install a card.
If you wish to install a card you should use a microSD card. Capacity of this
card is not critical, nor is its “speed class.” Historical data will be written
less often than once a minute, and this is why speed is not critical. While
there is no minimum card size, you can take some guidance from the fact
that a 1 GB card can store in excess of 10 years’ worth of recorded data.
The card should be formatted in MS-DOS FAT format before inserting it in
the slot; Most cards come pre-formatted this way.
Insert the card and press with your finger until you feel a slight “click.” A
correctly installed card will be almost flush with the console housing,
protruding by one or two finger nail thicknesses.

47
6.2 Firmware update
When new firmware for the console is available(will be released on the
www.ecowitt.com), it can be simply done with a micro SD card(max 32G
supported, not included).
Steps for updating the firmware,
1. Take out your microSD card from the console.
2. Drag the Firmware.bin and picture.bin(from the zipped file available on
www.ecowitt.com) under the root directory of your microSD card.
3. Insert the card into the console - power off the console - power on the
console - update the program.
If it cannot be updated, please try a new microSD card.
If you could not download the file, please contact the customer service.
The WIFI firmware can be updated on the WS View PLUS or Ecowitt APP.
When new WIFI firmware is available, it will display when you select your
device on the Device List of the app.
6.3 Beaufort Wind Force Scale
If you have selected the use of Beaufort wind speed units, you can use the
table below for reference. The Beaufort scale is based on qualitative wind
conditions and how they would affect a ship’s (frigate) sails (so yes, it is an
“old” standard). It is therefore less precise than the other scales but is still in
use in various locales.
48
Wind speed
Beaufort
number
Description
0 - 1 mph, or 0 - 1.6 km/h
0
Calm
1 - 3 mph, or 1.6 - 4.8 km/h
1
Light air
3 - 7 mph, or 4.8 - 11.3 km/h
2
Light breeze
7 - 12 mph, or 11.3 -1 9.3 km/h
3
Gentile breeze
12 - 18 mph, or 19.3 - 29.0 km/h
4
Moderate breeze
18 - 24 mph, or 29.0 - 38.6 km/h
5
Fresh breeze
24 - 31 mph, or 38.6 - 49.9 km/h
6
String breeze
31 - 38 mph, or 49.9 - 61.2 km/h
7
Near gale
38 - 46 mph, or 61.2 - 74.1 km/h
8
Gale
46 - 54 mph, or 74.1 - 86.9 km/h
9
Strong gale
55 - 63 mph, or 88.5 - 101.4 km/h
10
Storm
64 - 73 mph, or 103 - 117.5 km/h
11
Violent storm
74 mph and above, or 119.1 km/h
and above
12
Hurricane
Table 3: Beaufort wind force scale
49
7 Publishing to Internet Weather Services
Your console is capable of sending your sensor data to select internet-based
weather services. The supported services are shown in the table below:
Service
Website
Description
Ecowitt Weather
https://www.ecowitt.net
Ecowitt is a new weather
server that can host a bunch
of sensors that other services
don’t support.
Weather
Underground
https://www.wunderground.
com
Weather Underground is a
free weather hosting service
that allows you to send and
view your weather station
data real-time, view graphs
and gauges, import text data
for more detailed analysis
and use iPhone, iPad and
Android applications
available at
Wunderground.com.
Weather Underground is a
subsidiary of The Weather
Channel and IBM.
WOW
http://wow.metoffice.gov.uk/
WOW is a UK based
weather observation
website.
Customized
Website
Supports uploading to your
customized website, if the
website has the same
protocol with
Wunderground or Ecowitt
Table 4: Supported weather services

50
7.1 Wi-Fi Connection for the Weather Station Console
To send weather data to these services you must connect your console to the
internet via Wi-Fi. The console can only operate using Wi-Fi when the
external power adapter is connected and plugged in!
Note: If you are testing the setup with the outdoor sensor package nearby
and indoor, you may want to consider connecting to Wi-Fi, but not
yet configuring any of the weather services. The reason is that while
indoor the temperatures and humidity recorded by the outdoor
sensor, and as reported to the weather service(s) will reflect indoor
conditions, and not outdoor conditions. Therefore, they will be
incorrect. Furthermore, the rainfall bucket may be tripped during
handling, causing rain to register while it may not actually have
been raining. One way to prevent this is to follow all instructions,
except to use an incorrect password, on purpose! Then, after final
outdoor installation, come back and change the password after
clearing console history. That will start uploading to the services
with a clean slate.
7.1.1 Configure Device – Connect your console with WIFI
The console can function as an independent Wi-Fi access point during Wi-Fi
configuration. This will be used to allow your mobile application to connect
to it directly during configuration (temporarily), passing configuration
information about your normal Wi-Fi network to the console so that it can
later connect to your preferred Wi-Fi network.
Please follow the following procedure based on WSVIEW PLUS app:
1. Download the mobile application WS View PLUS or Ecowitt APP
from the iOS App Store or Google Play store, as appropriate for
your device.
2. Power your console with the included AC adapter and ensure it is in
Wi-Fi configuration mode (Wi-Fi icon and M-B flashing). If it is not,
follow the procedure to put it in that mode (Press the MENU button
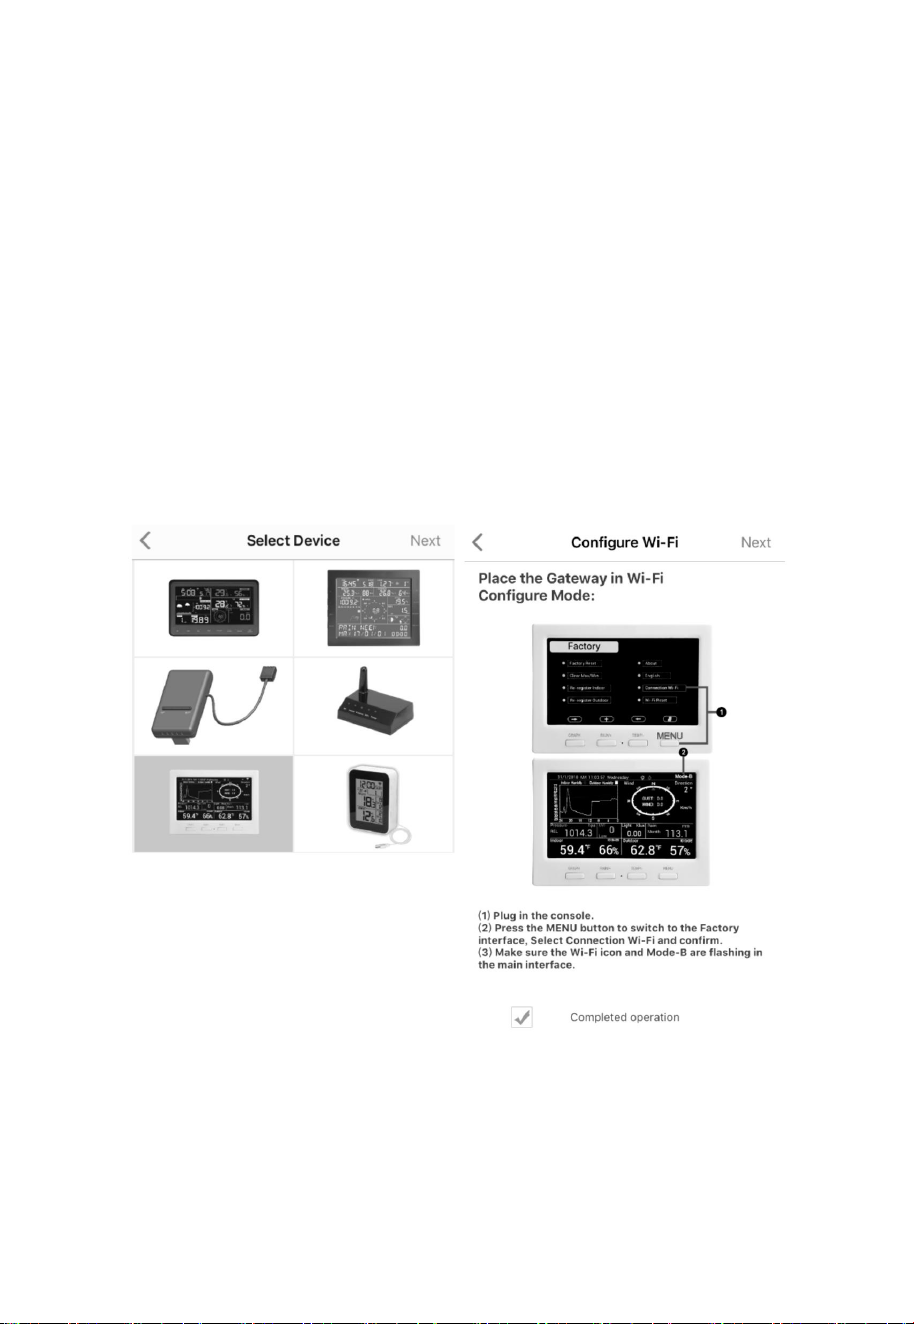
51
to switch to the Factory mode – Select Connection Wi-Fi and
confirm)
3. Start the application and make sure the location permission function
is granted (on) when you are running the app for the first time. In
case you disabled the location access function for this application,
please go to your mobile device settings page and configure it as
“on”. The application needs your location to configure weather
services.
4. Press “Configure New Device”. This may be automatic on the very
first use of the application.
5. Tap on the appropriate device type and select “Next”. Follow the
prompts.
6. Confirm Wi-Fi configuration mode is active, as prompted. Correct if
necessary (see above). Press “Next”.

52
7. Enter your preferred Wi-Fi SSID (network name) and security
password. Press “Next”. This will be communicated to the console
in a later step.
8. Now switch your mobile device to the ad-hoc Wi-Fi network
created by your console. It will be named something like
“EasyWeather-WIFI” followed by some numbers. Wait until
connected. You may see a message such as “Unsecured Network”
and “No Internet connection”: this is normal and can be ignored.
9. Return to the mobile application. The connection should be
recognized, and you should see a few messages about connecting to
the console and configuring it. The Wi-Fi icon on the console
should now no longer be flashing and display steady.
10. Your mobile device should have been returned to your normal
Wi-Fi network setting and the page will automatically jump to
Upload page.
If not successfully, please contact the customer service resolve the issue.
7.2 Adding weather services
You may have configured weather services during the initial configuration,
or you may do so later. To do so, open the mobile application and select
your device from the device list. This will bring you to the “Upload” screen
for the device.
Navigate to the weather service you wish to configure by pressing “Next”
and enter the appropriate data.
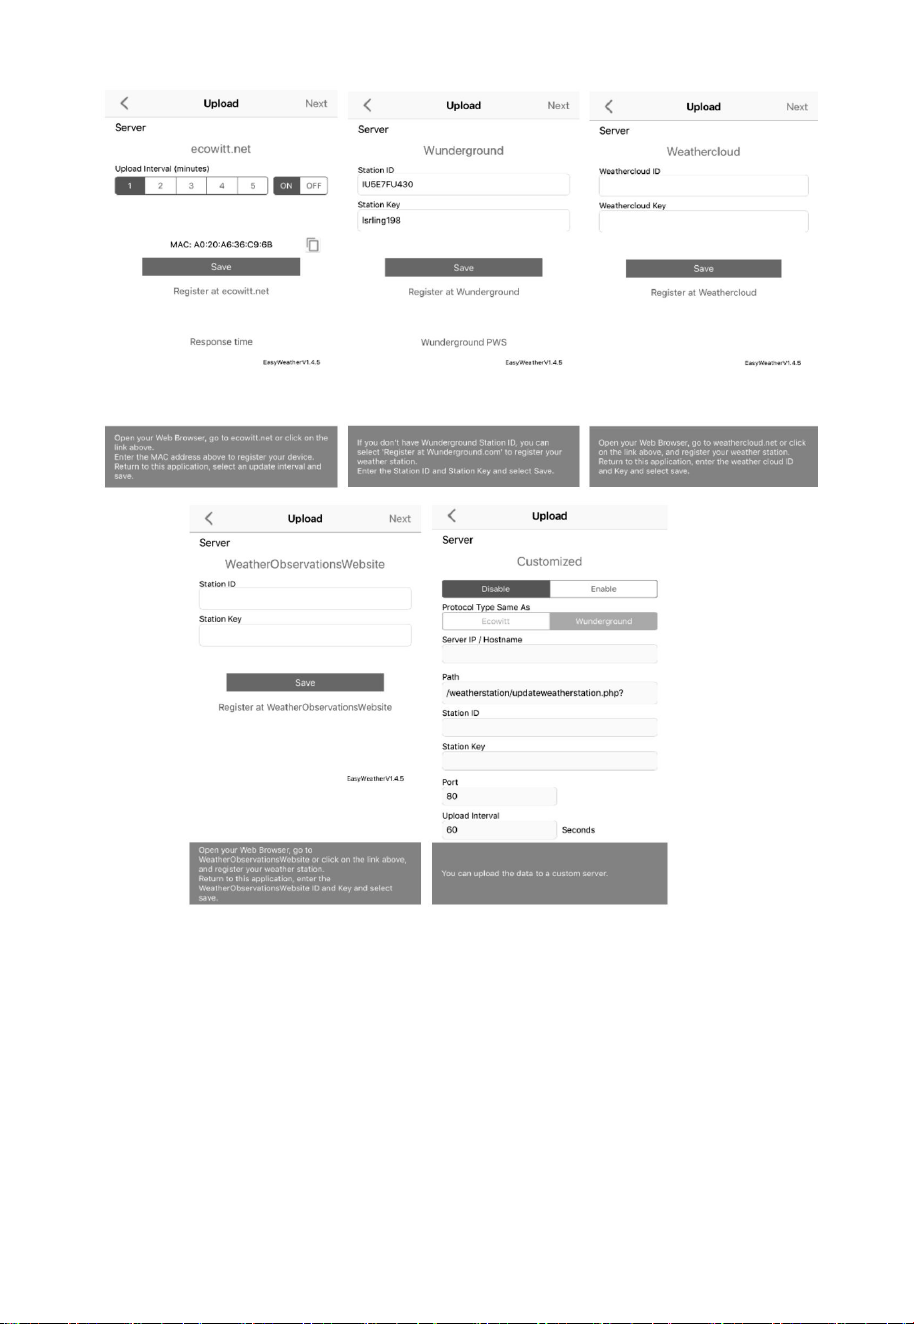
53
Figure 17
7.2.1 Ecowitt Weather
It’s recommended to use the Ecowitt Weather server to monitor and record
your sensors’ data. Configure as follows:
On the ecowitt.net uploading page, enable the ON button (displayed
blue) and set the uploading interval time.
Press Save on the page.
Press “Register at ecowitt.net” and finish the registration on the page.
54
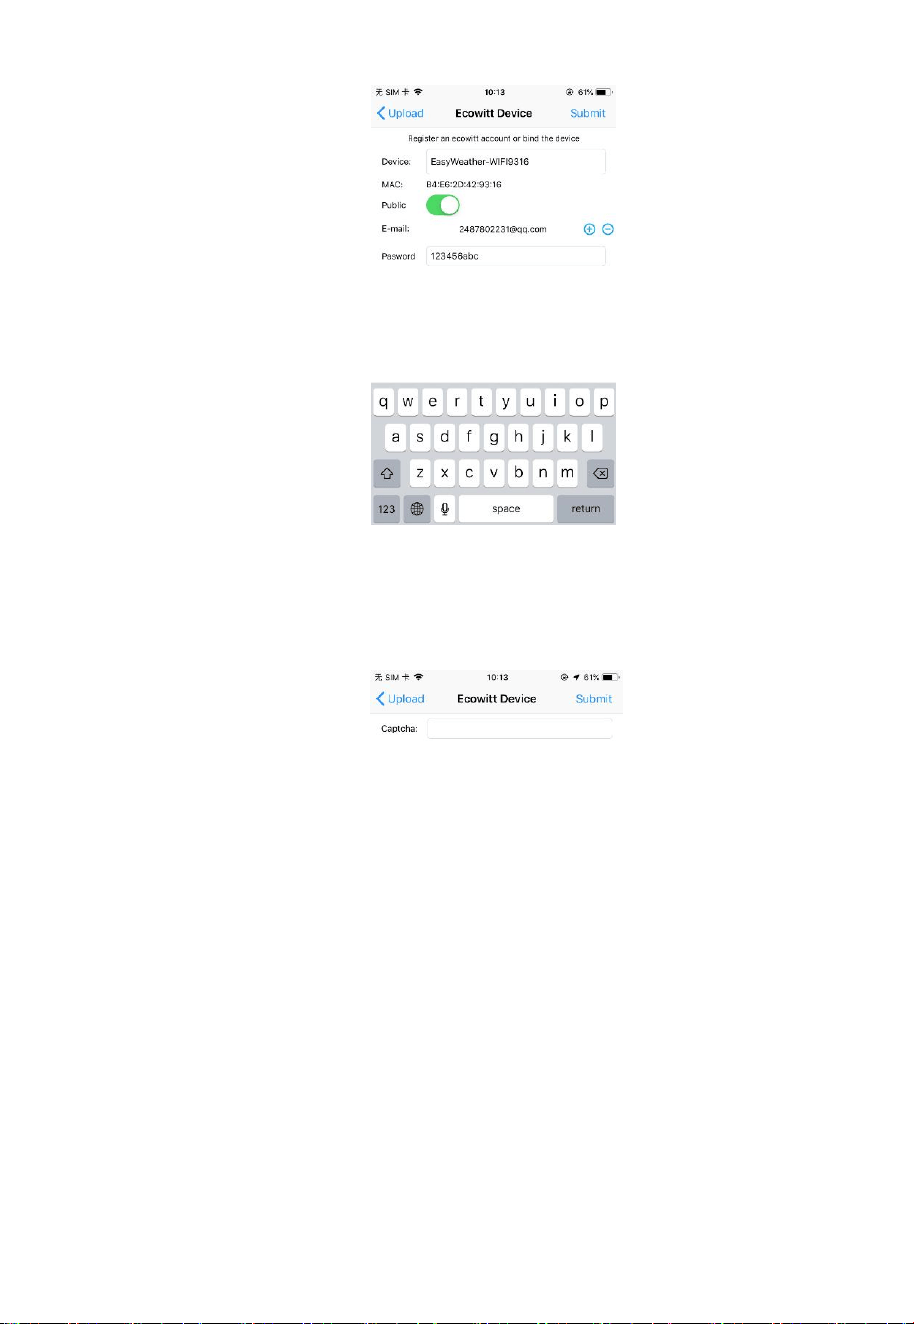
Press the “+” button and select enter your email address.
Set a password for your ecowitt account
Press Submit.
Enter the captcha you received from your email box and press submit.
It will jump to the ecowitt.net dashboard and display the sensor data
within several minutes.
Note:

55
If you could not receive the captcha from your email box, please check the
spam.
It only supports setting the units and language on the
WS View PLUS or Ecowitt APP. To use the full settings, please visit the
ecowitt website on your browser or on a computer.
If you could not register on the WS View PLUS or Ecowitt APP, please go
to the website to register your account and add the device via its MAC
address.
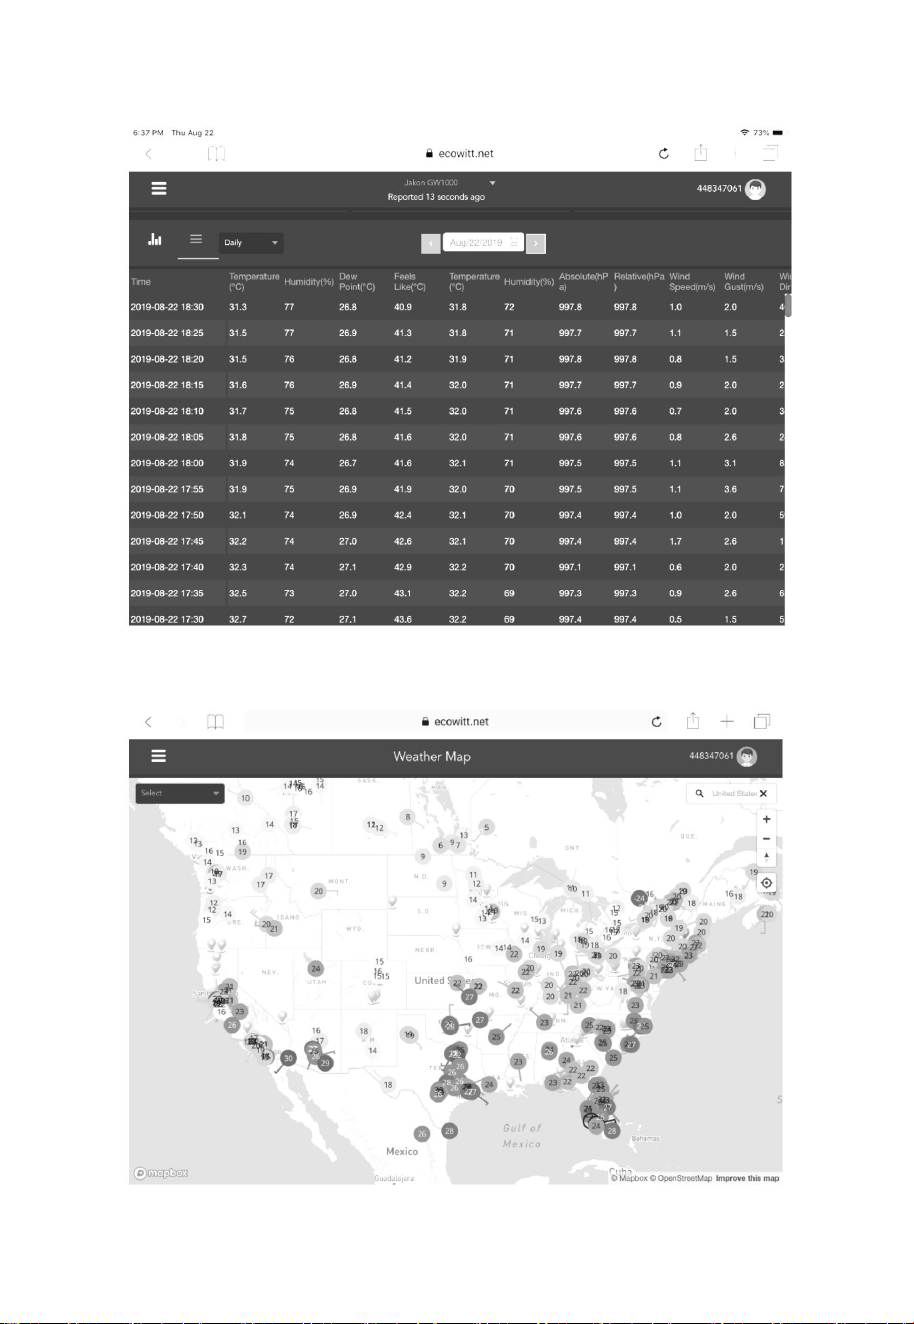
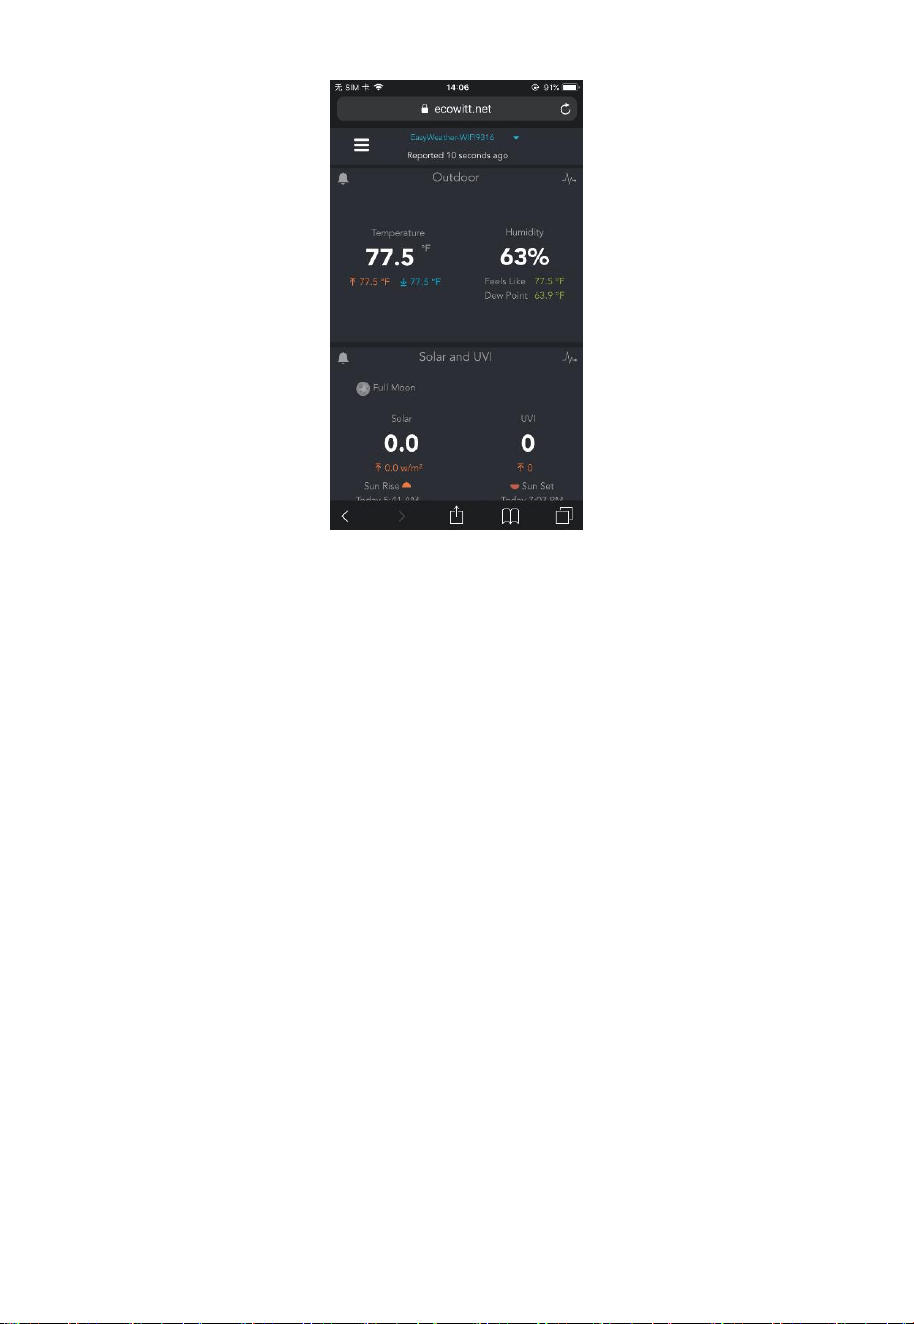
7.2.2 Viewing data on ecowitt.net
You can also observe your sensor’s data by using the ecowitt.net website:
https://www.ecowitt.net
Once you registered successfully on ecowitt.net, it will generate a URL like
this one on the website, where your station ID replaces the text
“STATIONID”.
https://www.ecowitt.net/home/index?id=STATIONID
Note: If you want to share your station data with other users, you’ll need to
set your data to be public. Other users need to log in the ecowitt.net first to
view your data.
It will show a page such as this, where you can look at today’s data and
historical data as well.
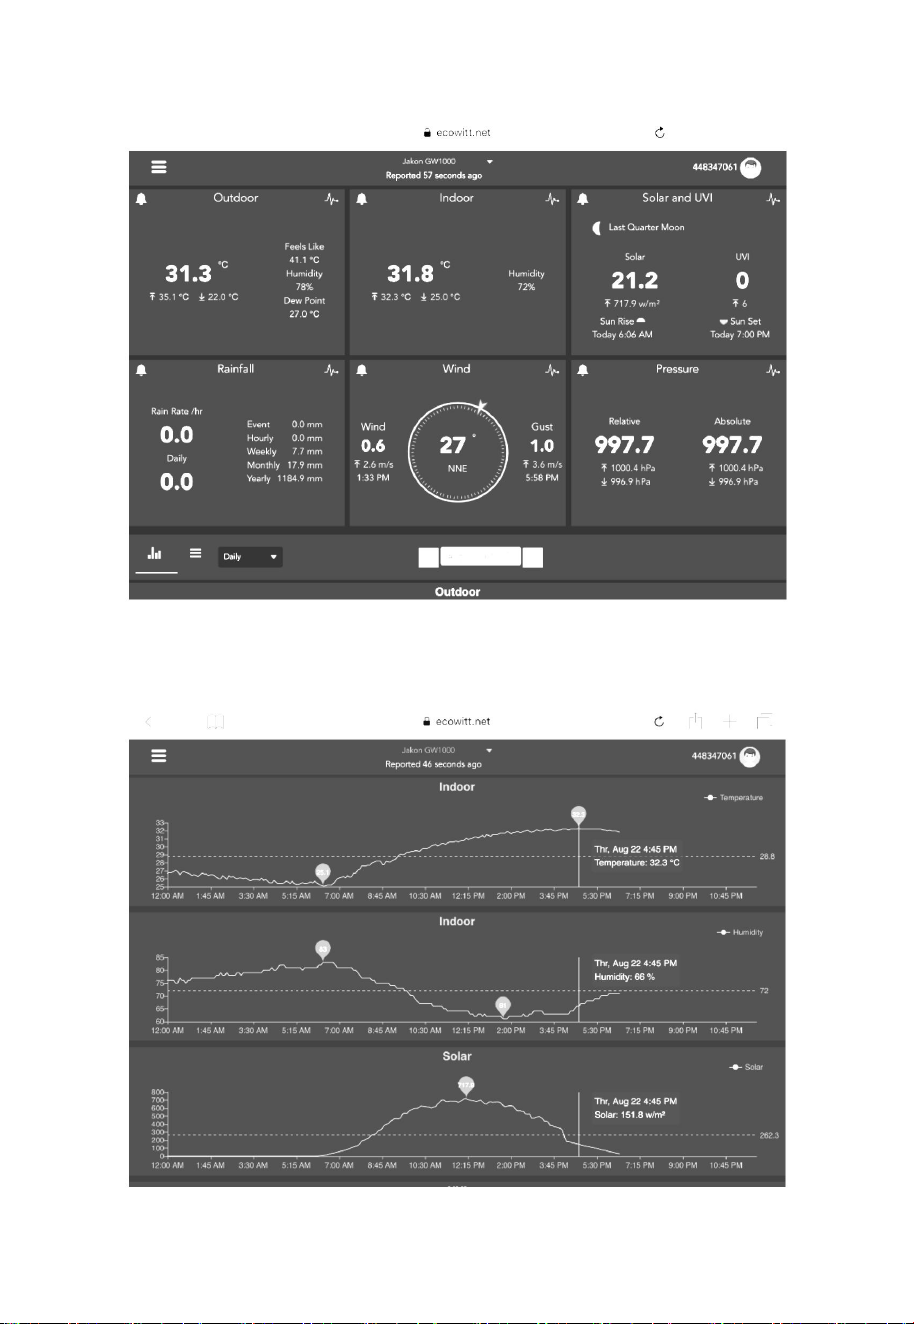
56
Dashboard
Graph display
57
List display
Weather Map
58
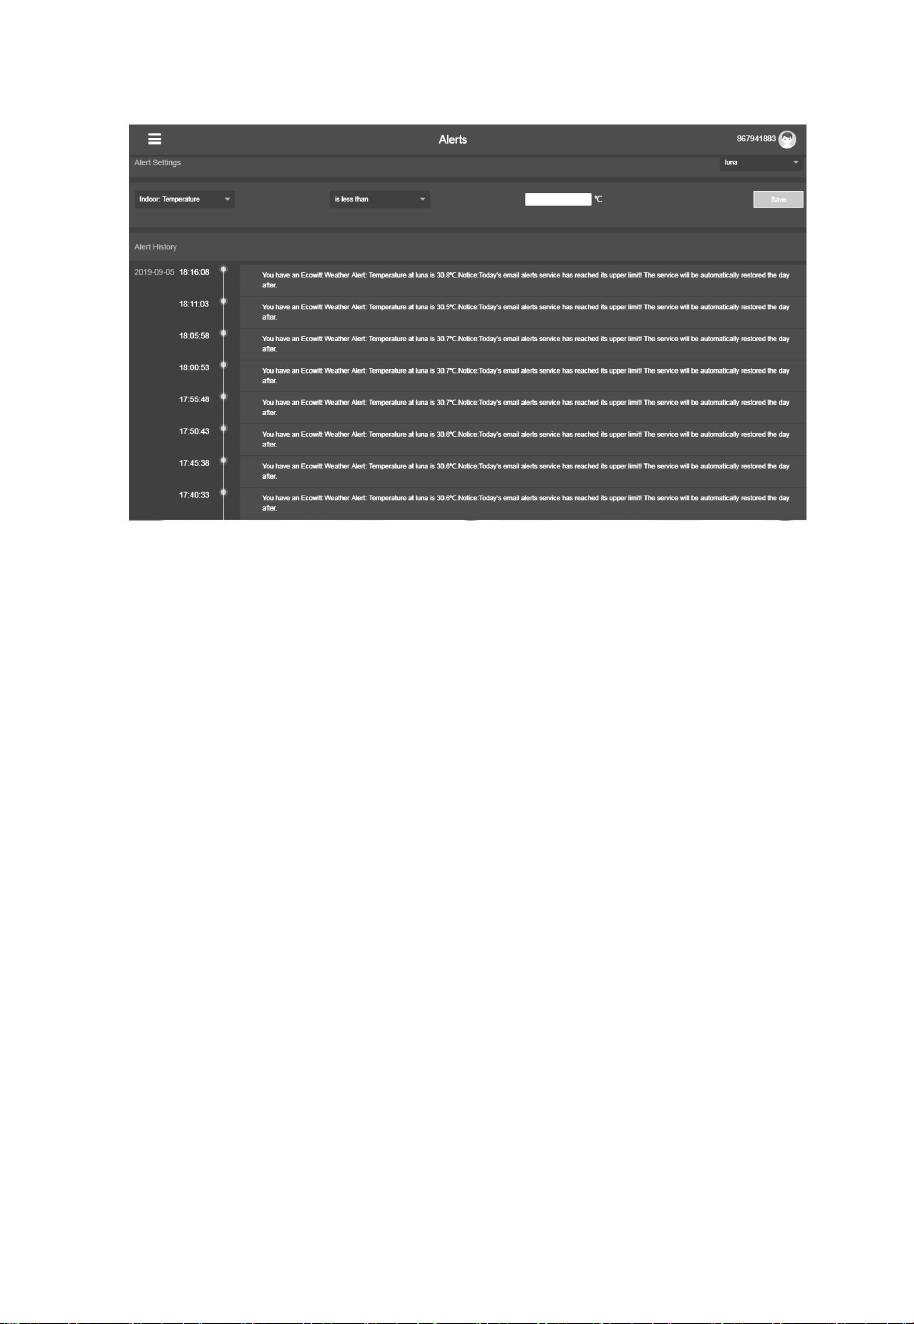
Email Alerts
Note:
You may add a shortcut of the ecowitt.net website on the home page of your
phone for easy access.
7.3 Weather Underground
If you are planning to use wunderground.com you must have an account and
register a (new) personal weather station. You may do so on the
Wunderground uploading page in the WS View PLUS or Ecowitt APP:
Press Register at Wunderground.com and finish the registration on the
page:
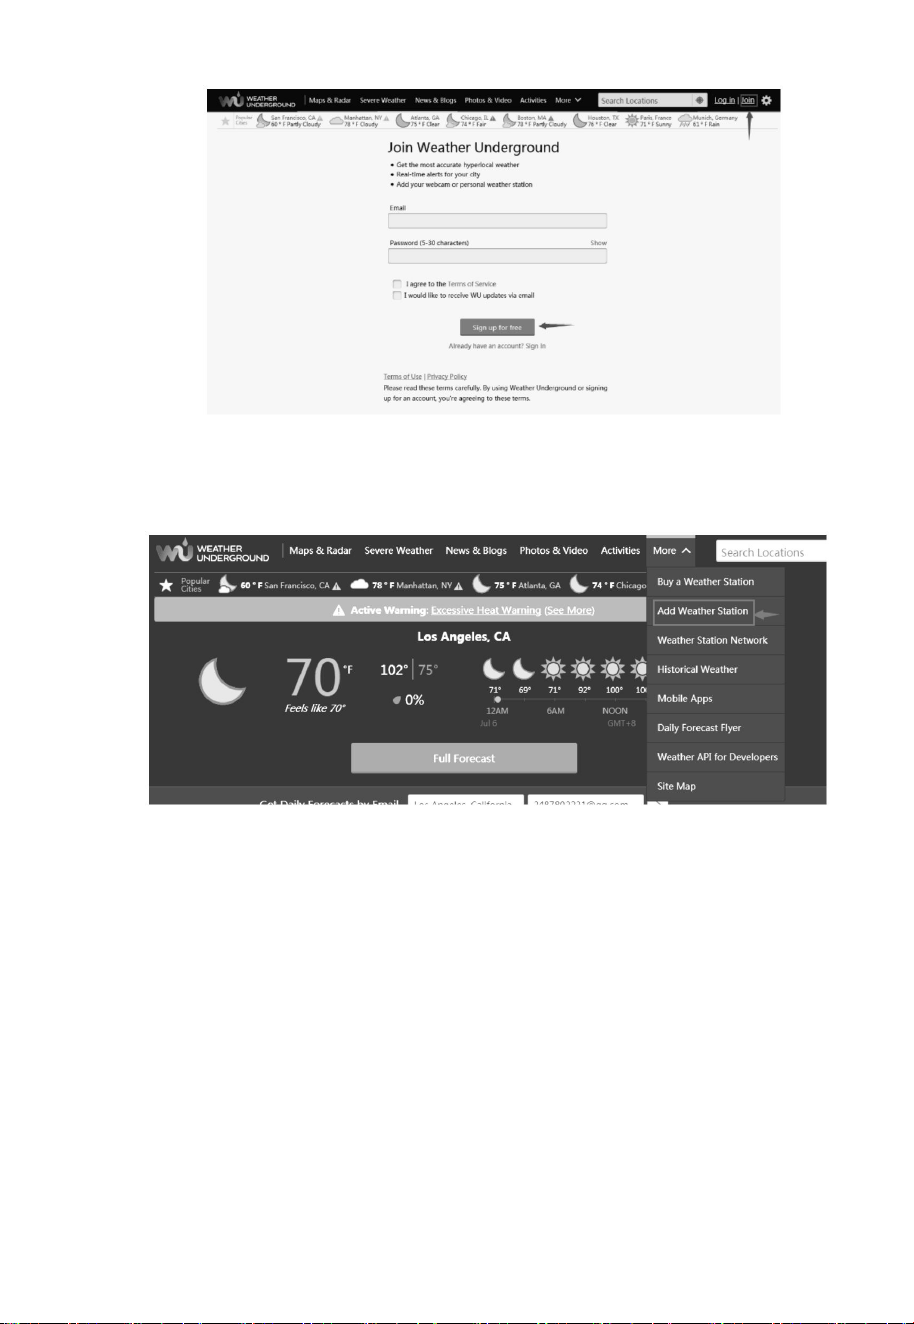
1. Visit Wunderground.com and click Join as the right top arrow
indicates and select the Sign up for free option.
59
2.
3. Click More and select Add Weather Station to register your
station
60
Click verify location and fill out the form.
Note
:
You may choose “other” when selecting device hardware.
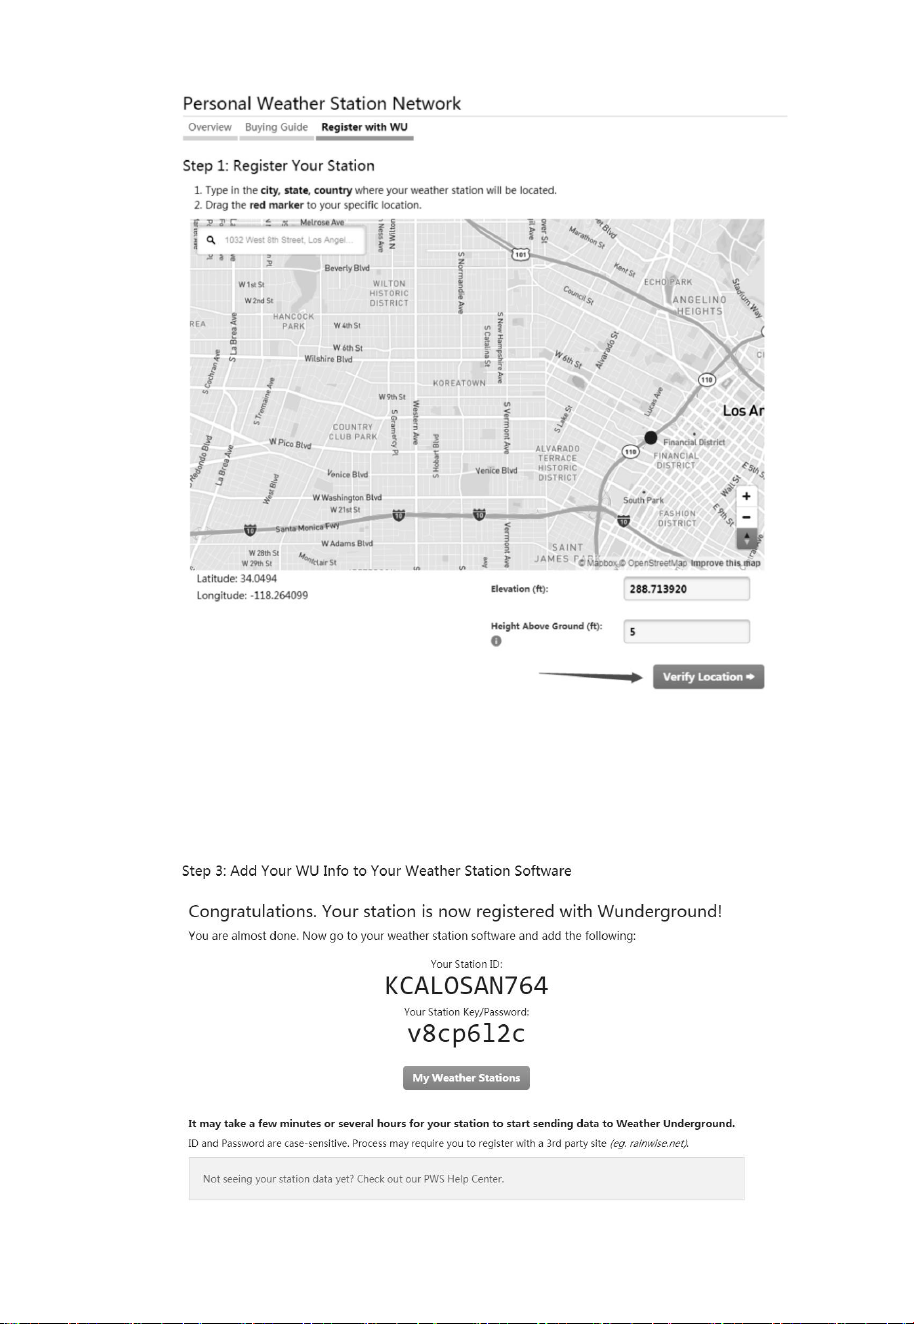
After submitting the form, you will see the following:
61
Take note of the PWS identifier (ID) and the password that will be
generated for you.
Back to the app and input the Station ID and Key.
Press Save.
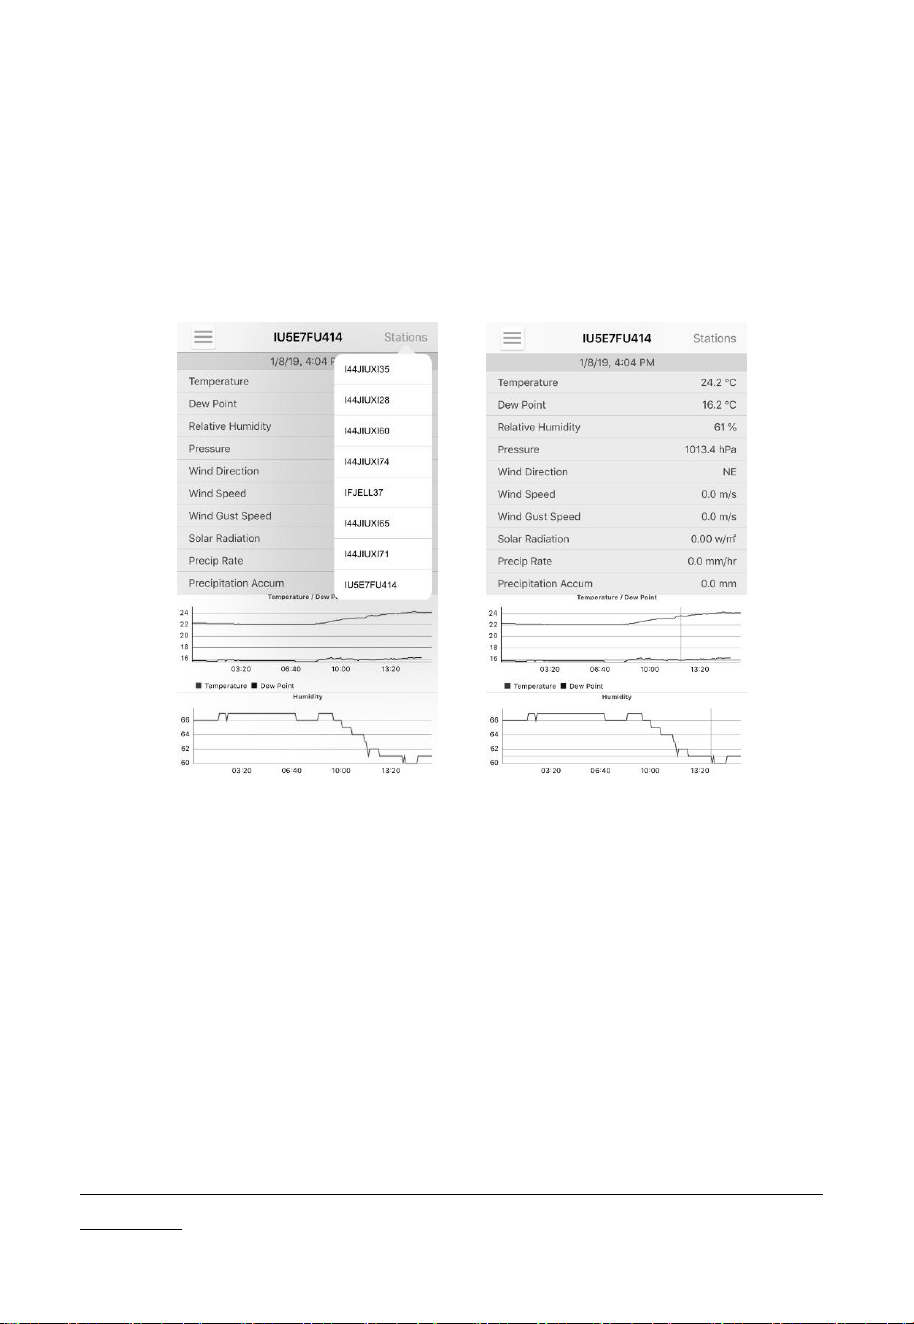
Back to the Menu page and select WU Dashboard(for Android version)
or select your station on the Stations(for iOS version) . You’ll see the
current WU data, including graphs on the screen within hours.
Figure 18
Note: WU Dashboard shows the data obtained from WU server. This
requires that your mobile device can reach the Internet and therefore this
is possible even when you are not on your home Wi-Fi network, such as
when using cellular data.
7.4 Viewing data on wunderground.com
You can also observe your weather station’s data by using the
wunderground.com web site. You will use a URL like this one, where your
station ID replaces the text “STATIONID”.
http://www.wunderground.com/personal-weather-station/dashboard?ID=ST
ATIONID
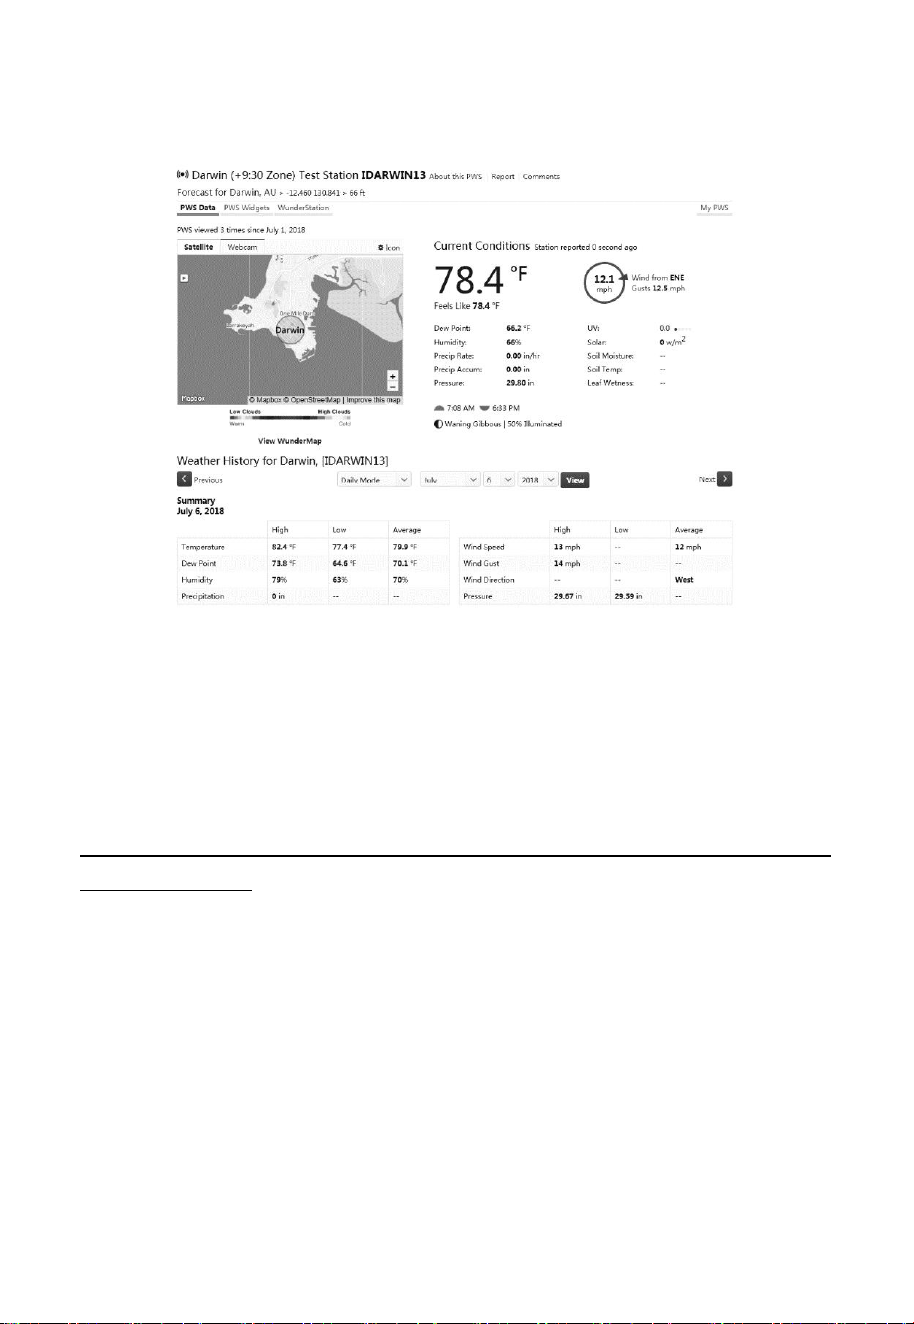
62
It will show a page such as this, where you can look at today’s data and
historical data as well.
There are also some very useful mobile apps. The URLs provided here go to
the Web version of the application pages. You can also find them directly
from the iOS or Google Play stores:
WunderStation: iPad application for viewing your station’s data and
graphs:
https://itunes.apple.com/us/app/wunderstation-weather-from-your-neighborh
ood/id906099986
65
7.5 Device list
When on WU Dashboard screen, you can press the “Menu” button (upper
right) and select Device List to view all your devices.
You can press your device to view or modify the settings.
Figure 19
Note: This function requires that your phone and the console is using the
same network.
7.6 Manage Wunderground
You can add or delete WU Station ID by selecting “Manage
Wunderground”on the submenu:
66
Figure 20
7.7 Unit Settings
You can set your desired display units by selecting “Unit Settings” on the
submenu:
Figure 21

67
7.8 Manage Ecowitt
Once you created your ecowitt account successful on the
WS View PLUS or Ecowitt APP, you may select “Manage Ecowitt” on the
submenu to manage your device.
You may view your weather station data by pressing your device on this
screen:
68
69
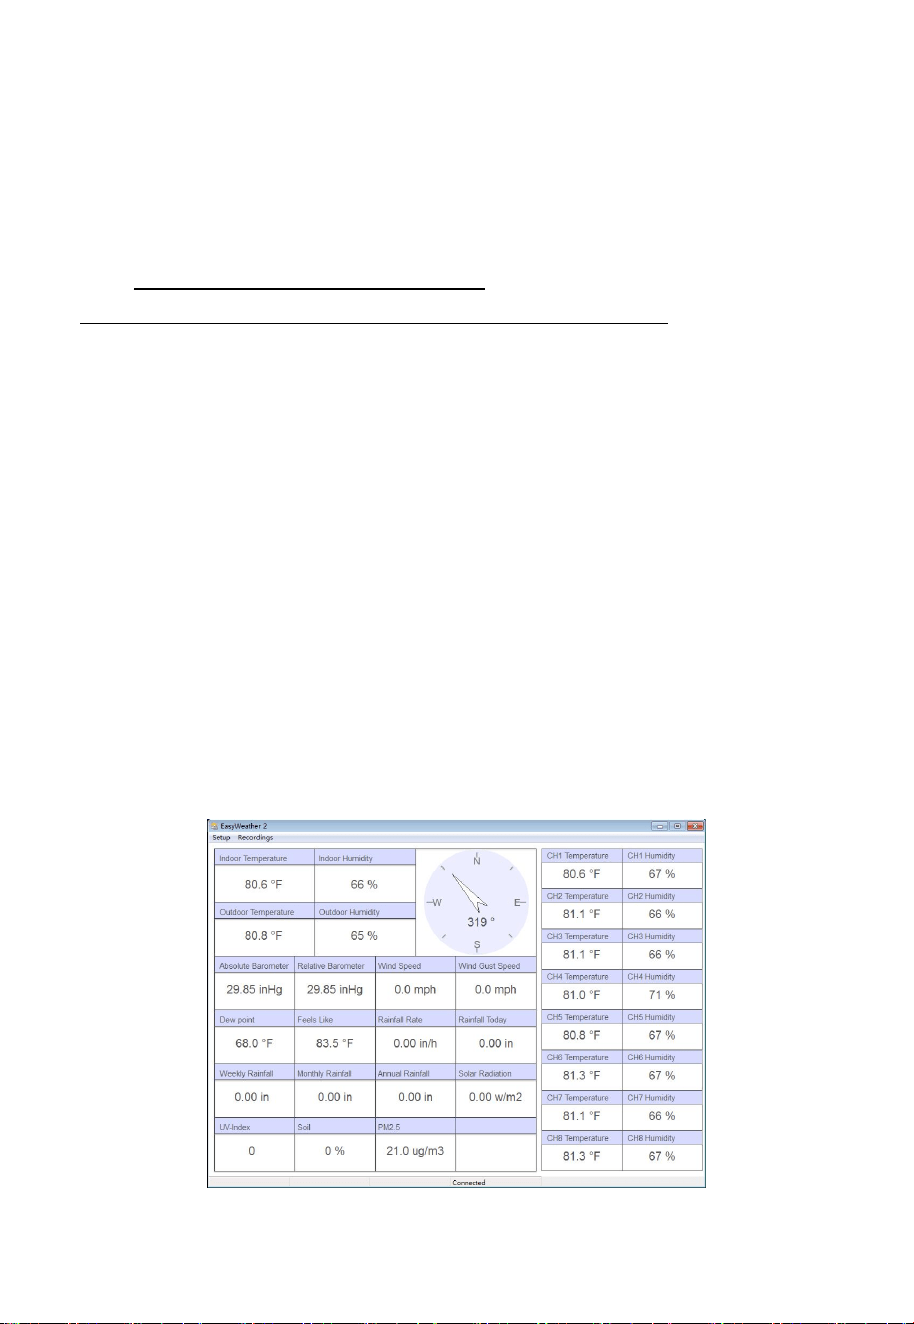
8 PC Software Operation
Software to monitor your weather station or set values is available for your
computer or laptop. The following operating systems are supported:
Windows version XP, Vista, 7, 8 or 10. You may download the software
from http://www.ecowitt.com/manual/ or
http://download.ecowitt.net/down/softwave?n=EasyWeather2
8.1 Installation and configuration
After downloading, install the software by decompressing the archive named
“EasyWeather2 Setup.” You will then have a file called “EasyWeather2
setup” located inside a folder with that same name. Double click it to start
installation.
8.1.1 Connect the display console to the PC
The console must be connected to the PC using the USB cable. After
connecting the USB cable to the console port and then the PC, launch the
EaseWeather2 program from your “Start” menu.
If your console is correctly connected the program will start communicating
with it and display a screen like shown below.
Figure 22: EasyWeather2 main screen
70
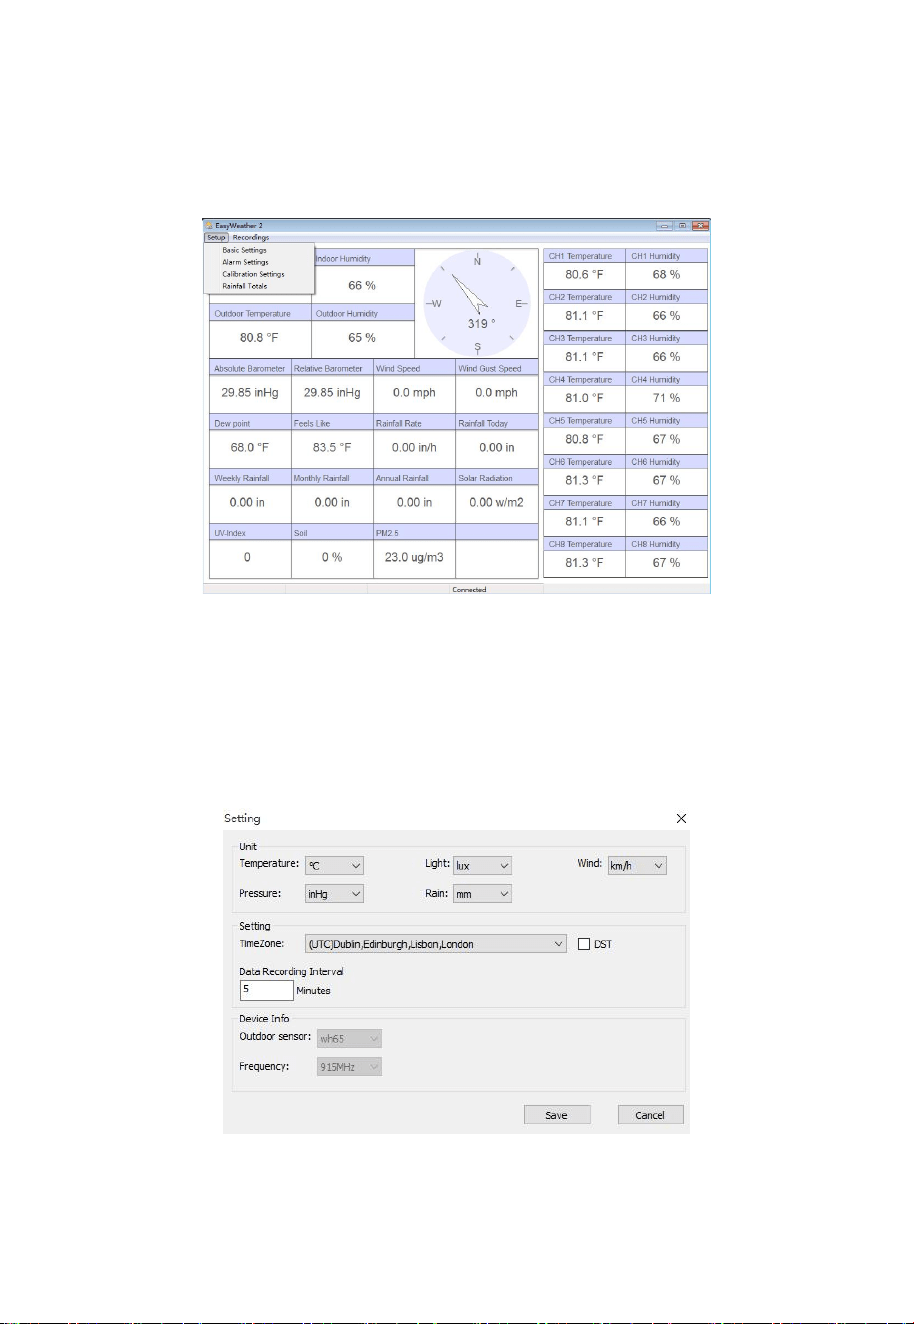
8.2 Setup Functions
Setup functions are reached via the “Setup” menu. Each of the different
setup categories will be discussed in the next sections.
Figure 23: Setup menu
8.2.1 Basic Settings
Basic settings can be used to change display units, time zone and daylight
savings time handling, and data logger interval.
Figure 24: Basic Settings screen
71
Changing settings on this screen will cause the corresponding change to be
made on the console as well. Thus, this screen controls both the display
format on the PC screen as well as the console.
The data logger interval determines how often current sensor values are
written to the SD card inserted in the console (if you indeed have inserted a
card there). This setting can only be changed through the PC software.
Recordings are made as lines in CSV (Comma Separated Values) files
stored on the SD card. The console will switch to new files every so often so
that files do not grow beyond a reasonable size.
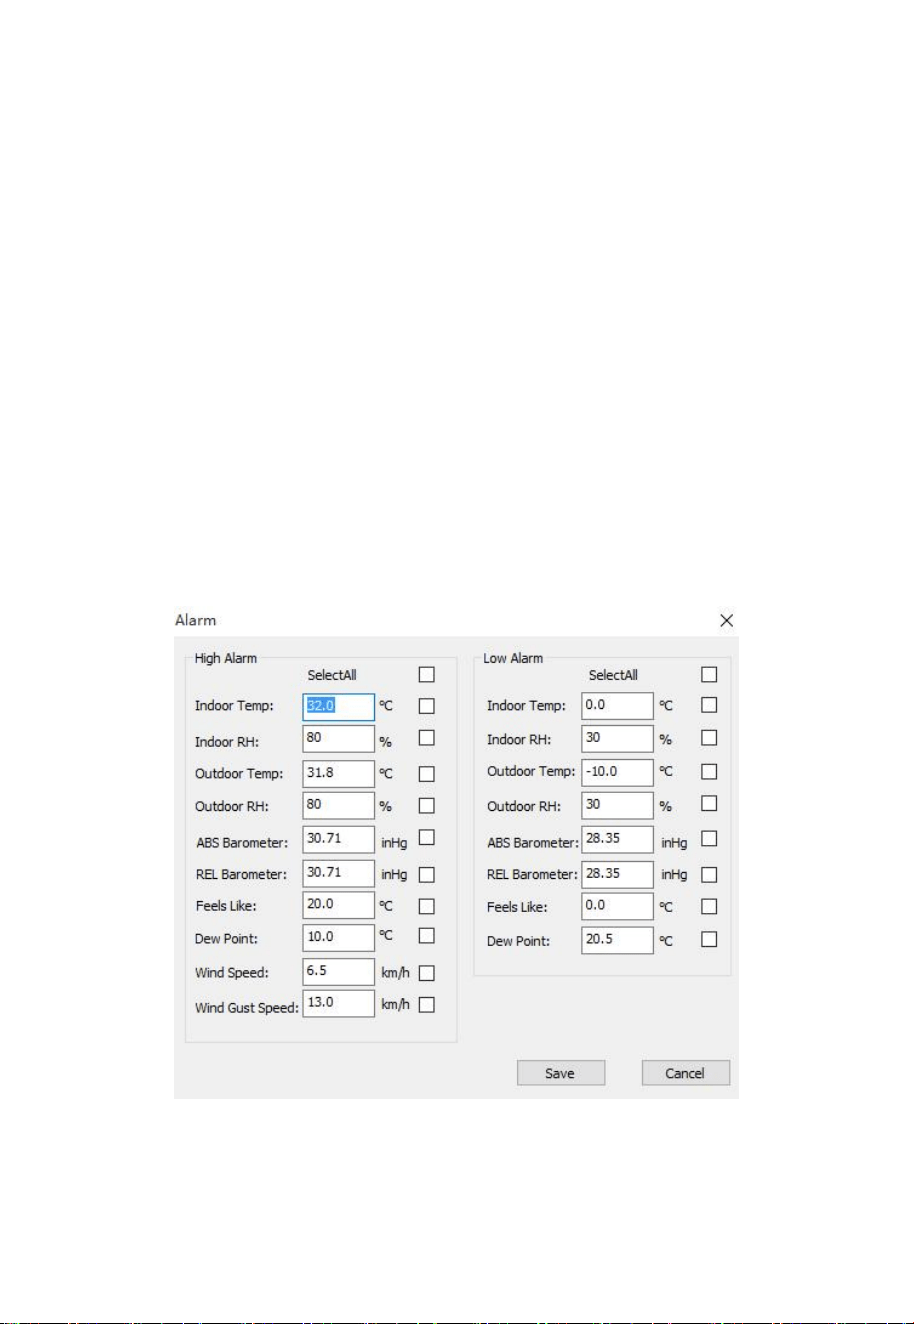
8.2.2 Alarm Settings
Alarm Settings can be used to change thresholds for alarm activation, or to
enable or disable individual alarms. These values are stored inside the
console and can be changed here, or on the console (Section 5.4).
Figure 25: Alarm Settings screen
72
Any changes you make here will be reflected inside the console. Change the
value(s) in the respective input fields and use the checkbox(es) to enable or
disable specific alarms.
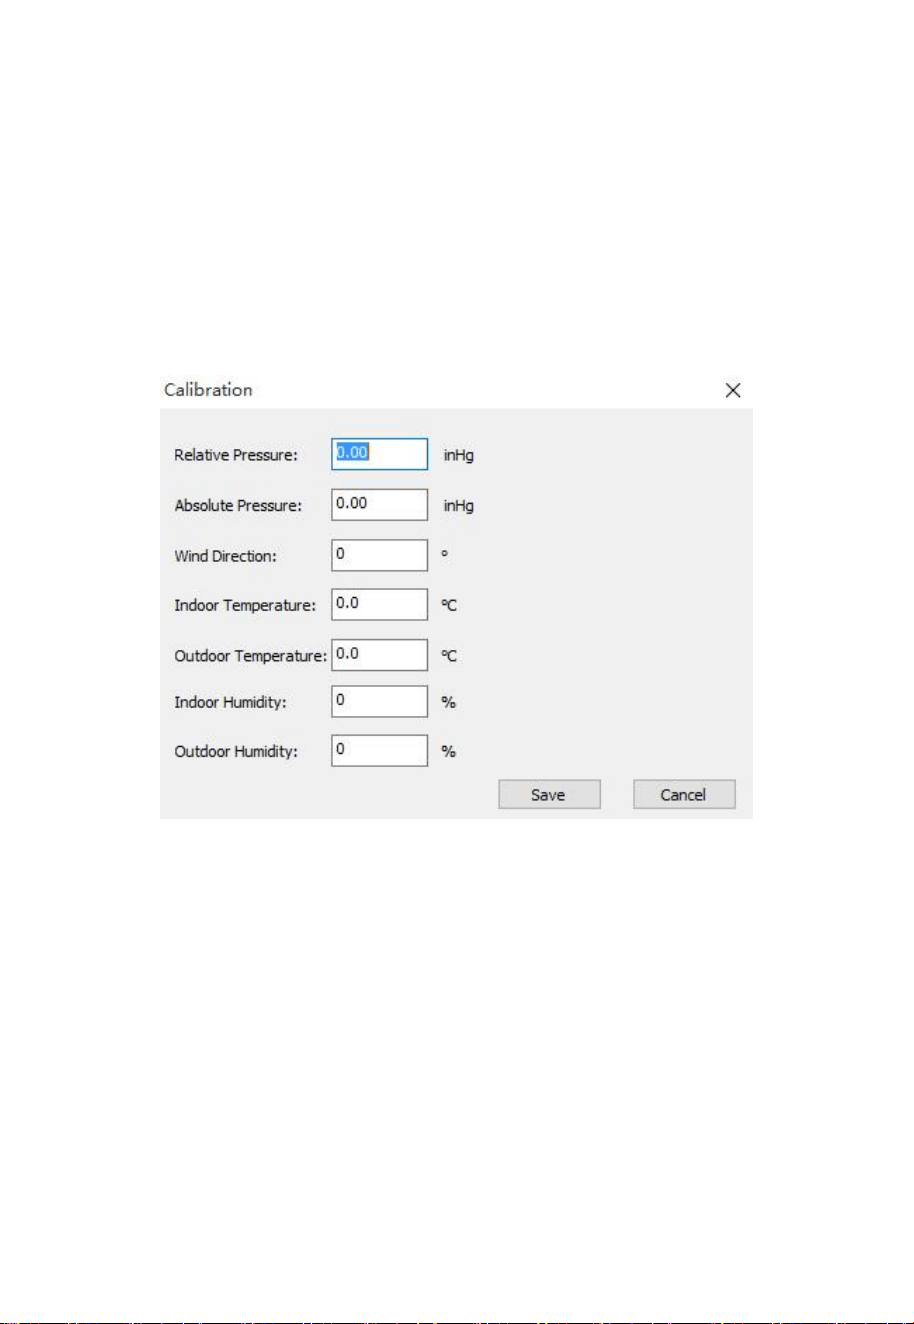
8.2.3 Calibration Settings
Calibration Settings allow you to change calibration settings for the sensors.
These are the same settings that you can also change in the console itself
(see section 5.2.3).
Figure 26: Calibration Settings screen
Any changes you make here will be reflected in the console. Note that when
using the console, you will generally change the value displayed using “+”,
or “-” buttons, but here you will instead edit the amount of change that you
“dialed in” on the console. For example, if you changed a displayed
temperature by pressing the “+” button three times, you effectively caused
0.3 to be added (3 times 0.1). So here, you will see a value of 0.3.
The Absolute Pressure offset will be added to the value of the pressure
sensor in the console to determine the absolute pressure (ABS) that will be
displayed. The Relative Pressure offset will be added to the displayed
absolute pressure (ABS) to determine the displayed relative pressure (REL).
73
This offset typically corresponds to the elevation above sea level for your
weather station’s indoor sensor.
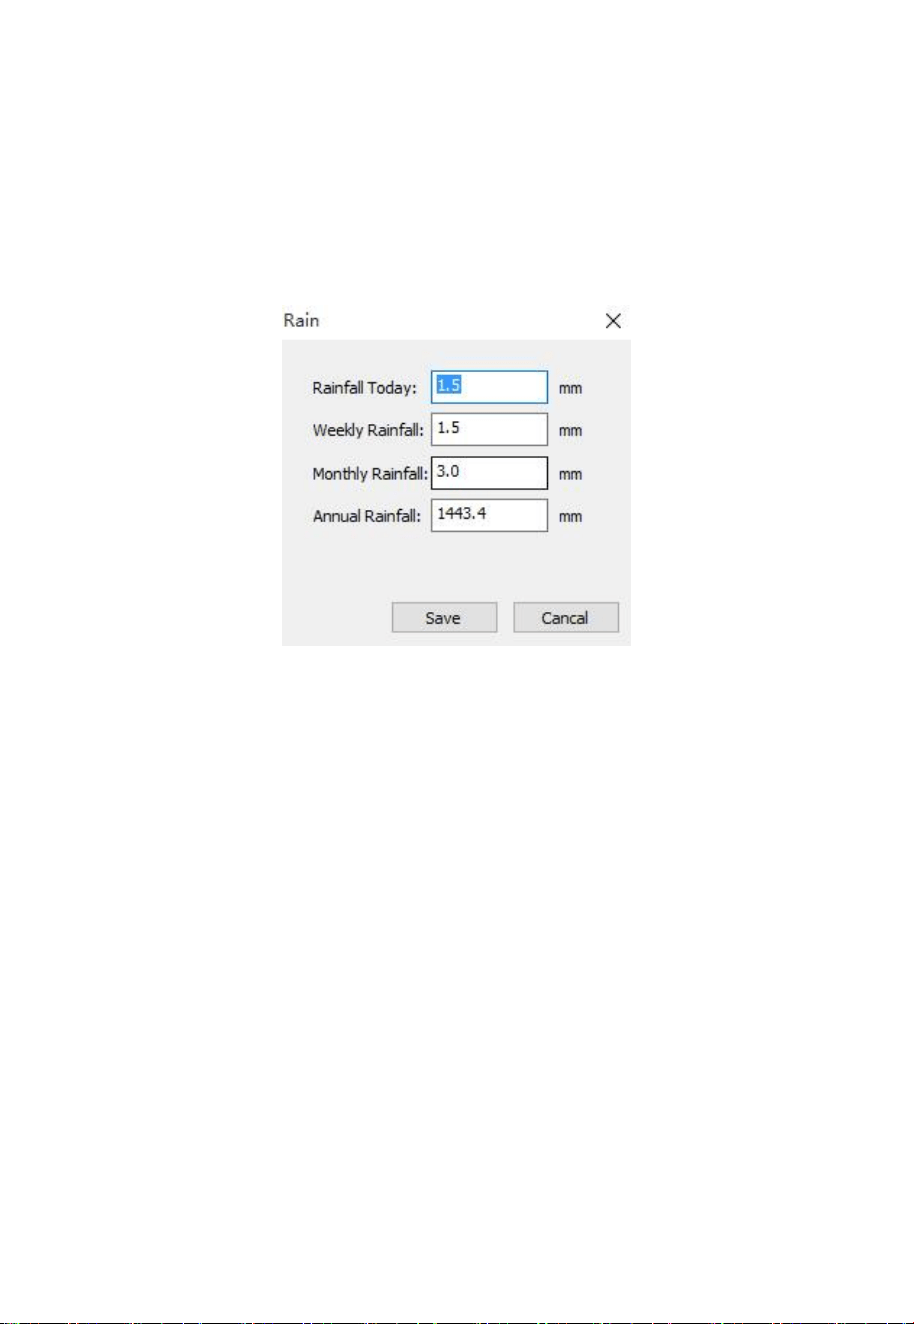
8.2.4 Rain Totals
The currently accumulated rain totals for different periods can be seen, and
changed, on this screen.
Figure 27: Rain Totals screen
Any changes you make here will be immediately reflected in the console.
8.3 Record and recording functions
You can access maximum and minimum temperatures as recorded in the
console, or data in accumulated historical records (stored on the SD card, if
you have one inserted) through the “Record” menu.
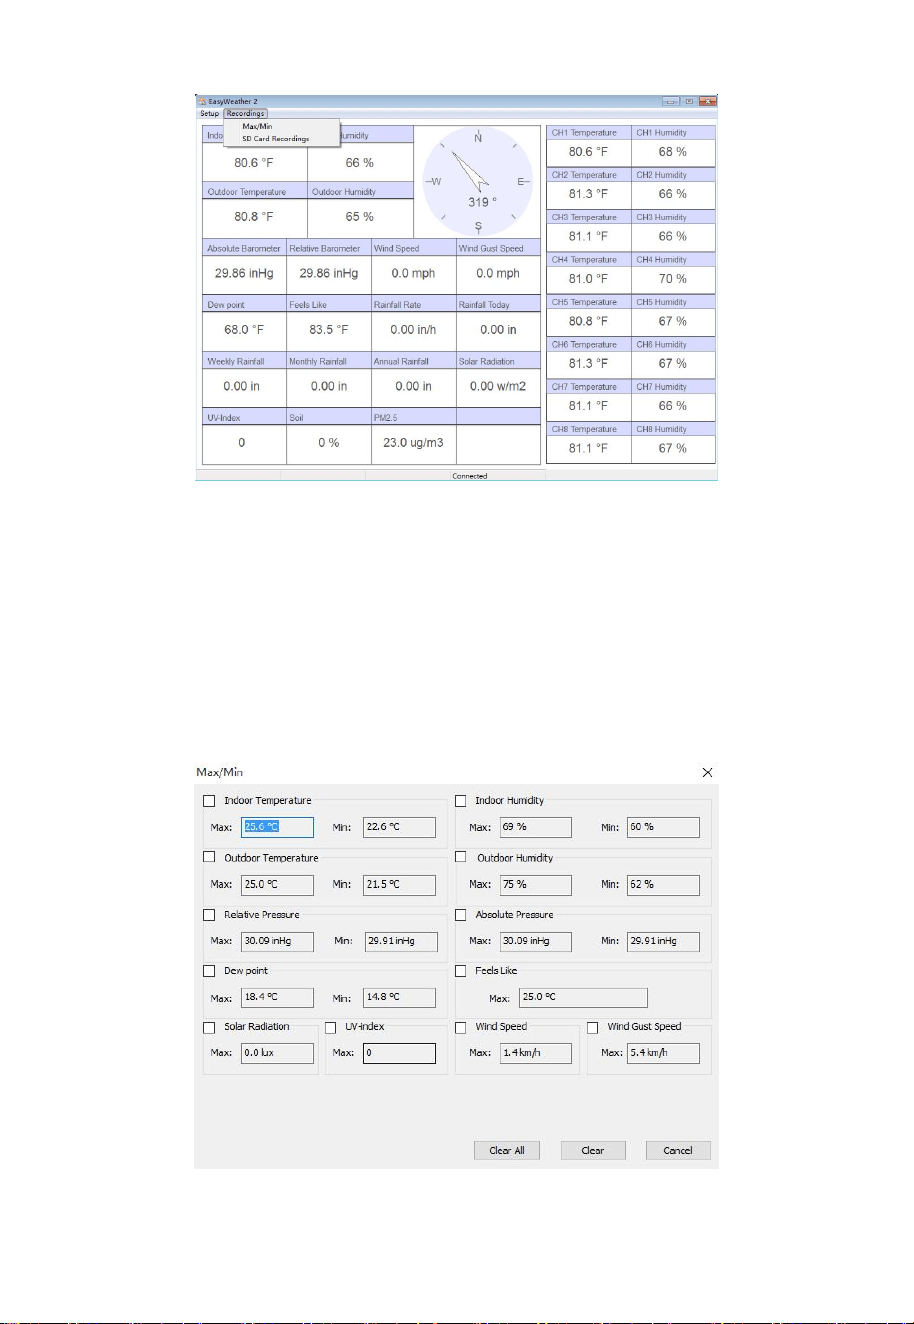
74
Figure 28: Record menu
8.3.1 Max/Min
The Max/Min menu will bring up a screen that displays maximum and
minimum recorded values for the various sensors. These extremes are across
the entire usage lifetime of the weather station, or since the last reset,
whichever is shorter.
Figure 29: Max/Min screen
75
The screen also offers a “Clear” button. When pressed, all maximum and
minimum values will be “forgotten” and new maxima and minima will only
be collected from sensor data collected from this point forward.
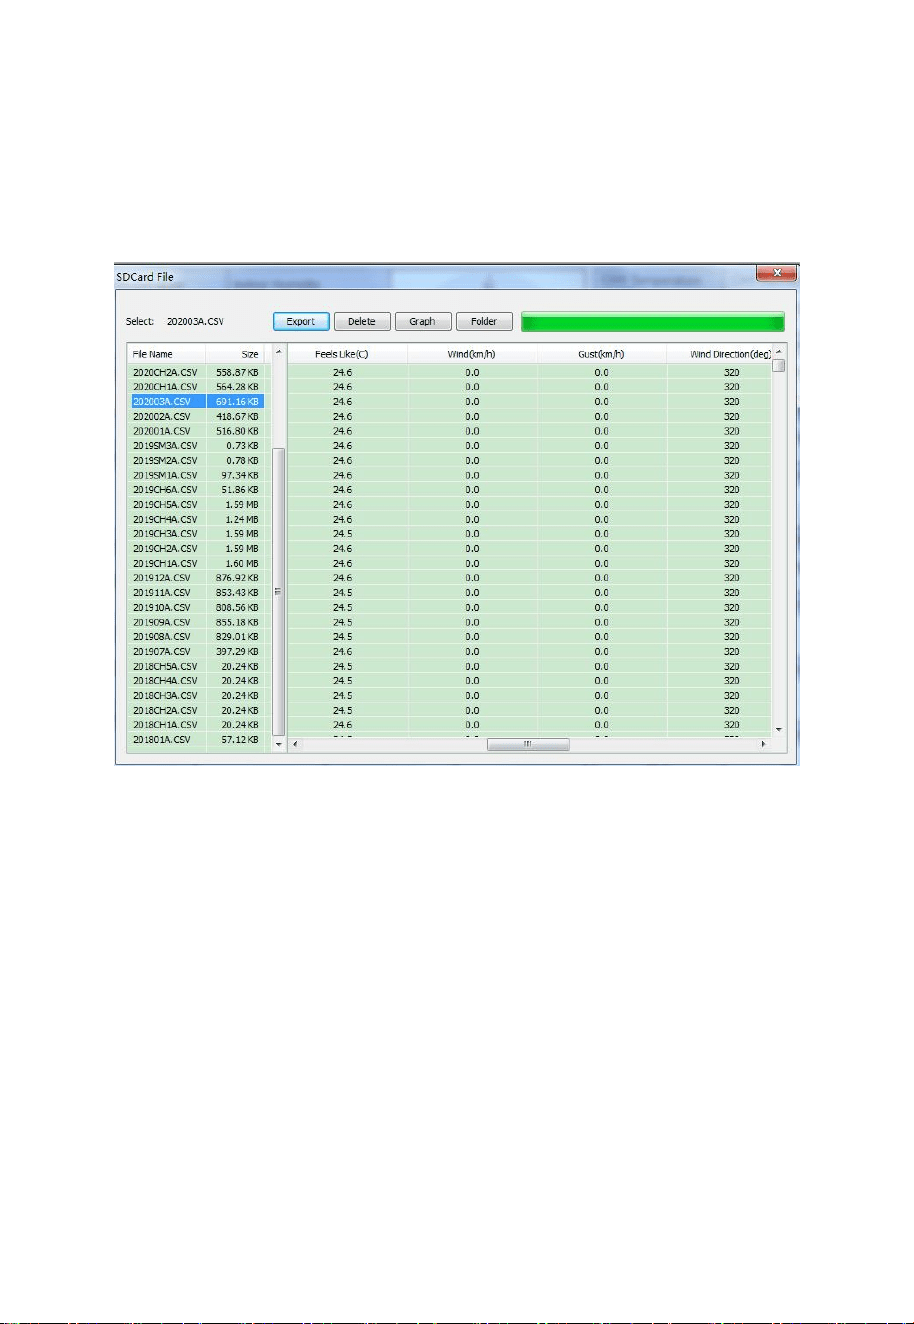
8.3.2 SDCard File
Figure 30: SDCard File screen
If you have an SD card installed, you may also access the data on the SD
card directly.
On the data screen you will see, in the left column, a list of files that contain
recorded data. Select the file you are interested in by clicking on it and then
pressing the “Export” button. If you wish to delete the file, press the “Delete”
button instead. Before really deleting the file, you will be asked to confirm.
Selecting a file will show the data from the file in tabular format to the right
of the file name column. You can see a time stamp for each row, followed
by individual sensor values.
76
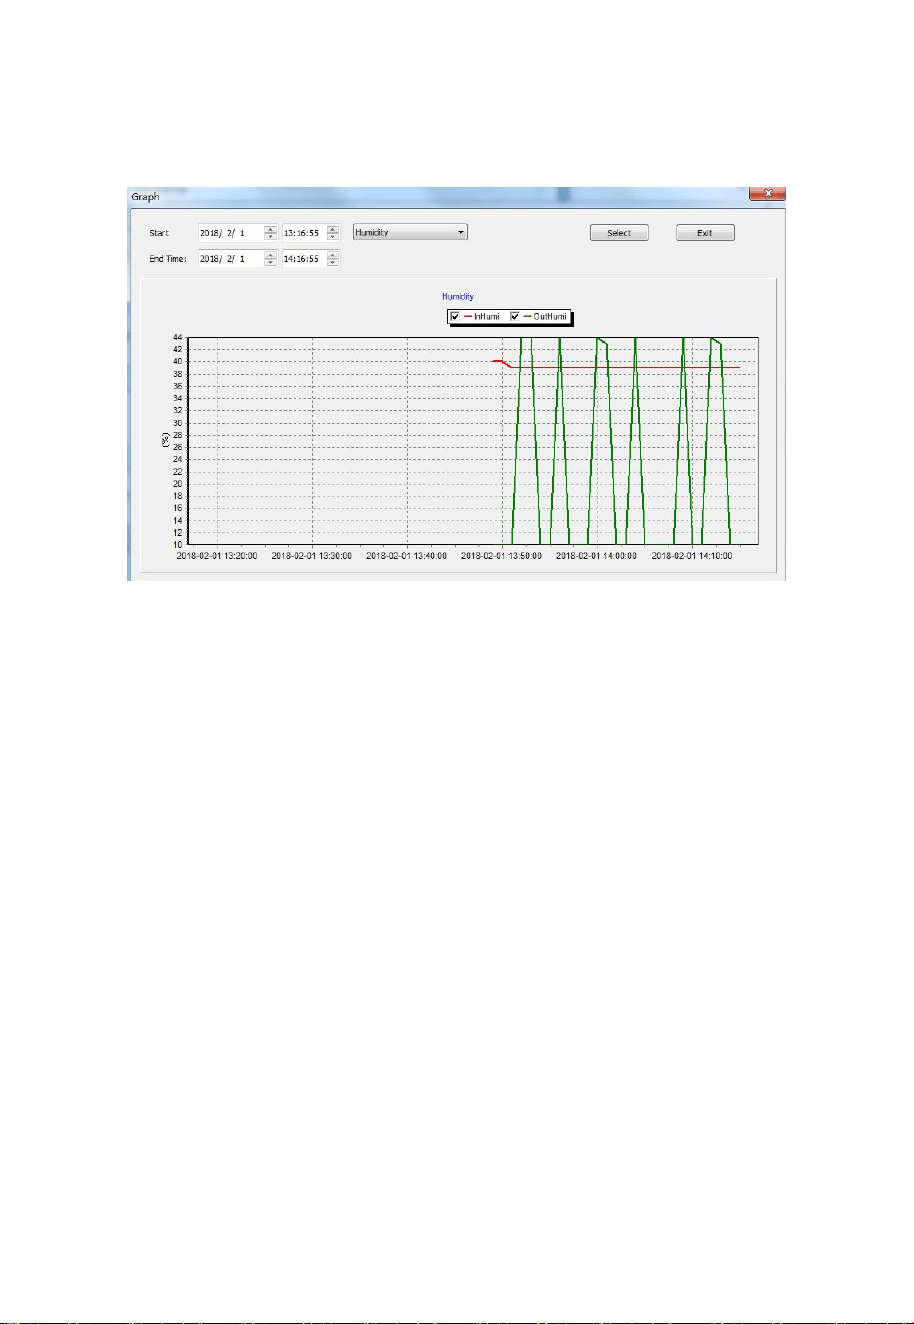
8.3.2.1 Graph
You can look at the data on the SDCard file(s) in the form of a graph.
Figure 31: Graph screen
After displaying data from a particular file, you can press the “Graph”
button to see the data in graphical format. The Graph screen will come up,
but a graph will not yet be drawn. You first must select that time range in
“Start” and “End Time” and then press “Select”. You can also use the
pop-up menu to the right of start and end-time to determine what kind of
data will be graphed.
9 Maintenance
The following steps should be taken for proper maintenance of your station
Clean Rain Gauge
Check the rain gauge every 3 months. Rotate the funnel counter-clockwise
and lift it up. Clean the funnel and bucket with a damp cloth to remove any
dirt, debris and insects. Spray the array lightly with insecticide, if there’s a
bug infestation.
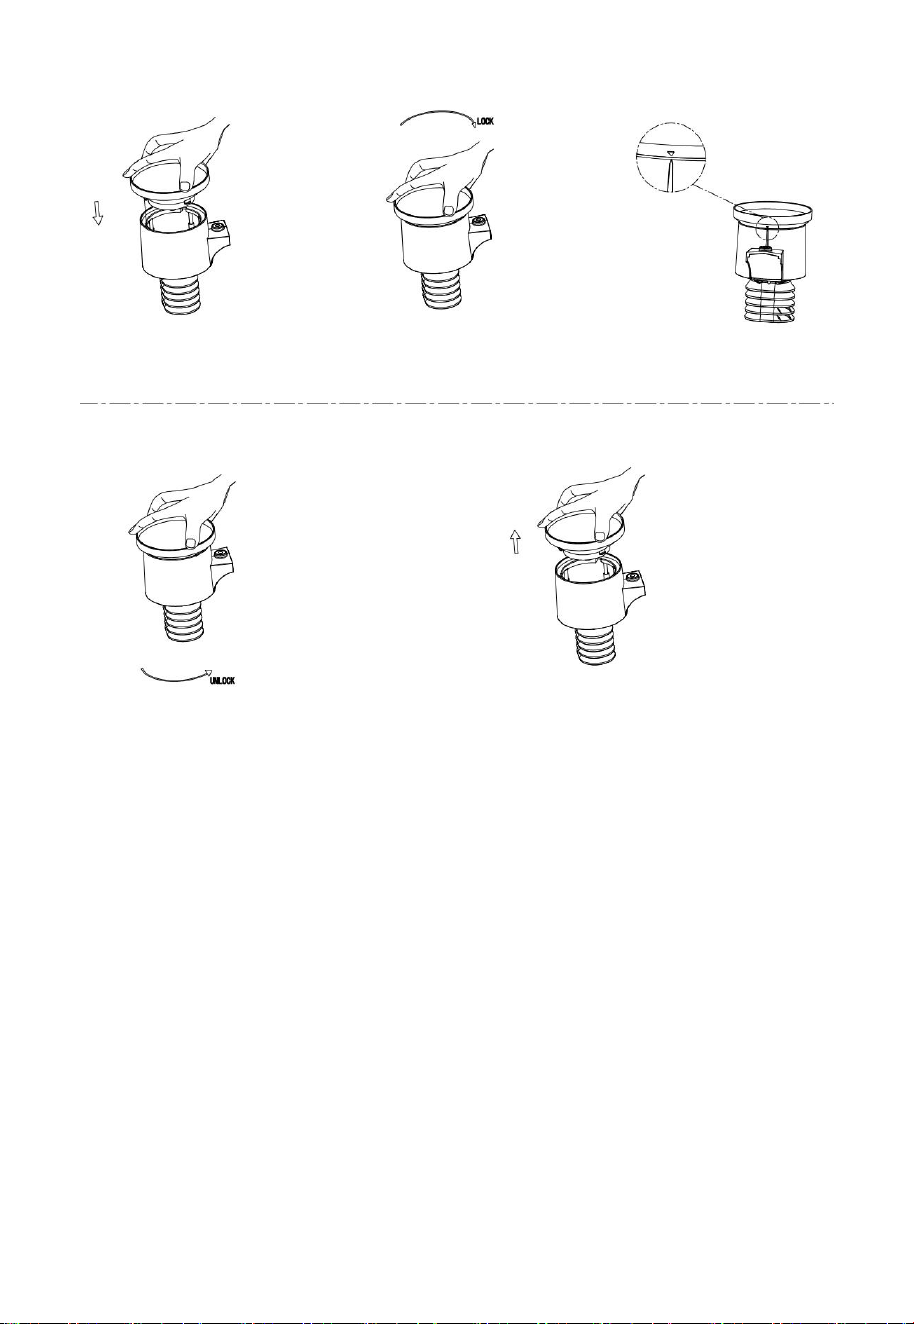
77
Figure 32: Rain gauge installation & maintenance
Clean Solar Radiation Sensor and Solar Panel
The solar radiation sensor and solar panel of the outdoor sensor array
need to be cleaned with a non-abrasive slightly damp cloth every 3
months.
Replacing Batteries Regularly
Batteries of the outdoor sensor array need to be replaced every 1-2
years for environmental friendly. In serious environments, check the
batteries every 3 months and apply a corrosion preventing compound
(not included) on the battery terminals for protection.
To Prevent Snow build up
In snowy days, use anti-icing silicon spray on the top of the weather
station to prevent snow build up.

78
10 Troubleshooting Guide
Look through the following table and locate an issue or problem you are
experiencing in the left column and read possible solutions in the right
column.
Problem
Solution
Outdoor sensor
not reporting to
console
Dashes (--) on
the display
console
Check that the outdoor transmission LED on the bottom
is flashing approximately every 16 seconds. See Figure 4
item 9.
If the batteries were recently (re)placed, check correct
polarity was used and/or reseat the batteries. If the
batteries are old, replace them.
If the LED is now flashing every 16 seconds, proceed to
the next step. If it is not flashing and you have repeated
battery checks and placement, you may have a defective
unit.
Make sure you have fresh batteries in the display console.
If the batteries may have been changed in the remote
and/or the console, and the console has not been reset, the
solution may be as simple as powering cycling the
console: remove both batteries and external adapter for
about 10 seconds and reconnect.
If you still have problems, bring the outdoor sensor to a
location about 10 ft. away from the console for testing.
Power cycle the console as described above.
Do not touch any buttons for several minutes to allow the
console to “discover” the outdoor sensor. During this
process the remote sensor search icon will flash on the
display. Wait several minutes for this icon to turn off.
If the search icon turns off and the outdoor temperature
and humidity are still showing dashes (--), the remote
sensor is defective. If the sensor properly syncs up,
proceed to the next step “Intermittent problems with
outdoor sensor reception on console.”

79
Problem
Solution
Intermittent
problems with
outdoor sensor
reception on
console
There may be a temporary loss of communication due to
signal quality issues caused by electrical interference or
other location related factors (obstacles along line of
sight).
To troubleshoot, install a fresh set of batteries in the
remote sensor array and console. For cold weather
environments, install lithium batteries.
If problems remain with fresh batteries, ensure power
adapter is not too close to the console, and the console is
not close to other electrical noise generating devices such
as TVs, monitors, computers and transmitting devices.
If you still have intermittent problems move sensor and
console closer together, but not closer than 5 ft. Also
check that there are no metal barriers like aluminum
siding, or metal wall framing, along the line of sight
between sensor and console. Relocate sensor and console
as necessary to avoid obstacles.
Depending on natural barriers you may also have to move
the outdoor sensor higher and/or closer.
Indoor
temperature
sensor reads too
high in the day
time, and/or
night time
Make sure the thermo-hygrometer is mounted in an
indoor area where it will not be exposed to direct
sunlight, our radiative heating, or convective heating.
Indoor and
Outdoor
Temperature do
not agree during
indoor testing
During installation testing it is useful to test with both
console and outdoor unit in the same room. Allow up to
one hour for the sensors to stabilize and adjust to room
temperature. The indoor and outdoor temperature sensors
should agree within 4 °F (the sensor accuracy is ± 2 °F).
If these values still disagree, use calibration offsets for
one or both sensors (see section 5.3.1) to adjust to a
known good reference temperature.

80
Problem
Solution
Indoor and
Outdoor
Humidity do not
agree during
indoor testing
The procedure here is that same as for outdoor/indoor
temperature. The sensors should agree within 10 % (the
sensor accuracy is ± 5 %)
If these values still disagree, use calibration offsets for
one or both sensors (see section 5.3) to adjust to a known
good reference humidity.
Relative
pressure does
not agree with
official
reporting station
Relative pressure refers to sea-level equivalent
temperature and should generally agree closely with the
official station. If there is a disagreement, make sure you
are not looking at absolute pressure, in particular if your
station is not near sea level. Also check at different times
due to occasional delays in updates to the official station.
Redo the pressure calibration procedure described in
section 5.3.1.
The barometer is only accurate to ± 0.09 inHg (3 hPa)
within the following relative pressure range: 20.67 to
32.50 inHg (700 – 1,100 hPa), which corresponds to an
altitude of 9,000 ft. (2,750 m) down to 2,500 ft. (750 m)
below sea level. At higher altitudes, you should expect a
possible lesser accuracy and non-linearity effects in the
error (the calibration offset only allows for a partially
linear correction).
Time is
incorrect
Make sure your time zone and daylight savings time
setting is correct (even when connected to the Internet via
Wi-Fi this is needed). If not connected to the Internet via
Wi-Fi, you may also have to manually set the correct
time.
Display console
brightness is
weak
Adjust brightness using setup functions, or place console
in a darker location.
Data not
reporting to
Wunderground.
com
Confirm your station ID is correct. The station ID is all
caps, and the most common issue is substituting a capital
letter O for a 0 (zero) or vice versa. Please note the digit 0
can only occur in the last part of the station ID (which is a
station number in a city). Example, KAZPHOEN11, not
KAZPH0EN11
Confirm that your password (also called: key) is correct.
It is the password wunderground.com generated for your
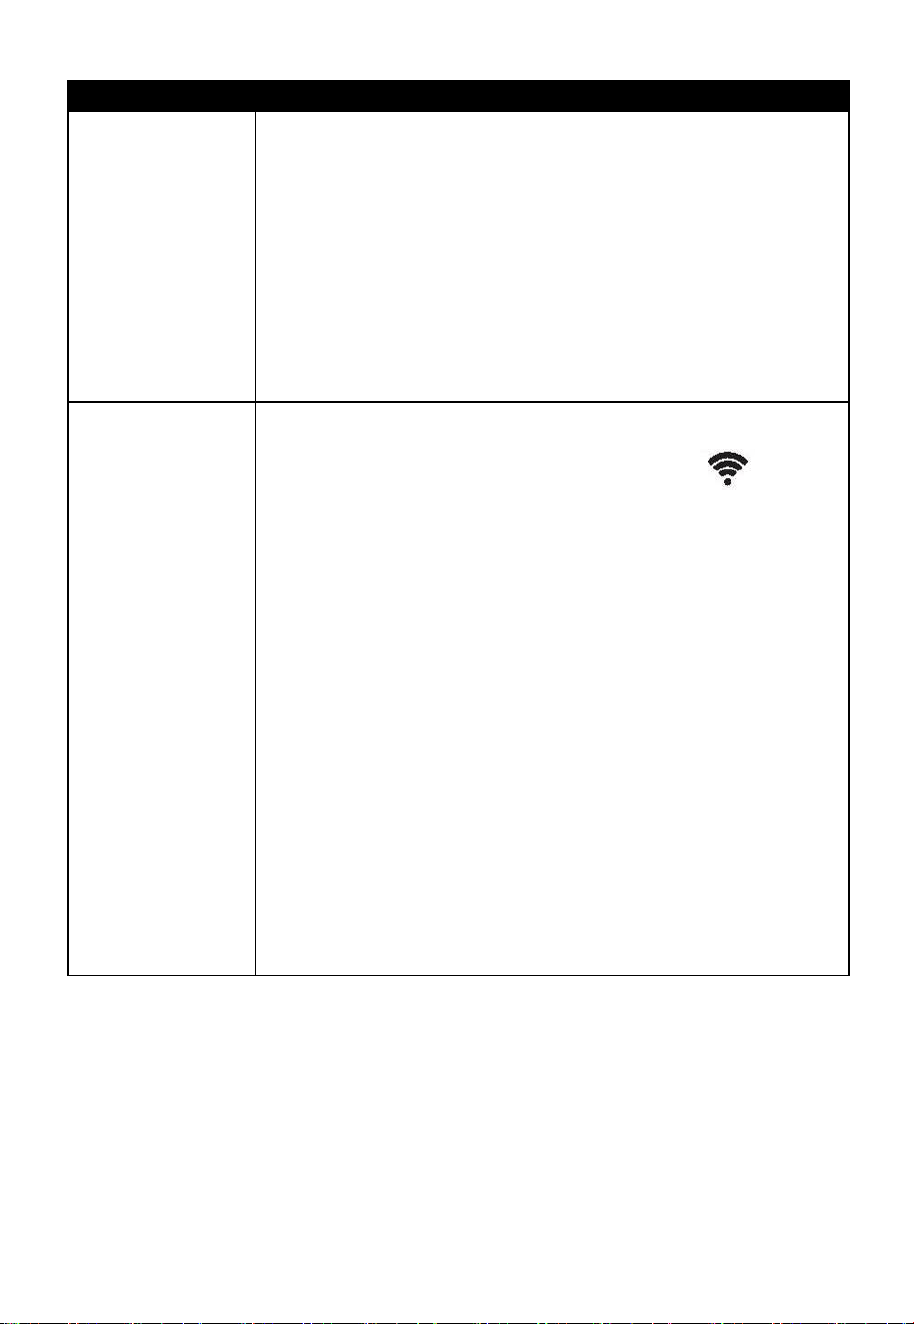
81
Problem
Solution
station ID. You can also verify it by logging in to
wunderground.com and looking it up under “My PWS.”
Make sure the date, time and time zone is correct on the
console. If it is not incorrect, you may be reporting data
for a point in the past or future and you may not see it
where you expect it.
Check your router firewall settings. The console sends
data via port 80. If you can access other web sites using
“http” (not to be confused with “https”) this setting will
be OK.
No Wi-Fi
connection
Check for Wi-Fi symbol on the display. If wireless
connectivity is operational, the Wi-Fi icon will be
displayed in the time segment on the console.
If the symbol is not displayed, but you do remember
configuring it successfully before, check that the console
external power adapter is plugged in and functional.
Wi-Fi use demand more energy than batteries alone can
provide.
If you have never been able to configure Wi-Fi to a
working state, make sure your Wi-Fi supports 2.4 GHz
signals (801 type B or G, or N). The console does not
support Wi-Fi that uses the 5 GHz spectrum.
Make sure you configured the correct SSID and
password. Repeat the procedure if necessary to verify.
The console does not support so-called “captive Wi-Fi”
networks. These are typically “guest” type networks
where users have to agree to terms and conditions before
being connected.

82
11 Glossary of Common Terms
TERM
DESCRIPTION
ABSOLUTE AIR PRESSURE
ABSOLUTE BAROMETRIC
PRESSURE
Absolute air pressure is the air pressure
registered on a barometer without regard to
altitude.
BAROMETER
A barometer is a device that measures the
pressure of the air pushing on it—this
measurement is called the barometric
pressure. We don’t actually feel the
barometric pressure because the air pressure
is pushing equally in every direction.
BEAUFORT (Bft)
An indicator of wind force strength (not
speed) as it would act on a ship’s sails. Still
commonly in used in some locales to
indicate wind force.
DEW POINT
The temperature to which air must be cooled
to become saturated with water vapor. When
further cooled, the airborne water vapor will
condense to form liquid water (dew), or
frost if below freezing.
HEAT INDEX
The heat index (HI) or humiture is an index
that combines air temperature and relative
humidity, in shaded areas, as an attempt to
determine the human-perceived equivalent
temperature, as how hot it would feel if the
humidity were some other value in the
shade.
HECTOPASCALS (hPa)
This is an international standard (SI system)
for measuring air pressure. It used to be
referred to as milli-bar (mb) and sometimes
still is. They are equivalent.
HYGROMETER
An instrument that measure relative
humidity of the air. This is expressed as a
percentage between 0% and 100%.

83
TERM
DESCRIPTION
INCHES OF MERCURY
(inHg)
This is the common unit of measurement for
air pressure in the United States. It refers to
the length of a standard column of mercury
(a liquid metal) that can be pushed up by the
ambient air pressure. Standard pressure is
approximately 29.92 inHg
KNOTS (kn)
One knot is equivalent to one nautical mile
and is sometimes used to indicate wind
speed.
LCD
An acronym for “Liquid Crystal Display.”
This is a common type of display screen
used in televisions, computers, watches, and
digital clocks.
LUX (lx)
The unit of illuminance (a measure of the
intensity of illumination on a surface) as
used in the SI system.
MILLIBAR (mb)
See HECTOPASCALS.
MM OF MERCURY (mmHg)
This is similar to inches of mercury, except
expressed in millimeters. Standard pressure
is approximately 760 mmHg.
NIST
National Institute of Standards and
Technology. A United States institute that
keeps very accurate time using atomic
clocks and provides and internet-based
service to accurately set device clocks.
RELATIVE AIR PRESSURE
RELATIVE BAROMETRIC
PRESSURE
Relative air pressure is the absolute air
pressure compensated for the altitude of the
barometer. The result is what the air
pressure would be at sea level.
TFT
Thin-Film-Transistor, a type of LCD screen.

84
TERM
DESCRIPTION
ULTRA VIOLET INDEX
The ultraviolet index or UV-Index (UVI) is
an international standard measurement of
the strength of sunburn-producing
ultraviolet (UV) radiation at a particular
place and time. The purpose of the UV
Index is to help people effectively protect
themselves from UV radiation. The UV
Index is a linear scale, with higher values
representing a greater risk of sunburn
(which is correlated with other health risks)
due to UV exposure. An index of 0
corresponds to zero UV radiation, as is
essentially the case at night. An index of 10
corresponds roughly to midday summer
sunlight with a clear sky when the UV Index
was originally designed, but values above
10 are sometimes possible. Levels above 8
are considered “very high” and above 11 are
considered “extreme.”
WIND CHILL
Wind chill (popularly wind chill factor) is
the lowering of body temperature due to the
passing-flow of lower-temperature air. In
other words, the air “feels” colder than it is
because of the chilling effect of the wind on
the skin.
Table 5: Glossary of terms
85
12 Specifications
Note: Out of range values will be displayed using “---”:
Outdoor sensor
Specification
Transmission distance in open
field
100 m (330 ft.)
RF Frequency
868 / 915 MHz depending on location
United States/Canada: 915 MHz
Temperature range
-40°C – 60°C (-40°F - 140°F)
Temperature accuracy
± 1°C, or ± 2°F
Temperature resolution
0.1°C, or 0.1°F
Humidity range
10% ~ 99%
Humidity accuracy
± 5%
Humidity resolution
1%
Rain volume display range
0 – 9999 mm, or 0 – 199.99 in
Rain volume accuracy
± 10%
Rain volume resolution
0.3 mm (for volume < 1,000 mm)
1 mm (for volume ≥ 1,000 mm), or
0.01 in (for volume < 100 in)
1 mm (for volume ≥ 100 in)
Wind speed range
0 – 50 m/s (0 ~ 100 mph)
Wind speed accuracy
± 1 m/s (speed < 5 m/s)
± 10% (speed ≥ 5 m/s), or
± 0.1 mph (speed < 11 mph)
± 10% (speed ≥ 11 mph)
UV-Index range
0 - 15
Light range
0 – 120 kLux
Light accuracy
± 15%
Sensor reporting interval
16 seconds
Table 6: Outdoor sensor specification
86
Indoor sensor
Specification
Temperature range
-10°C – 60°C (14°F - 140°F)
Temperature resolution
0.1°C, or 0.1°F
Humidity range
10% ~ 99%
Humidity resolution
1%
Barometric pressure range
300 – 1,100 hPa (8.85 – 32.5 inHg)
Barometric pressure accuracy
± 3 hPa in 700 – 1,100 hPa range
Barometric pressure resolution
0.1 hPa (0.01 inHg)
Sensor reporting interval
60 seconds
Alarm Duration
120 seconds
Table 7: Indoor sensor specification
Power
Specification
Base station/console
5V DC Adapter (included)
Indoor sensor
2 x AA 1.5 Alkaline batteries (not included)
Outdoor sensor
Solar panel (built-in)
Outdoor sensor (backup)
2 x AA 1.5V LR6 Alkaline (not included), or
2 x AA 1.5V Lithium battery (not included)
Table 8: Power specification
The primary power source for the outdoor sensor is the solar panel. When
available solar power (light over recent period) is insufficient, the batteries
will be used. In outdoor climates that frequently have sustained temperatures
below 0°C (or 32°F) the use of Lithium batteries is strongly suggested as
these are performing better than Alkaline batteries under such
circumstances.

87
13 Warranty Information
We disclaim any responsibility for any technical error or printing error,
or the consequences thereof.
All trademarks and patents are recognized.
We provide a 1-year limited warranty on this product against manufacturing
defects, or defects in materials and workmanship.
This limited warranty begins on the original date of purchase, is valid only
on products purchased, and only to the original purchaser of this product. To
receive warranty service, the purchaser must contact us for problem
determination and service procedures.
This limited warranty covers only actual defects within the product itself and
does not cover the cost of installation or removal from a fixed installation,
normal set-up or adjustments, or claims based on misrepresentation by the
seller, or performance variations resulting from installation-related
circumstances.