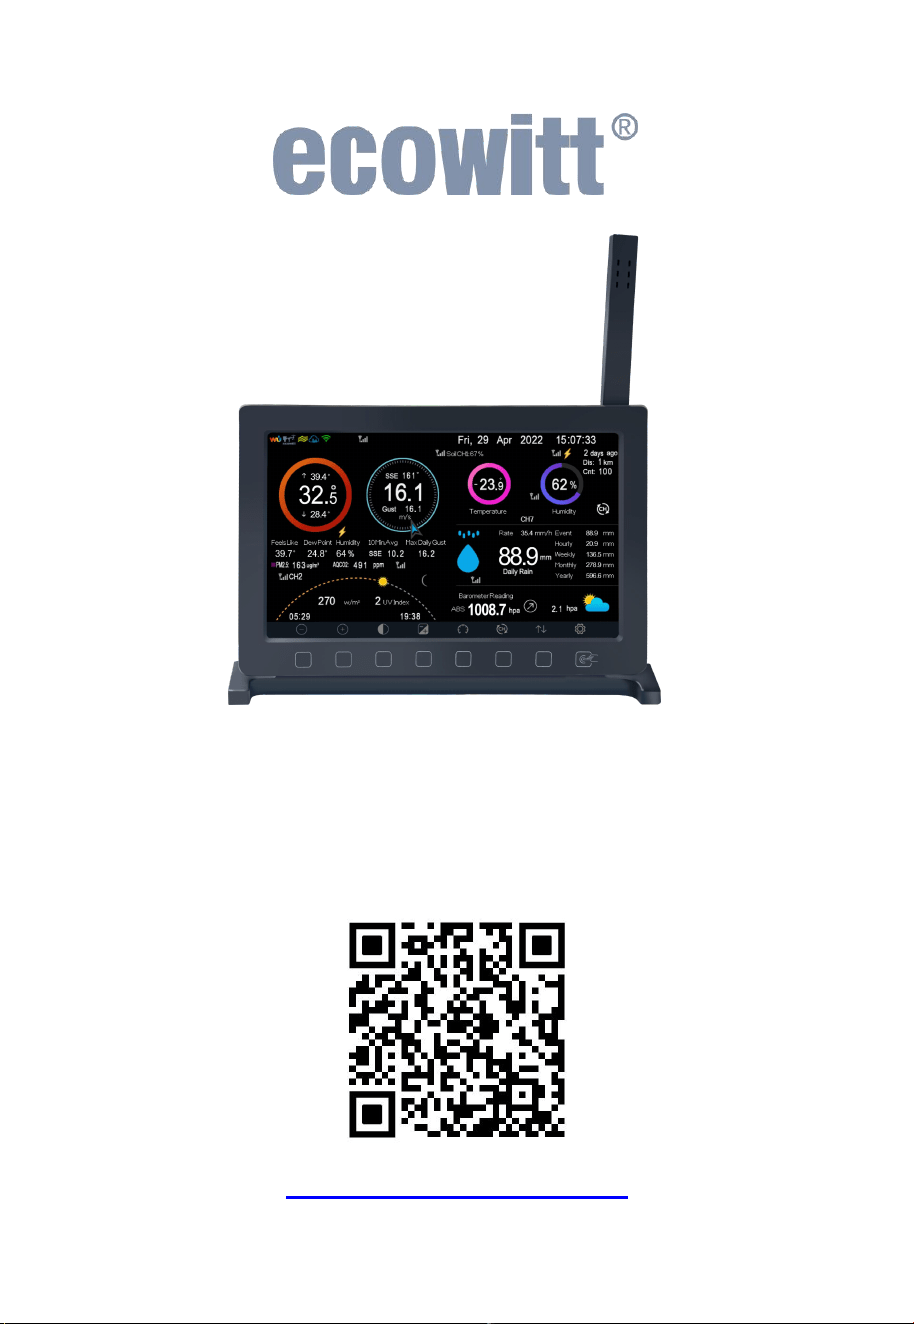
Weather Station Receiver Manual
Model: HP2560
https://s.ecowitt.com/4P7WE9

Table of Contents
1. Introduction..........................................................................................1
2. Initial Setup and Usage ........................................................................3
2.1 Part list ......................................................................................... 3
2.2 Multiple Views and Size ..............................................................3
2.3 Power-up...................................................................................... 4
2.4 Button functions ...........................................................................5
2.5 Language setting .......................................................................... 6
2.6 Connect the console with the sensors .......................................... 7
2.7 Wi-Fi Configuration...................................................................12
2.7.1 Download the Ecowitt App.............................................13
2.7.2 Console provisioning with the Ecowitt App ...................13
2.7.3 Wi-Fi configuration on the console................................ 18
3. User Interface ..................................................................................... 22
3.1 Main screen ................................................................................22
3.1.1 Main Icons...................................................................... 22
3.1.2 Transmitter Signal Tower Icons ......................................24
3.1.3 Temperature/Humidity/Wind direction/Rainfall icons ... 26
3.1.4 Weather Forecasting/Moon Phase Icons .........................29
3.1.5 Beaufort Wind Force Scale.............................................33
3.1.6 Lightning Alert ................................................................34
3.1.7 Background (dark/light) Themes .................................... 34
3.2 View and Reset MAX/MIN.......................................................35
3.3 History Record ...........................................................................37

3.4 Graph Mode ............................................................................... 40
3.5 Optional Sensor Display Mode..................................................42
4. Setup Guide ........................................................................................ 43
4.1 Setup page ..................................................................................44
4.1.1 Date and Time.................................................................45
4.1.2 Time Format....................................................................46
4.1.3 Date Format .................................................................... 46
4.1.4 Temperature Units .......................................................... 46
4.1.5 Barometric Units .............................................................46
4.1.6 Wind speed Units ............................................................46
4.1.7 Rainfall Units..................................................................46
4.1.8 Solar Rad.Units...............................................................46
4.1.9 Backlight .........................................................................47
4.1.10 AFC (Default: OFF) ......................................................48
4.1.11 Longitude and Latitude ................................................. 48
4.1.12 Reset Weekly Rain at (default: Sunday).......................49
4.1.13 Rainfall Season (default: January)................................50
4.1.14 Interval (1-240minutes Selectable)............................... 50
4.1.15 Weather Server..............................................................50
4.1.16 WiFi-Scan..................................................................... 50
4.1.17 Reset Daily Rain at (default: 00:00) ............................. 50
4.1.18 More..............................................................................50
4.2 Alarm page .................................................................................59
4.3 Calibration page .........................................................................59
4.4 Factory page ...............................................................................68

4.4.1 Automatic Clear Max/Min ..............................................69
4.4.2 Reset to Factory .............................................................. 69
4.4.3 Language .........................................................................69
4.4.4 Clear History ...................................................................69
4.4.5 Clear Max/Min...............................................................70
4.4.6 Backup data .....................................................................70
4.4.7 About information...........................................................70
5. Optional Weather Servers .................................................................71
5.1 Registering with and using wunderground.com ........................ 74
5.2 Viewing data on wunderground.com.........................................78
5.3 Registering with and using Ecowitt Weather .............................79
5.4 Viewing data on ecowitt.net...................................................... 81
5.5 Customized server setup ............................................................ 82
6. Features...............................................................................................84
7. Specifications...................................................................................... 87
8. Troubleshooting Guide ......................................................................88
9. Optional Sensors ................................................................................ 92
10. Warranty Information .....................................................................95
11. FCC................................................................................................... 96
12. Contact Us .........................................................................................98
12.1 After-sales Service ...................................................................98
12.2 Stay in Touch........................................................................... 98

1
1. Introduction
Thank you for your purchase of the Ecowitt HP2560 weather station
receiver or console.
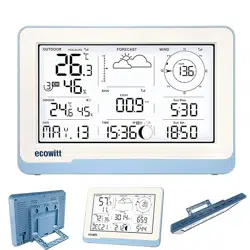
The Ecowitt HP2560 is a 7" diagonal size TFT(high resolution) colored
screen weather station receiver, which provides two
background(dark/light) themes selectable.It supports monitoring indoor
and outdoor temperature, humidity, absolute and relative barometric
pressure, wind speed and gusts, wind direction, rainfall, solar radiation
(light),and UV, and it collects these sensor data from various supported
wireless sensors.
Furthermore,the HP2560 supports WiFi networking, weather information
upload to weather services and to a customer chosen server,a SD card to
upgrade firmware,archive your console weather information, back up
historical and current data.
The HP2560 needs to be used with optional sensors to obtain outdoor
weather data. Apart from the indoor temperature&humidity&barometric
data provided by the console's built-in sensor, this device is not a
standalone product.
We at Ecowitt are very conscientious about your possible concerns regard
ing sending your data into a cloud. Not only do we not share your data wi
th any third party, we also offer you a possibility to manage your data loc
ally by the help of a special tool-the WS View Plus app. You may refer
to the WSView Plus APP instruction for more details.
The following user guide provides step by step instructions for
installation and operation, including more functions of the HP2560
receiver. Use this manual to become familiar with your professionally
designed weather station and save it for future reference.

2
General Terms Used in the Manual:
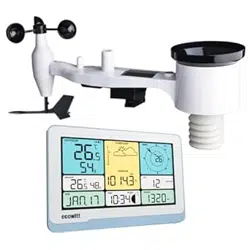
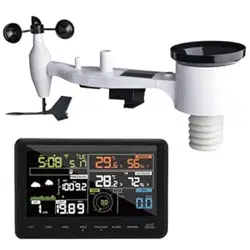
Weather Station: Includes the console and sensors (or sensor array).
Receiver: Refers to the console.
Transmitter: Refers to the sensor or sensor array.
RF: Radio frequency. It refers to the ISM and SRD SubG (Industrial,
Scientific and Medical and Short Range Devices frequency bands below
1 GHz) for communicating between the console and its sensors. This
frequency is not the same as the 4G modem (LTE) or Wi-Fi working
frequencies (2.4 GHz, 5 GHz).) ISM/SRD bands are kept separate from
4G frequencies by national regulations to avoid interferences. Typical
ISM/SRD frequencies are 915MHz(Americas), 868MHz(Europe),
433MHz(worldwide), 920MHz (Japan, Korea).
3
2. Initial Setup and Usage
2.1 Part list
Table 1
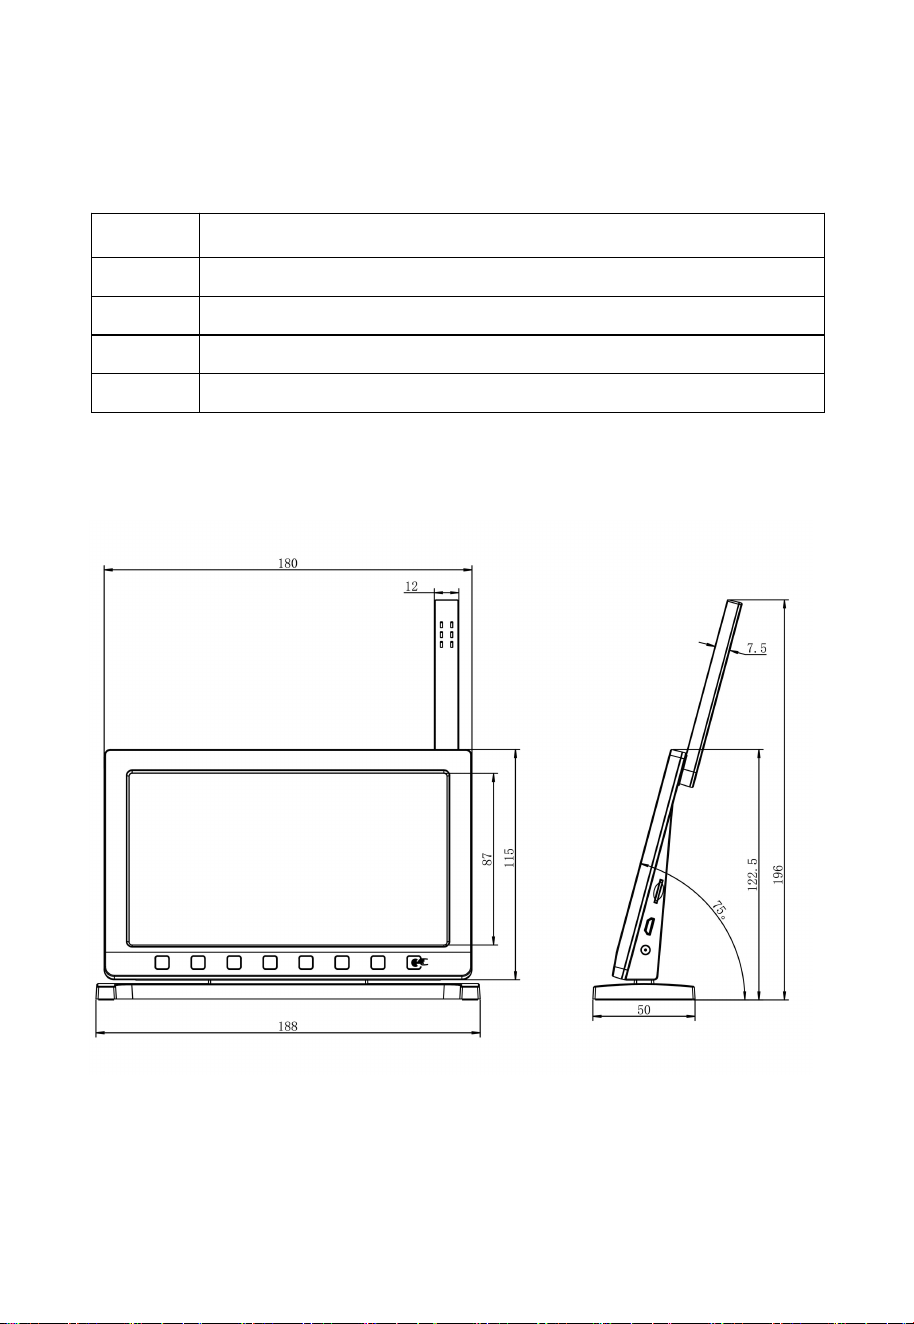
2.2 Multiple Views and Size
Figure 1: Main view Figure 2: Side view
QTY
Item
1
HP2560 Weather Station Receiver
1
DC to USB cable
1
User Manual
1
Quick Start Guide
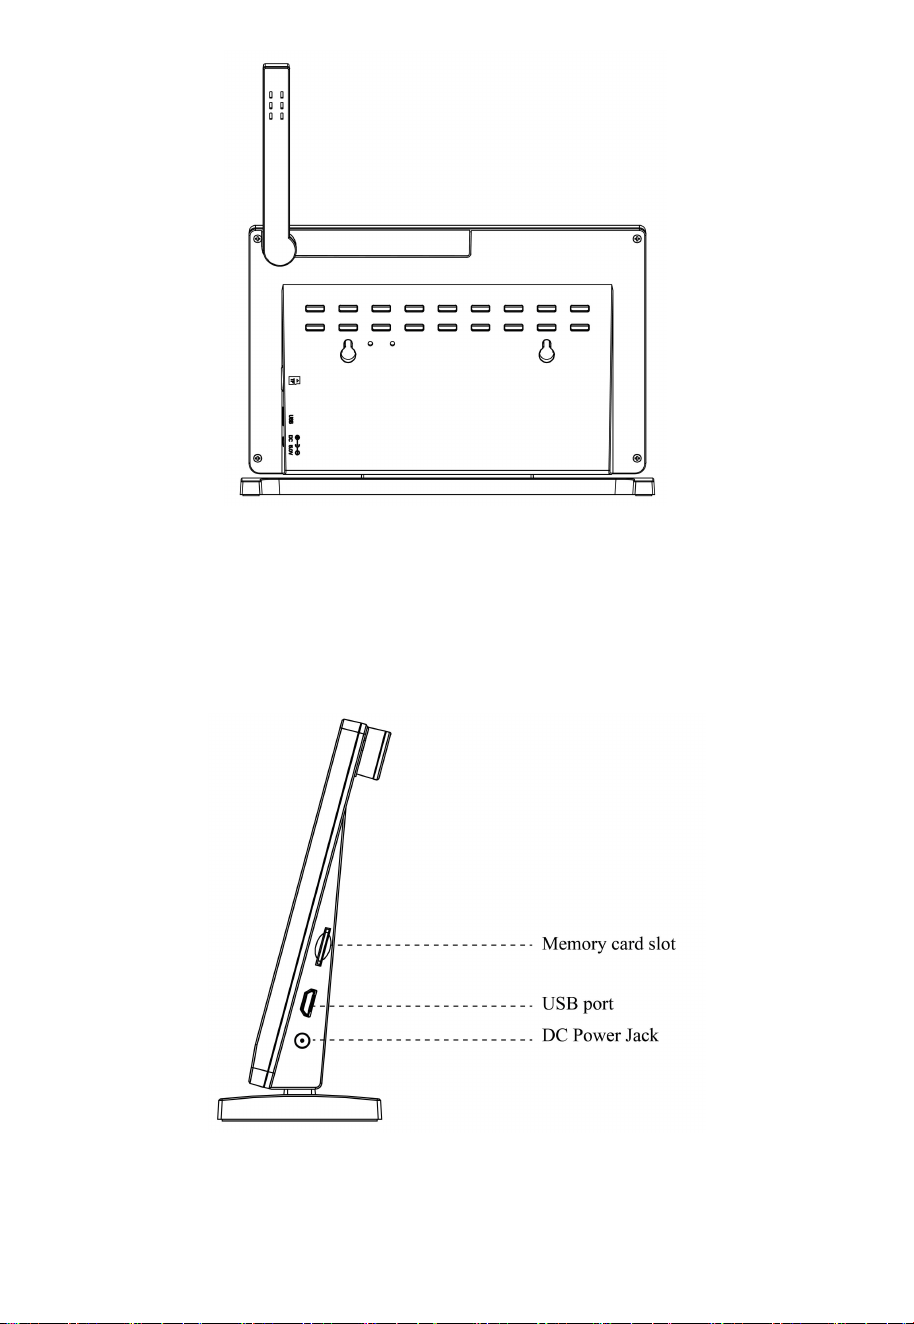
4
Figure 3: Rear view
2.3 Power-up
Insert the 5V 1A Power Adapter into an outlet, and then plug it into the
Power Jack on the right side of the console. The screen lights up
immediately after a beep and power-up is successful, then receive the
data from the transmitters.
Figure 4: Power-up
5
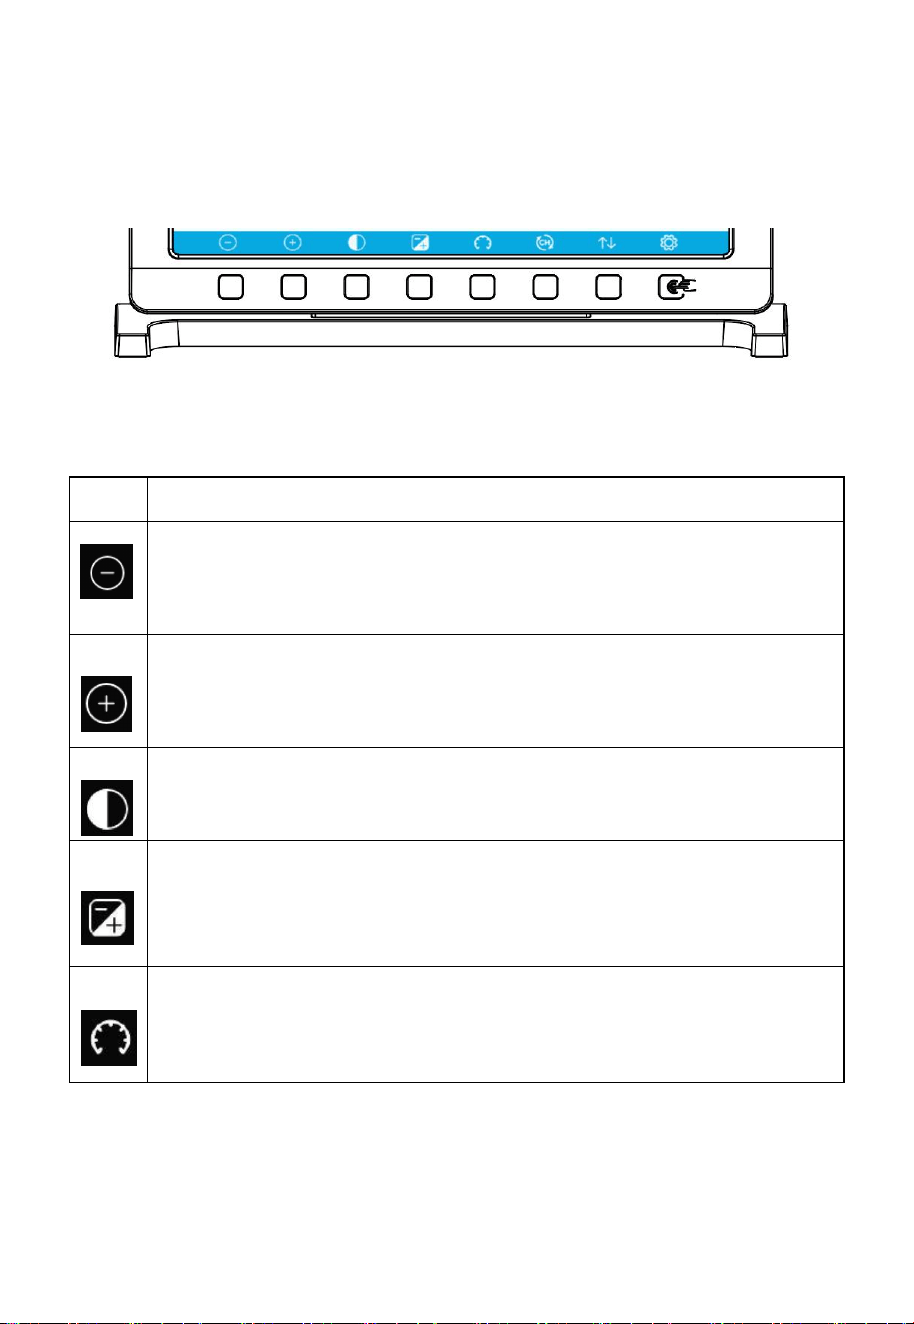
2.4 Button functions
There is a set of 8 buttons on the bottom of the console display. The
following tables briefly explain the function of these buttons.
Figure 5: Buttons around the display
Icon
Description
Brightness control button
Touch this button to decrease the brightness-
or to confirm a selection in setup mode.
Brightness control button
Touch this button to enhance the brightness-
or to confirm a selection in setup mode.
Backlight on/off button
Touch this button to on/off the backlight.
Background button
Touch this button to choose between dark background display and
light background display.
Pressure display button
Touch this button to choose the display between Absolute pressure
and Relative pressure.
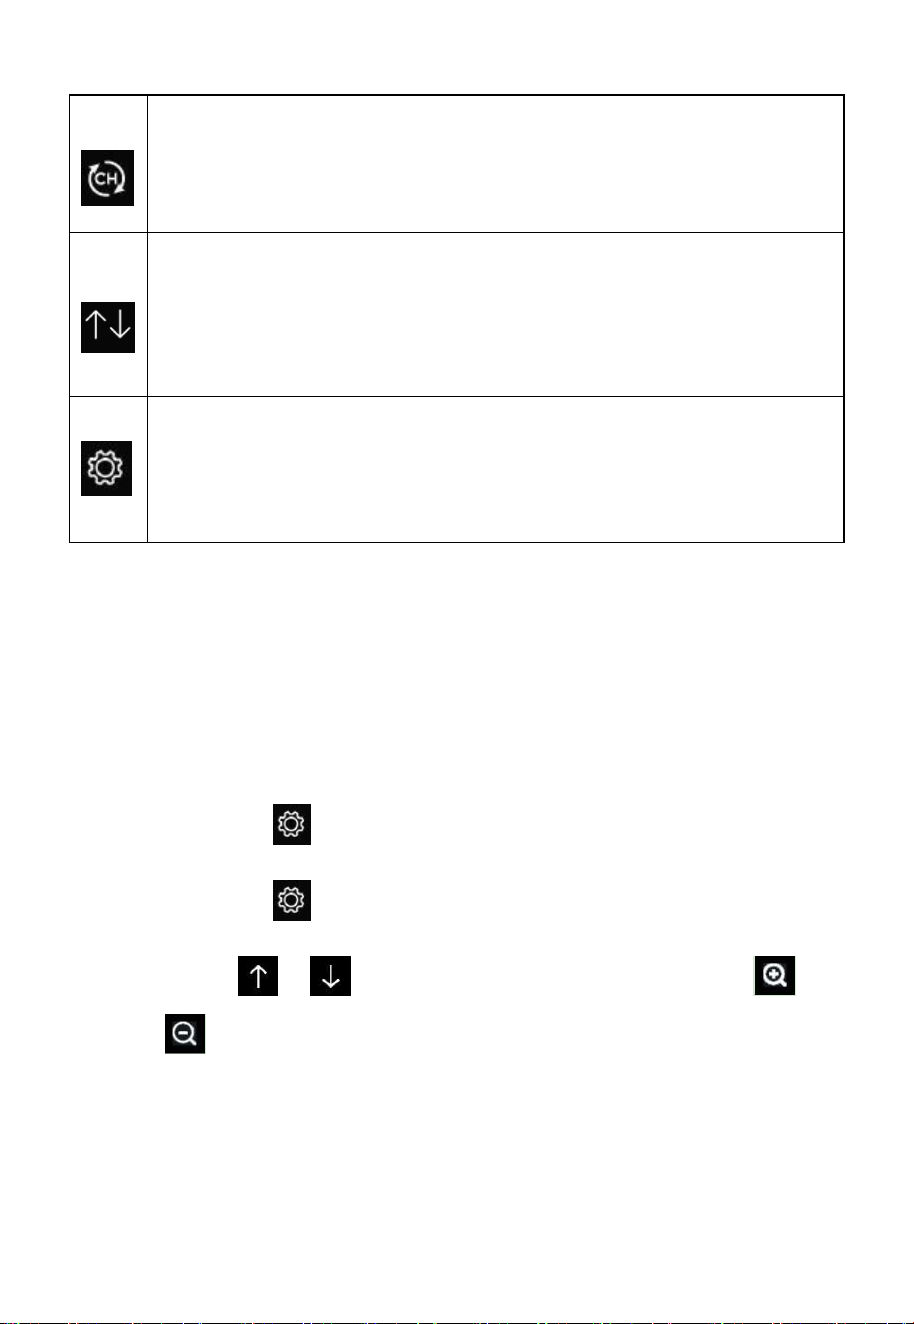
6
Channel button
Touch this button to shift the display between indoor temp &
humidity, Multiple Channel temp & humidity and scroll
automatically mode.
History button
Touch this button once to view Max/Min record; Touch twice to enter
History mode; Touch three times to enter Graph Mode. Touch four
times to enter Optional Sensors Display Mode.
Setting button
Touch this button to enter Setup Mode.
Note: once having entered the setup mode, the settings button shifts one
button to the left.
Table 2
2.5 Language setting
The console's default language is English. To facilitate smooth operation,
please select your preferred language first.
You may choose from the following languages: English, Dutch, French,
German, Italian, Portuguese, Spanish, Russian.
① Touch the button on the home screen.
② Touch the button repeatedly until the "Factory" page appears.
③ Touch or button to select the language. Touch the
or button to confirm the language.
7
Figure 6: Language setting
2.6 Connect the console with the sensors
Note 1: This connection does not require Wi-Fi.
After powering up the console and setting the language, the next step is to
connect the console with the sensors. The sensor data will then be
displayed on the console for your observation.
The HP2560 console is compatible with most sensors. For information on
supported sensors, please refer to Section 9 "Optional Sensors."
The optional sensors can be purchased separately. Make sure to select the
model with the same RF frequency as your console (the frequency is
different for various countries because of regulations).
Note 2 : To pair the optional sensors with the HP2560 console, please
follow the below operations:
Place the optional sensor next to the console (keep them about 5-
10ft/1-2m away from the console).
8
Install batteries on the sensor and wait for 1-2 minutes.
Check whether the console will pick up the sensor data automatically
and display it on the screen.
If not, touch the button and go to the Sensors ID page(Home
screen [gear wheel symbol ] More [Setup] Sensors ID
[More] – use the arrow up/down keys to select the option,use the
or button to confirm).
In the Sensors ID Setup page, find the sensor you want to pair -
select the ID number box and register it.
Once successfully, you may return to the main interface to check the
data.
The console usually registers the sensors in the sequence it receives
their signal. If you prefer a special sequence and want to assign a
sensor to a dedicated channel number, you will have to enter the
sensor ID, and save the change to take effect. The sensor ID is
usually provided with a little sticker on the housing of the sensor or
sometimes in the battery compartment.
1) Please follow these steps to view the Sensor ID page.
① Access the Setup Page: On the home screen, touch the button
located at the far right.
9
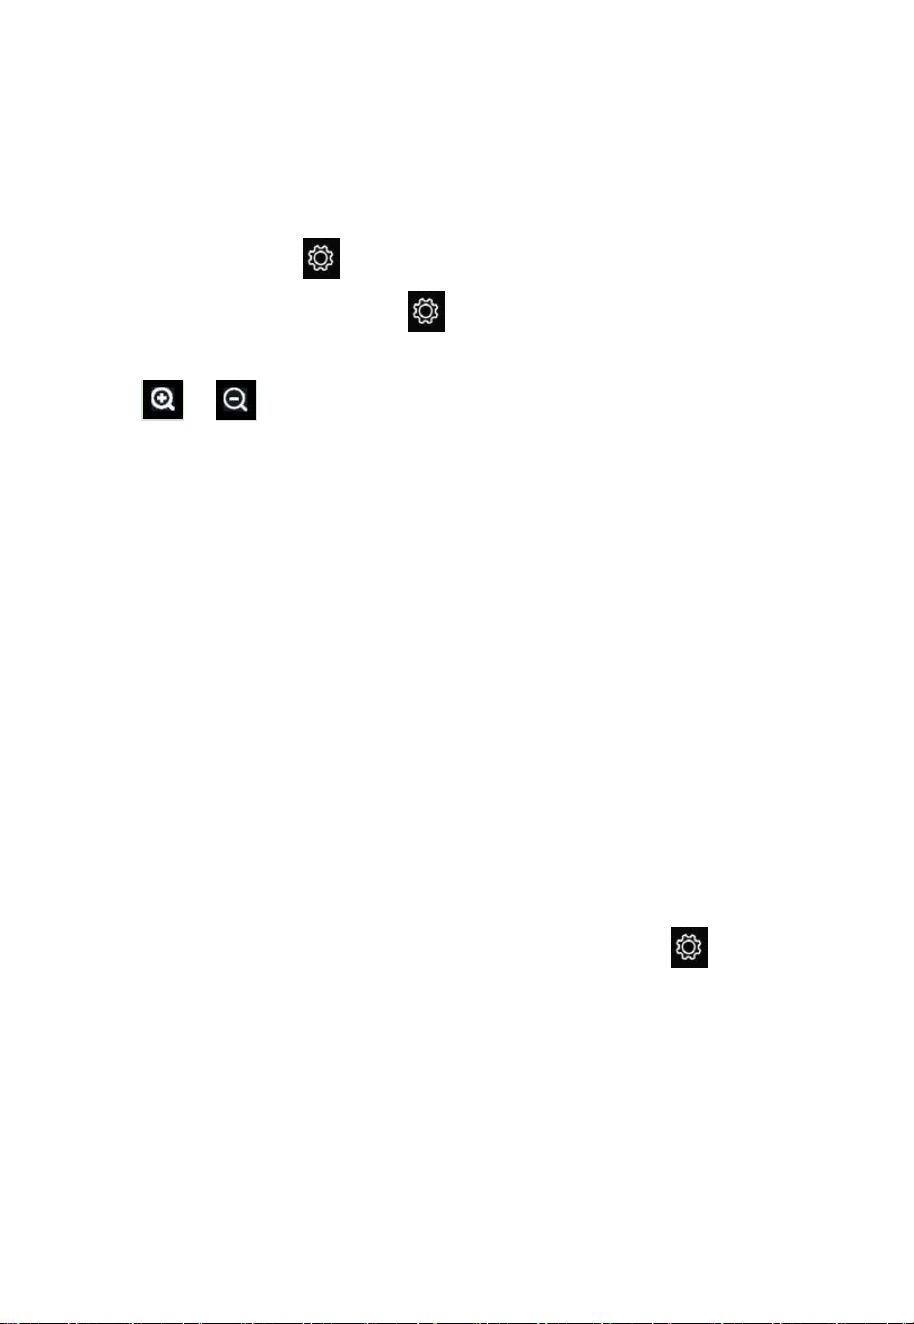
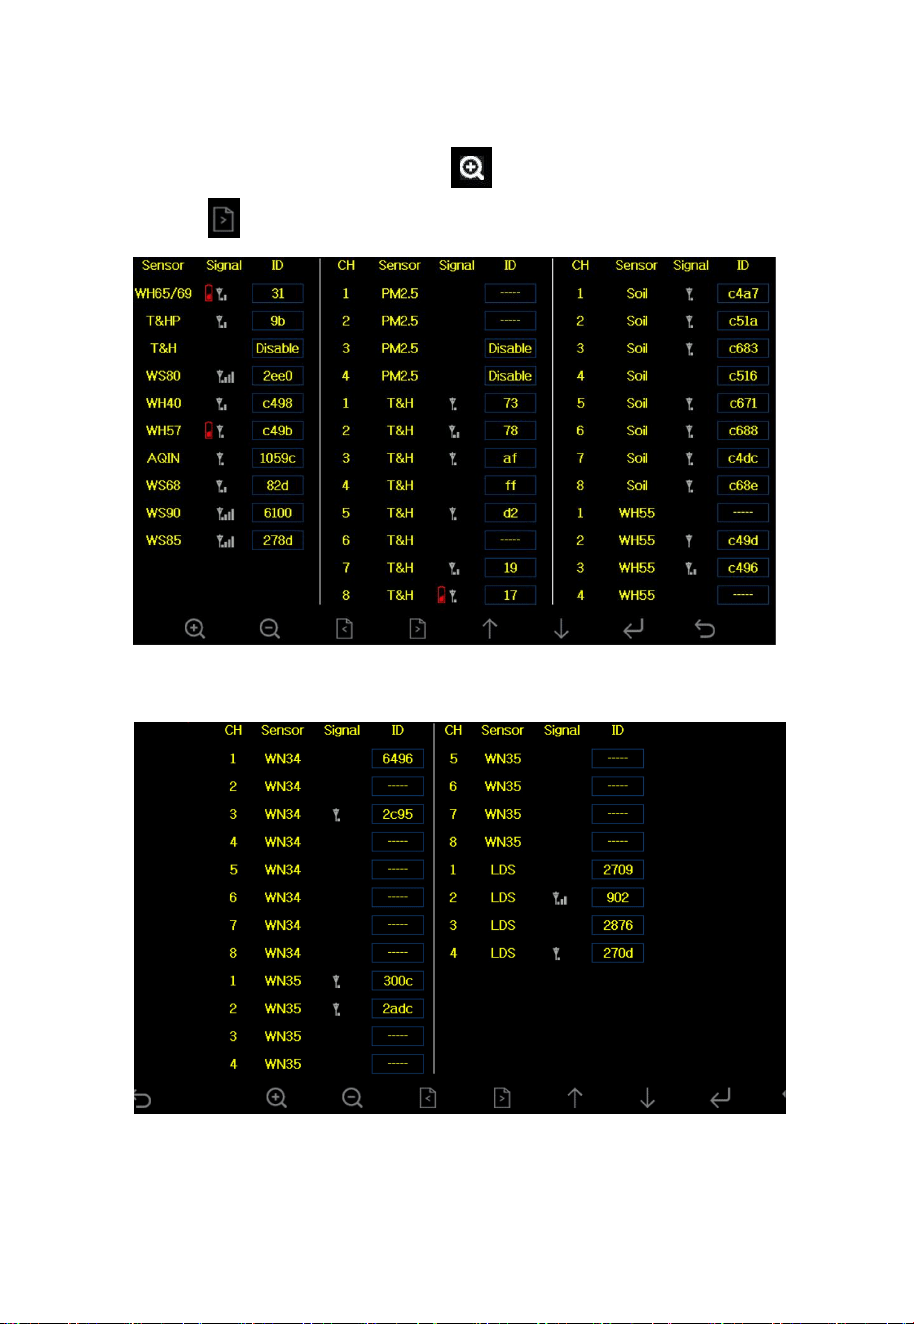
② Access the Sensor ID page: On the "Setup" page, select the
“More” section. touch the button to confirm this section. touch
the button to view the next page.
Figure 7: Sensor ID
Sensor: Sensor model
Signal: Signal strength and low battery
10
ID: Sensor ID
CH: Channel name
T&H: WH/WN30/31/31S/31_EP/36/37
(For the T&H sensors the channel has to be selected inside the
battery compartment of the sensor)
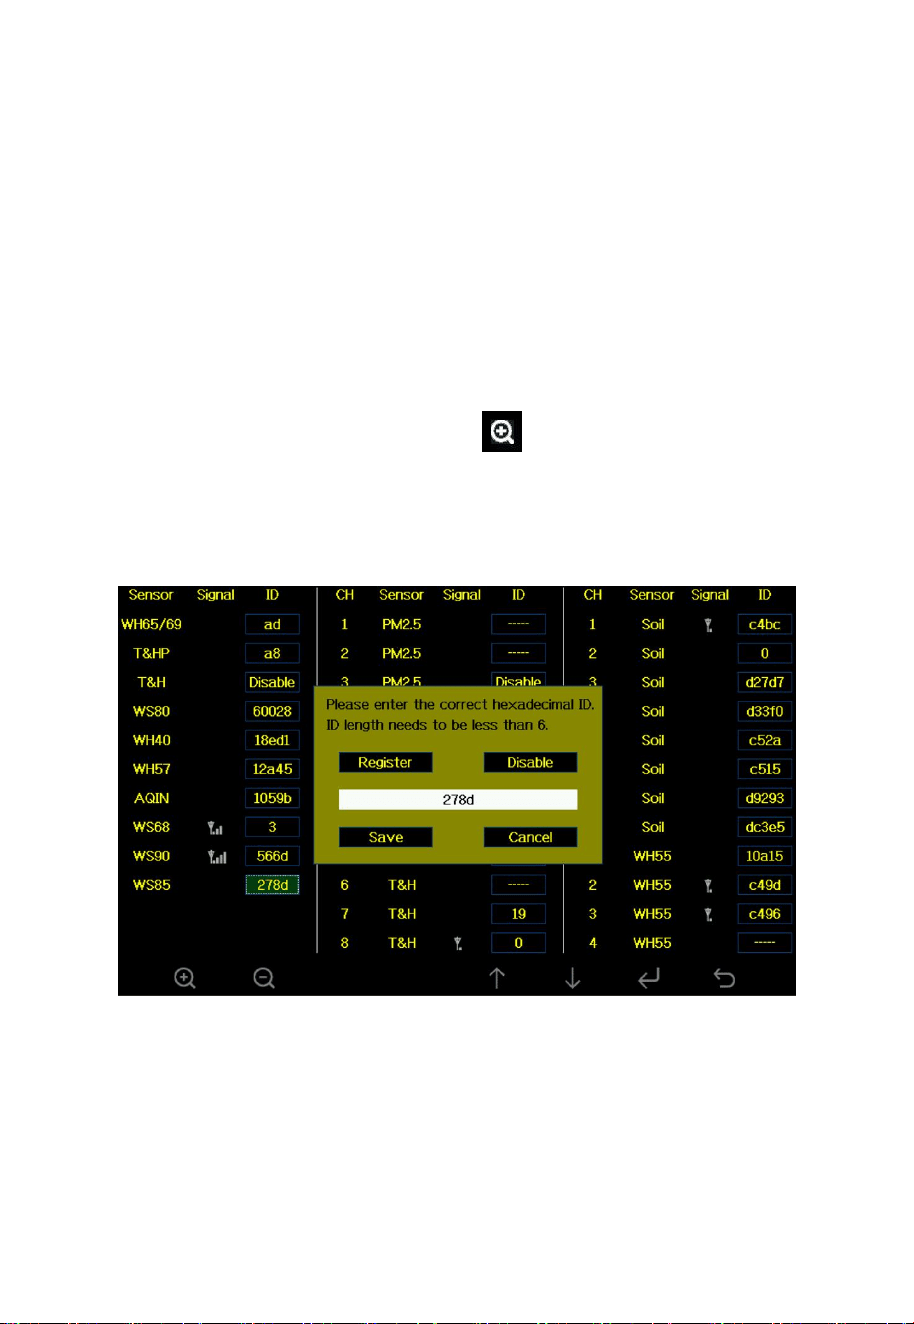
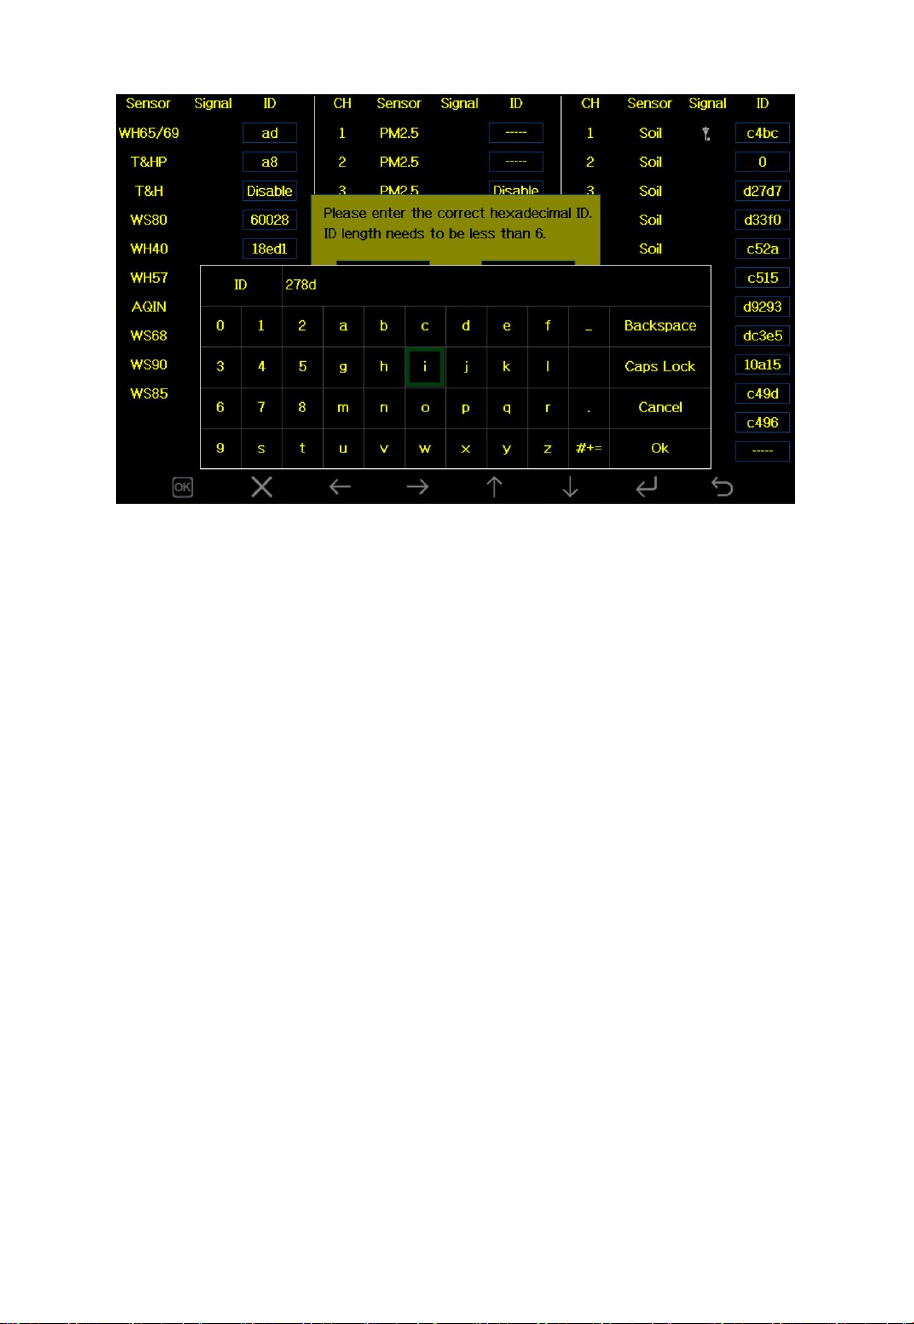
2) To pair the console with a new sensor, simply register it by entering
new Sensor ID. Follow these steps to complete the process.
① Select the relevant sensor and touch button to confirm and enter
the new Sensor ID.
② Select the “OK” button and select Save to finalize the registration.
11
Figure 8: Sensor ID
Note: If the console and sensor are disconnected, the RF symbol (radio
tower) will not be displayed.
After successfully registering the sensors or the sensor array, the sensors
can be mounted /placed at their final location.
12
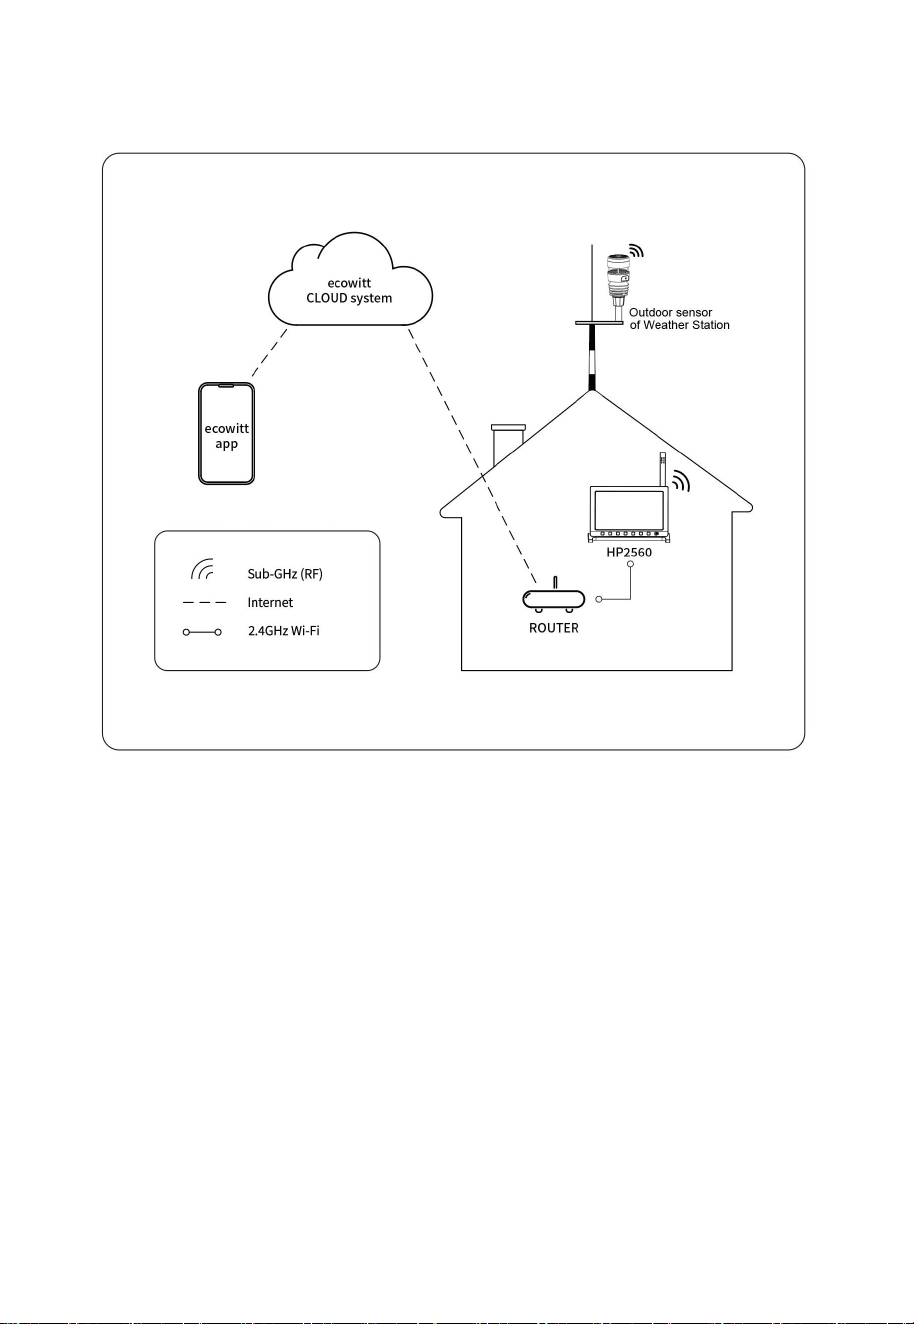
2.7 Wi-Fi Configuration
Figure 9: Brief concept diagram
This diagram effectively illustrates the collaboration between the receiver,
sensor, router, cloud system, and the Ecowitt app. Each component plays
a vital role in creating a seamless flow of data, showcasing how they
work together harmoniously.
Once the internet connection is established, you can register your console
at the Ecowitt Weather Cloud (www.ecowitt.net) and have post its data
there and view it and its history via a web browser or our apps.
Next, the steps below will help you achieve the content shown in the
diagram above.
13
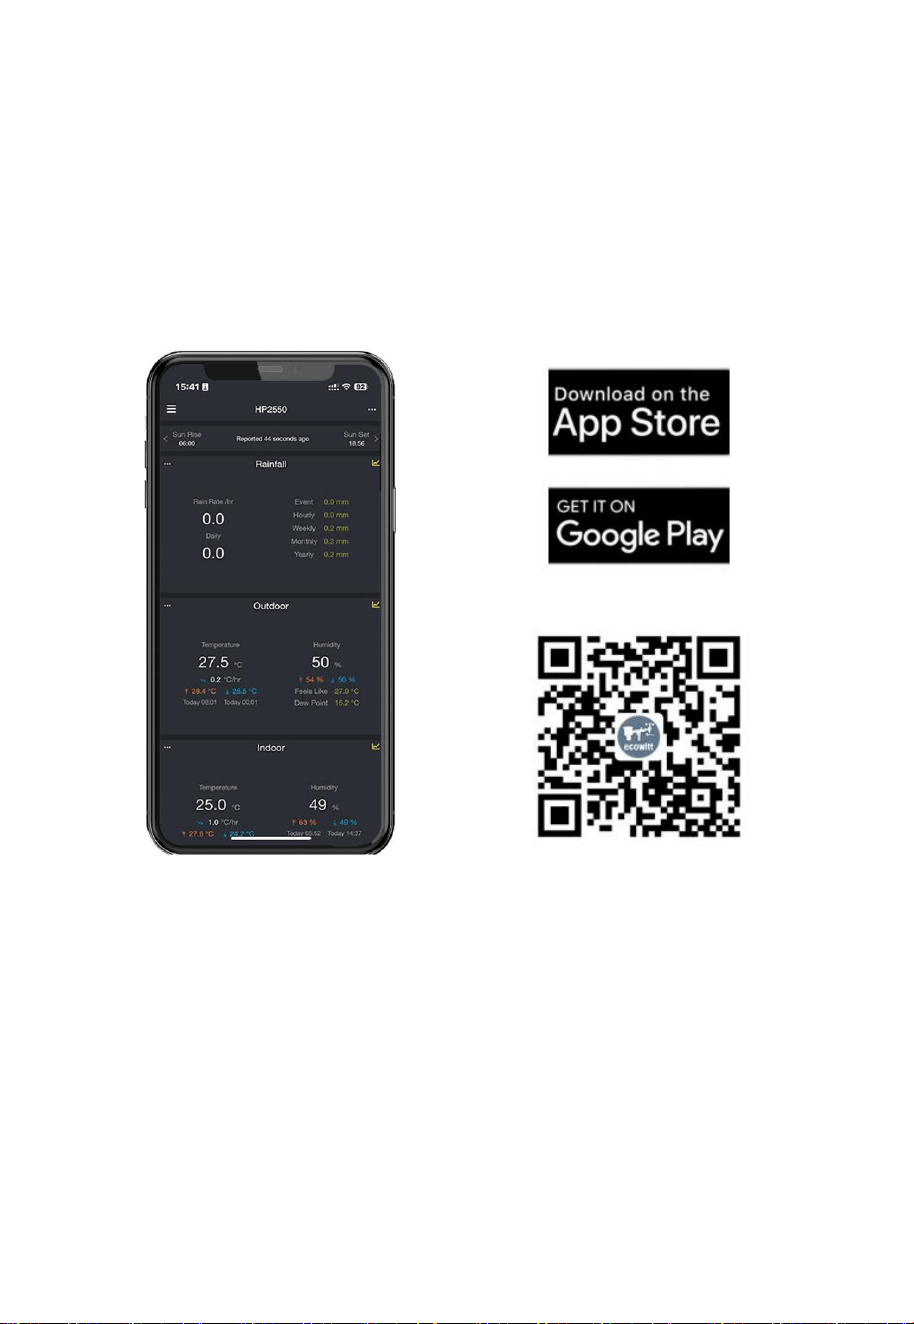
2.7.1 Download the Ecowitt App
Firstly please visit the Apple App Store or the Google Play Store or scan
the QR code below to download the free Ecowitt App onto your mobile
device.
Open the Ecowitt app and follow the on-screen instructions to add the
device to the Device list of the Ecowtt app.
Figure 10 : Download Ecowitt App
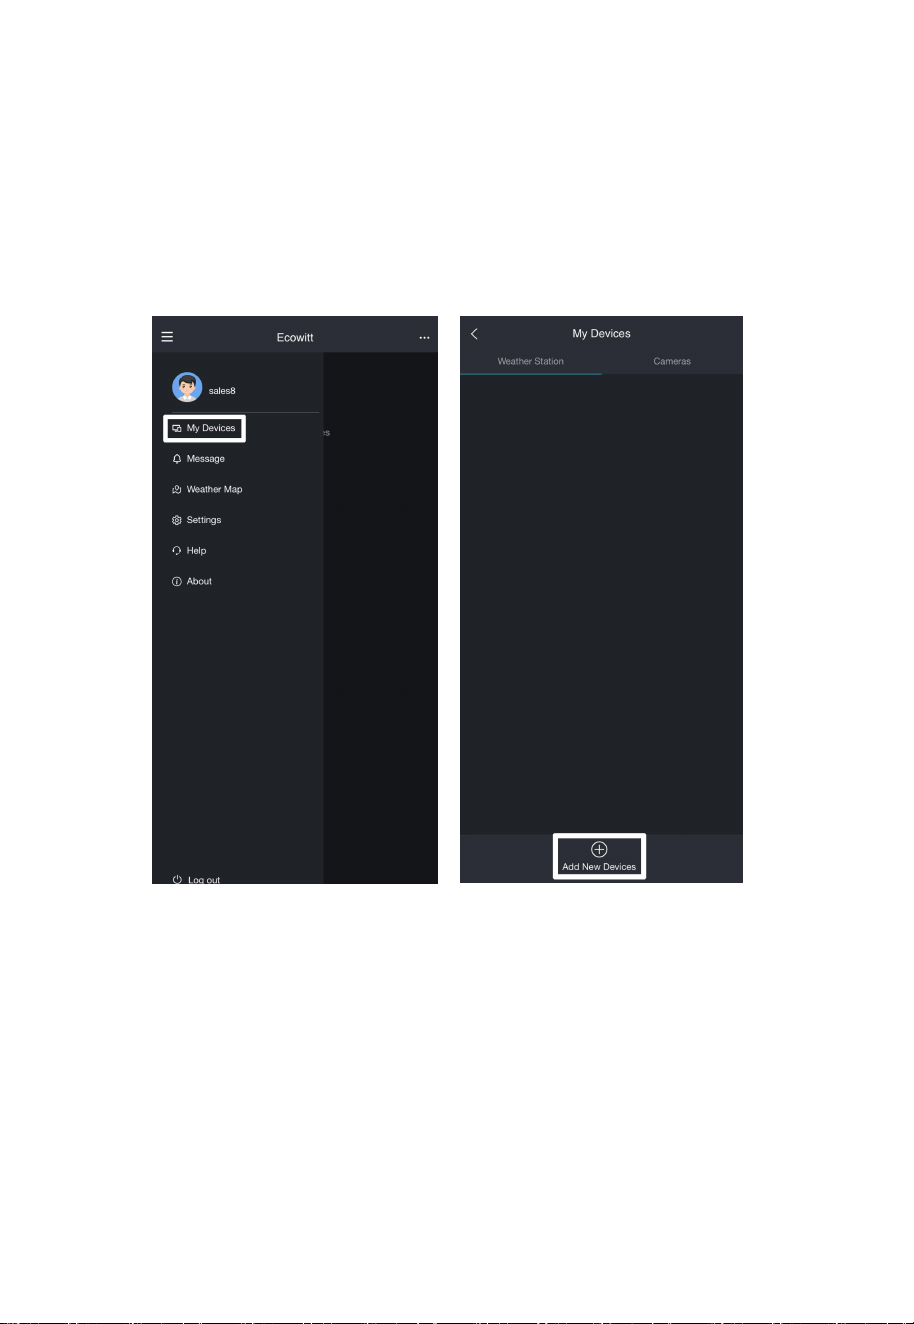
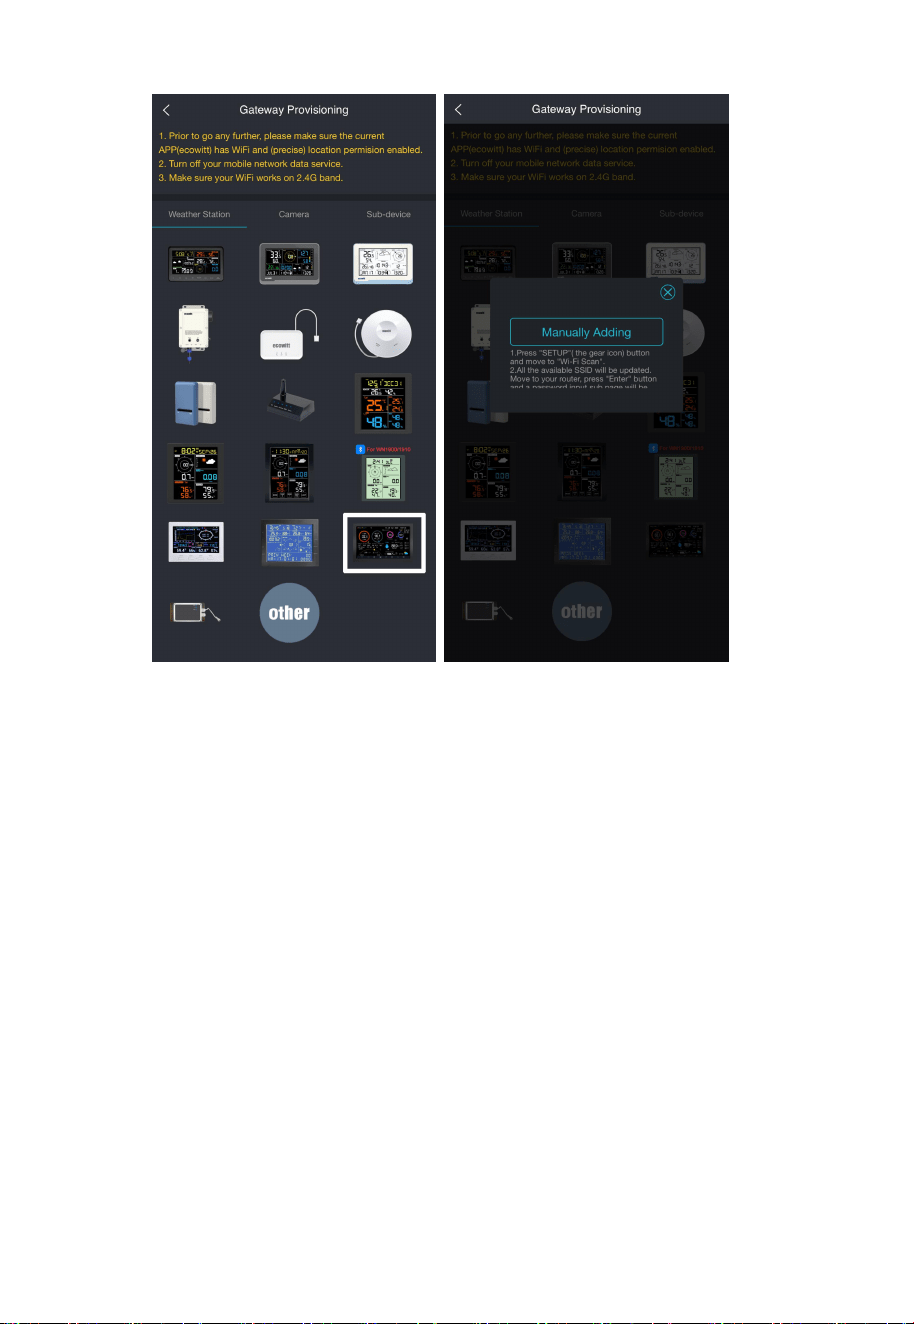
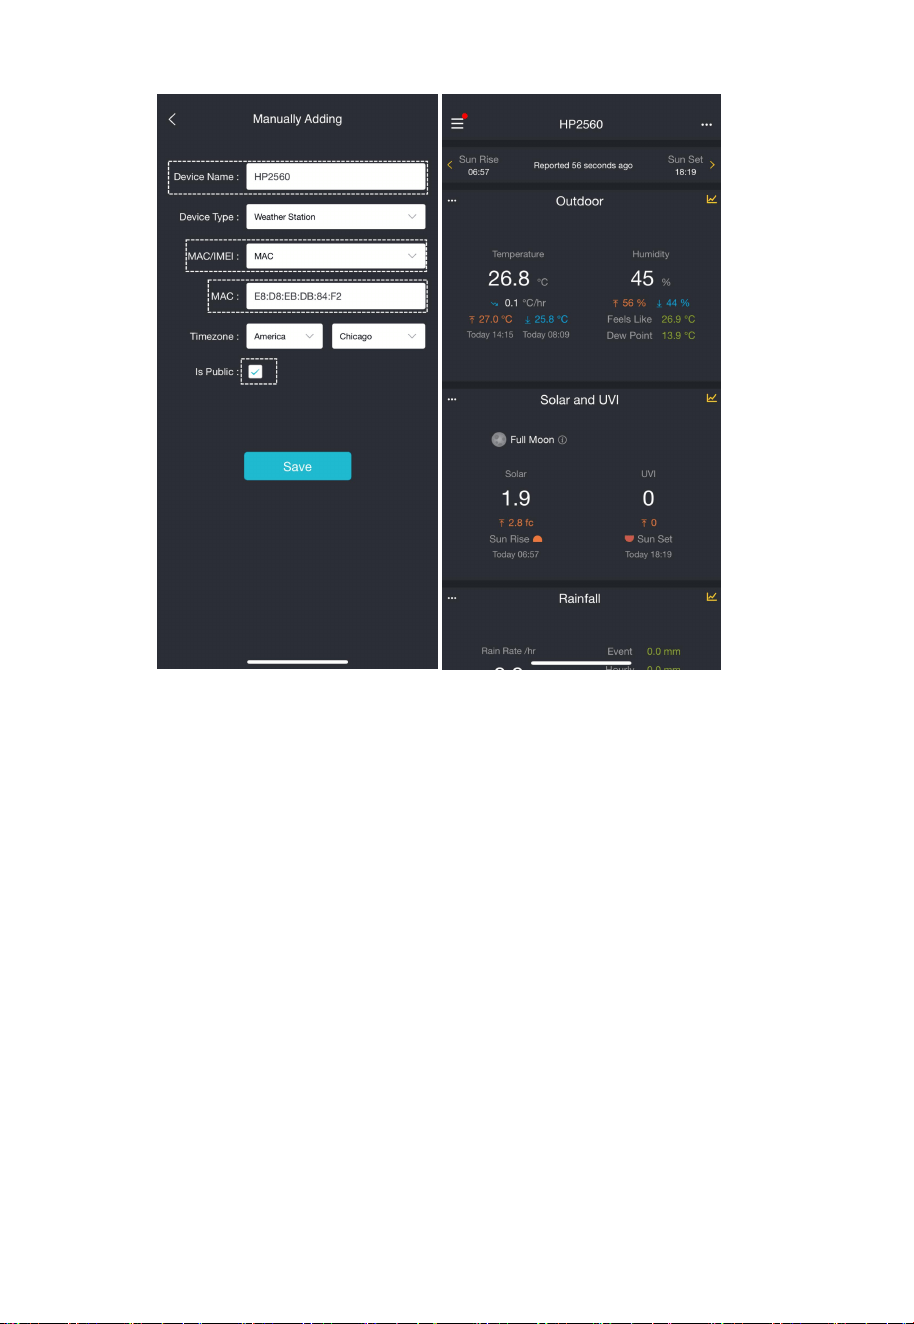
2.7.2 Console provisioning with the Ecowitt App
(1) Open Ecowitt App →"My devices"→ "Add New Devices"→ click
HP2560 icon→ choose Manually Adding ( the App will guide you
through the pairing process):
14
In the Manually Adding step, you will be prompted to perform the
operations on the console,please jump to Section 2.7.3 to complete the
process firstly. Make sure to note down the MAC address.
Then go back to this section to continue with the Manually Adding step.
15
Figure 11
(2) Edit the “Device Name”, enter the MAC address written down in
step (1) and enter the proper Timezone, tick "Is Public" if you want
the data to be public to other users. Click on Save and the data will
can soon be viewed online.
16
Figure 12
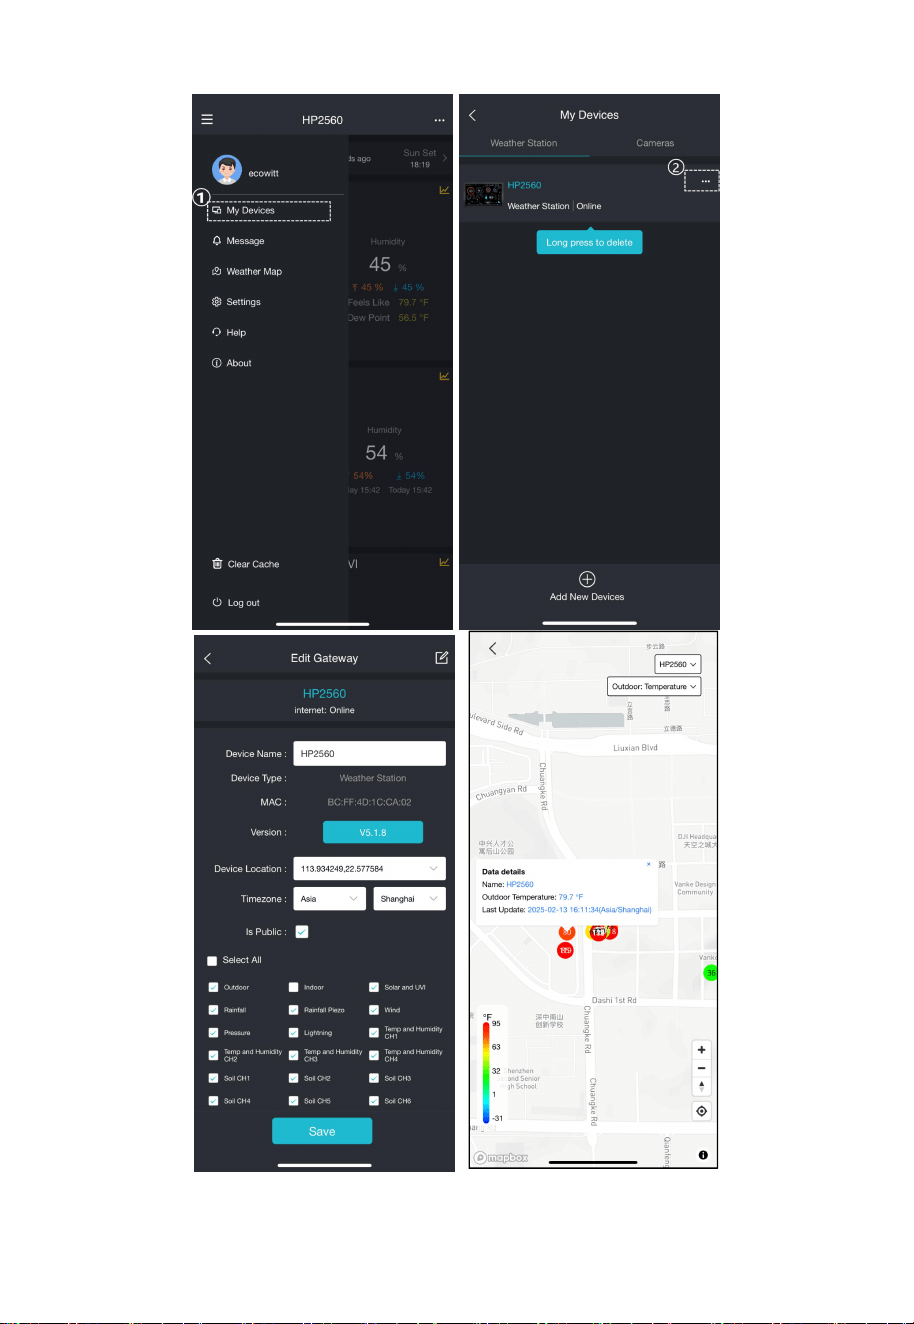
(3) After adding the device, follow the below steps to set the related
settings.
①
Click on “My Devices”.
② Click on the“...” icon.
③ Choose if check “Is Public”. This refers to whether to make the
data public on the map. If you need to check this option, please select
the data you want to display. Other users can only see the data items you
checked.
④ Click Save.
⑤ Go to the “Weather Map” to view the shared data.
17
Figure 13
18
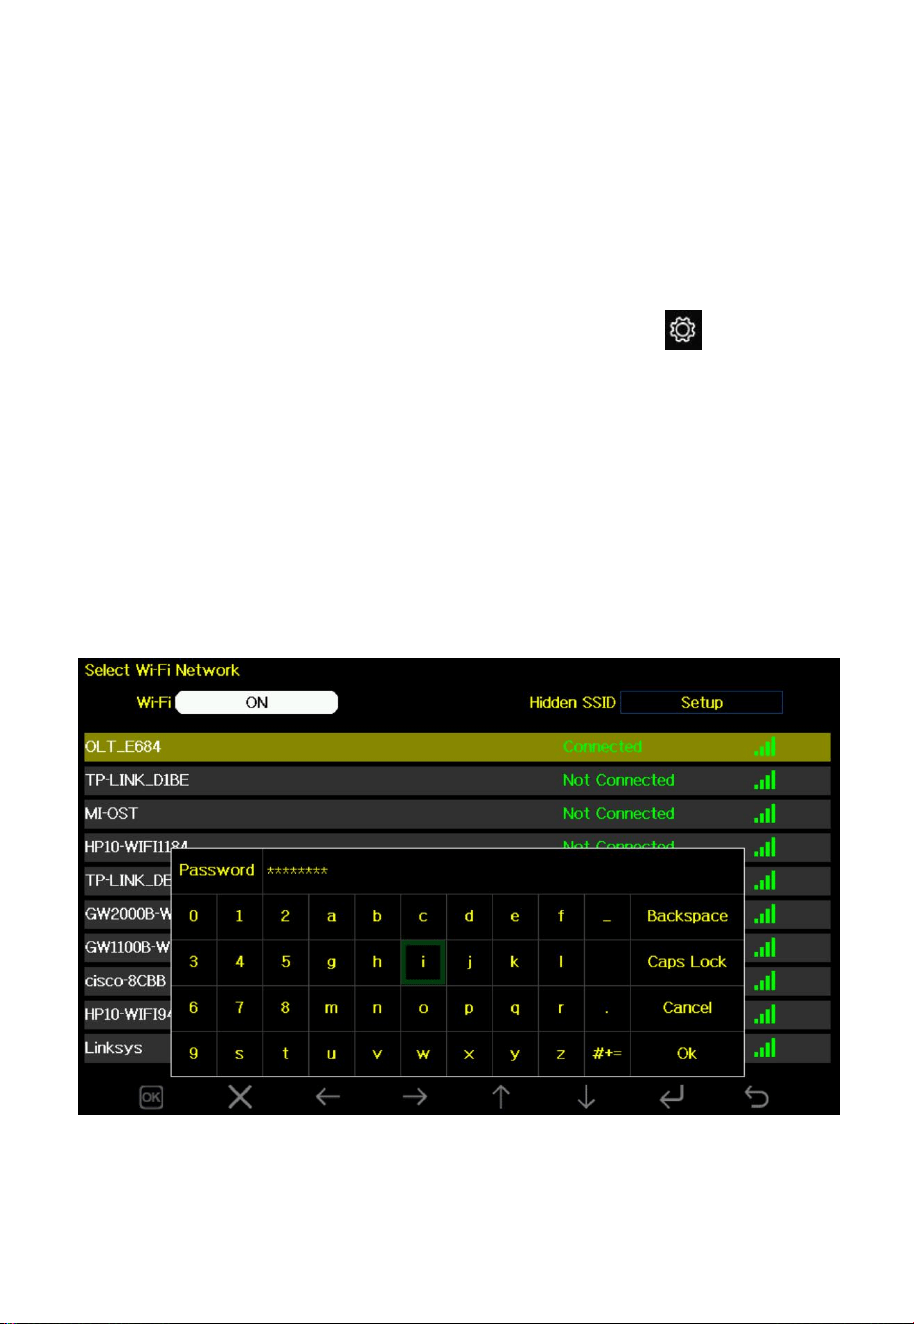
2.7.3 Wi-Fi configuration on the console
If you need upload data to the servers, please follow up the below steps to
complete the Wi-Fi configuration on console (data uploading requires
the Wi-Fi network). For detailed information about DIY Upload Servers,
please jump to Section 5.
①Access the Setup Page: On the home screen, touch the button.
②Navigate to Wi-Fi Scan: On the "Setup" page, select the “Wi-Fi Scan”
section. The system will then display a list of all available Wi-Fi
networks.
③Connect to Wi-Fi: Choose the desired SSID (note that only 2.4GHz
band Wi-Fi networks are supported) and enter the required password.
Figure 14: Connect to Wi-Fi network
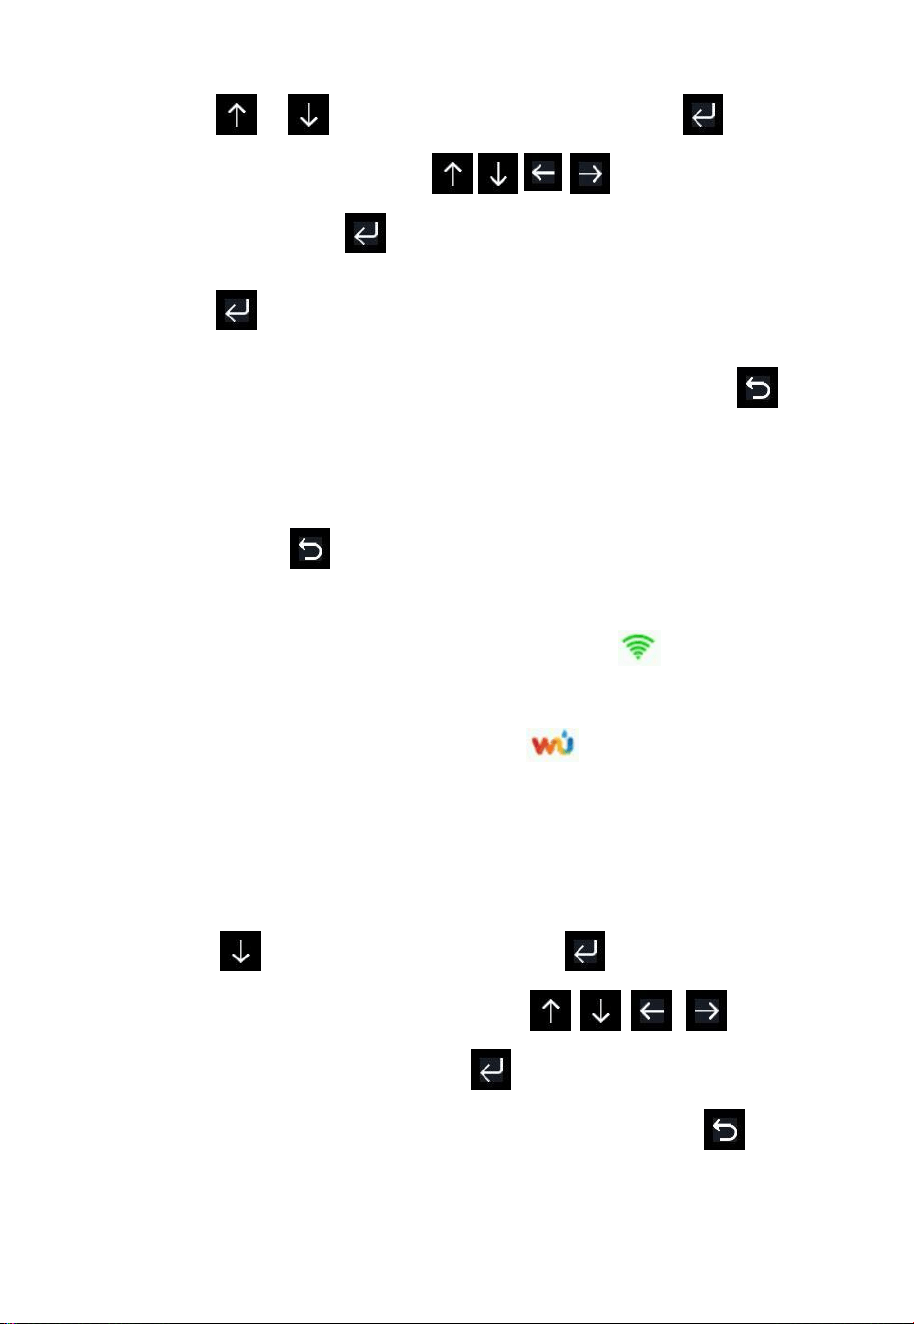
19
1) Touch or to select the Wi-Fi network. Touch to
display the keyboard. Touch to scroll to the
character and touch to enter the character.
2) Touch to confirm the character.
3) Select the left “OK” button to confirm the password. Touch
to return to normal display mode.
It is possible that your network is not listed when Wi-Fi Scan is
performed. Touch and restart Wi-Fi Scan, this will usually solve
the problem.
If the Wi-Fi network connects successfully, the icon will show
on the left top of the console display. If the data upload to
Wunderground.com successfully, the icon will show on the
left top of the console display.
If the Wi-Fi network you would like to connect is with a hidden
SSID(Network Name) , please follow below steps to connect:
4) Touch to highlight the SSID. Touch to display the
keyboard and enter your SSID. Touch to
scroll to the character and touch to enter the character.
Touch the left “OK” button to confirm the SSID
.
Touch to
return to the setup page.
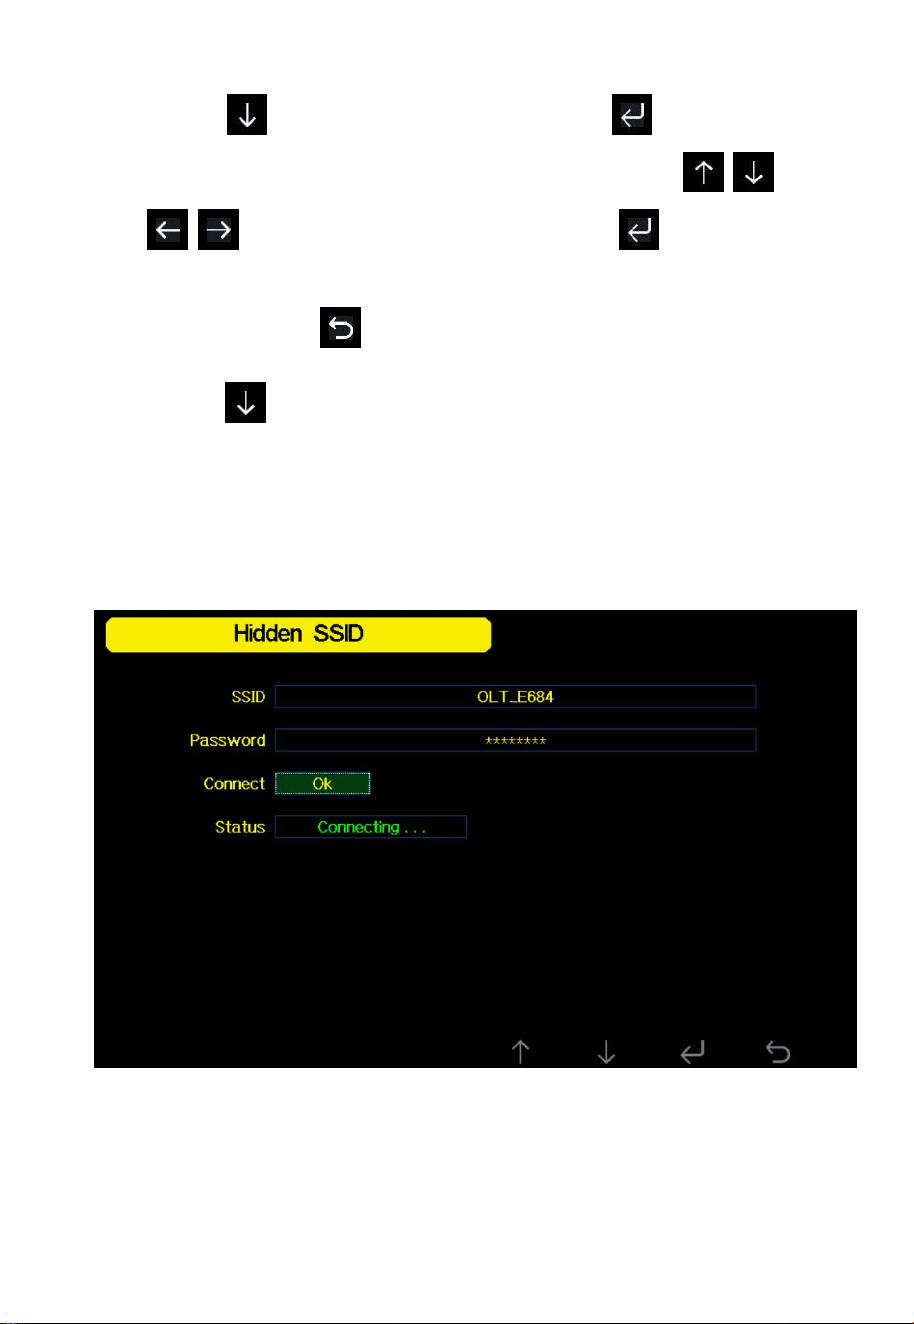
20
5) Touch to highlight the Password. Touch to display
the keyboard and start to enter your password. Touch
to scroll to the character and touch to enter
the character. Touch the left “OK” button to confirm the
password. Touch to return to the setup page.
6) Touch to highlight the “OK” button beside “Connect”
to start connecting.
After connected successfully, the status will display
“Connected”.
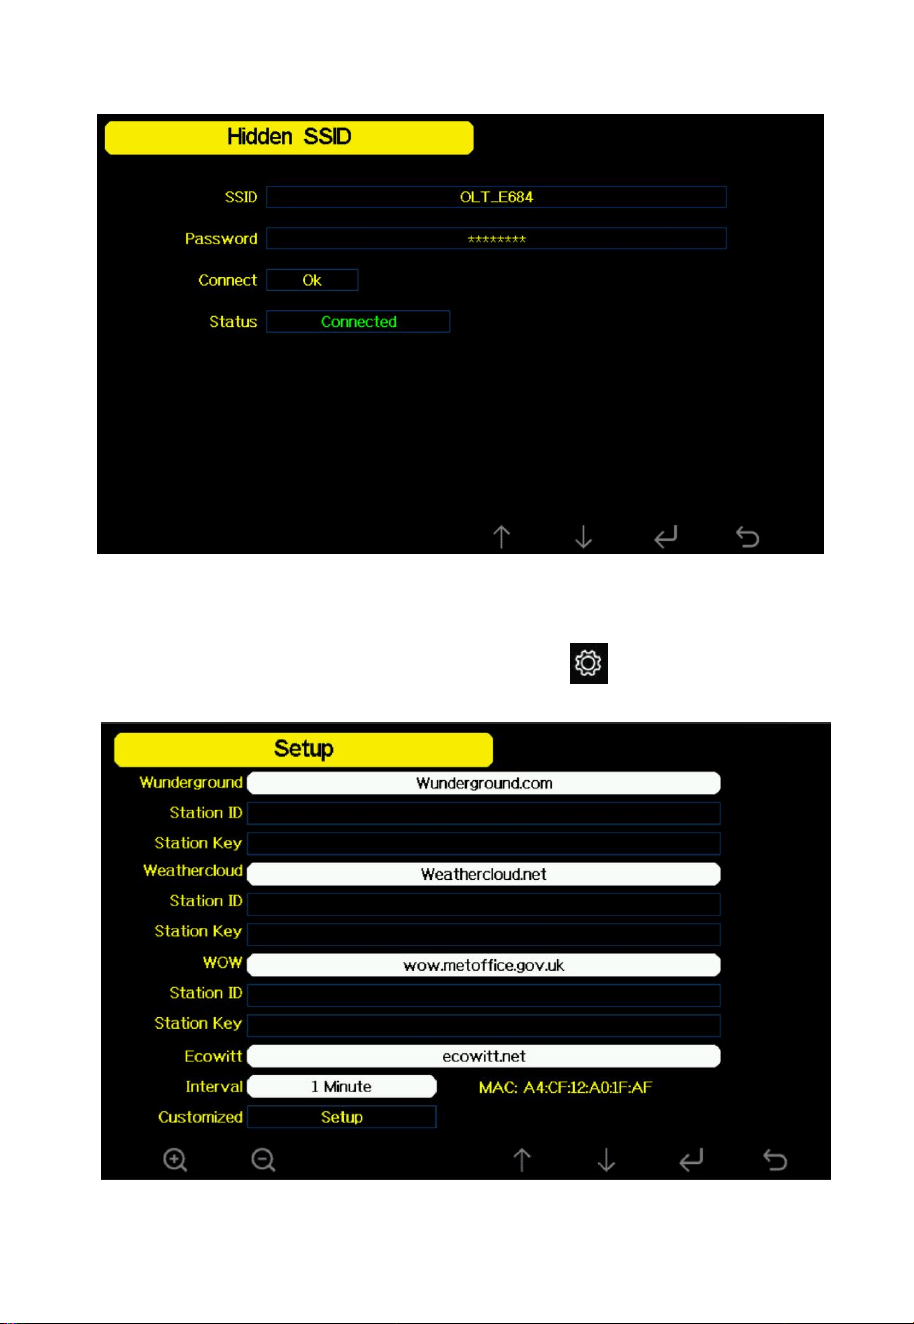
21
Figure 15: Connected to the WiFi Network
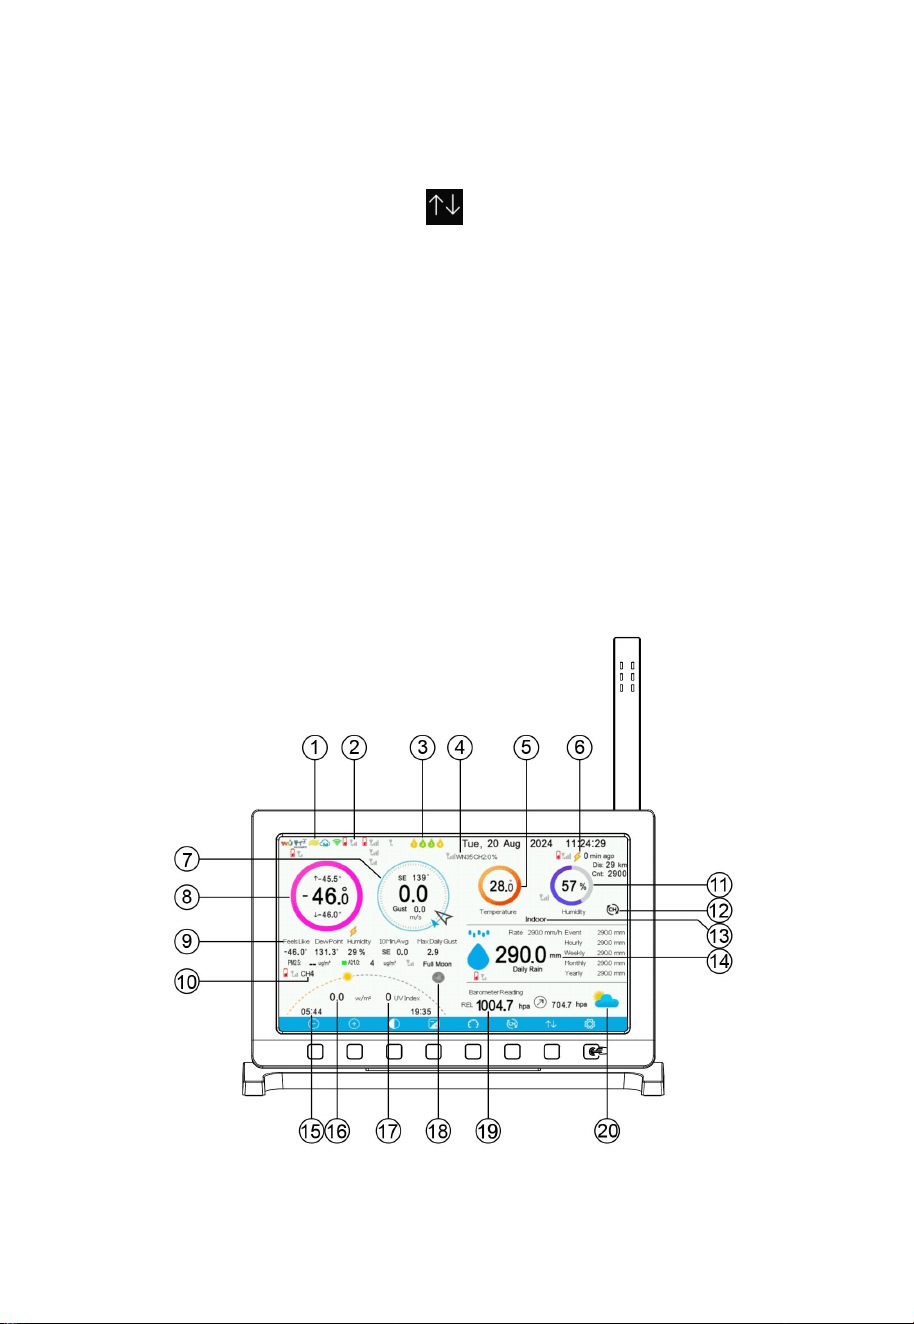
MAC address : On the home screen, touch the button,then select the
“Weather Server” section, the MAC address is displaying.
Figure 16
22
3. User Interface
There are four dashboards: Main screen, Max/Min data, History record
and Graph. You can touch button to select the one you want to
display on the home screen.
3.1 Main screen
The home screen displays various data, including date, weather, moon
phase, indoor/outdoor data, signal strength, and battery level. We
categorize these icons into several groups for easier navigation and
viewing.
3.1.1 Main Icons
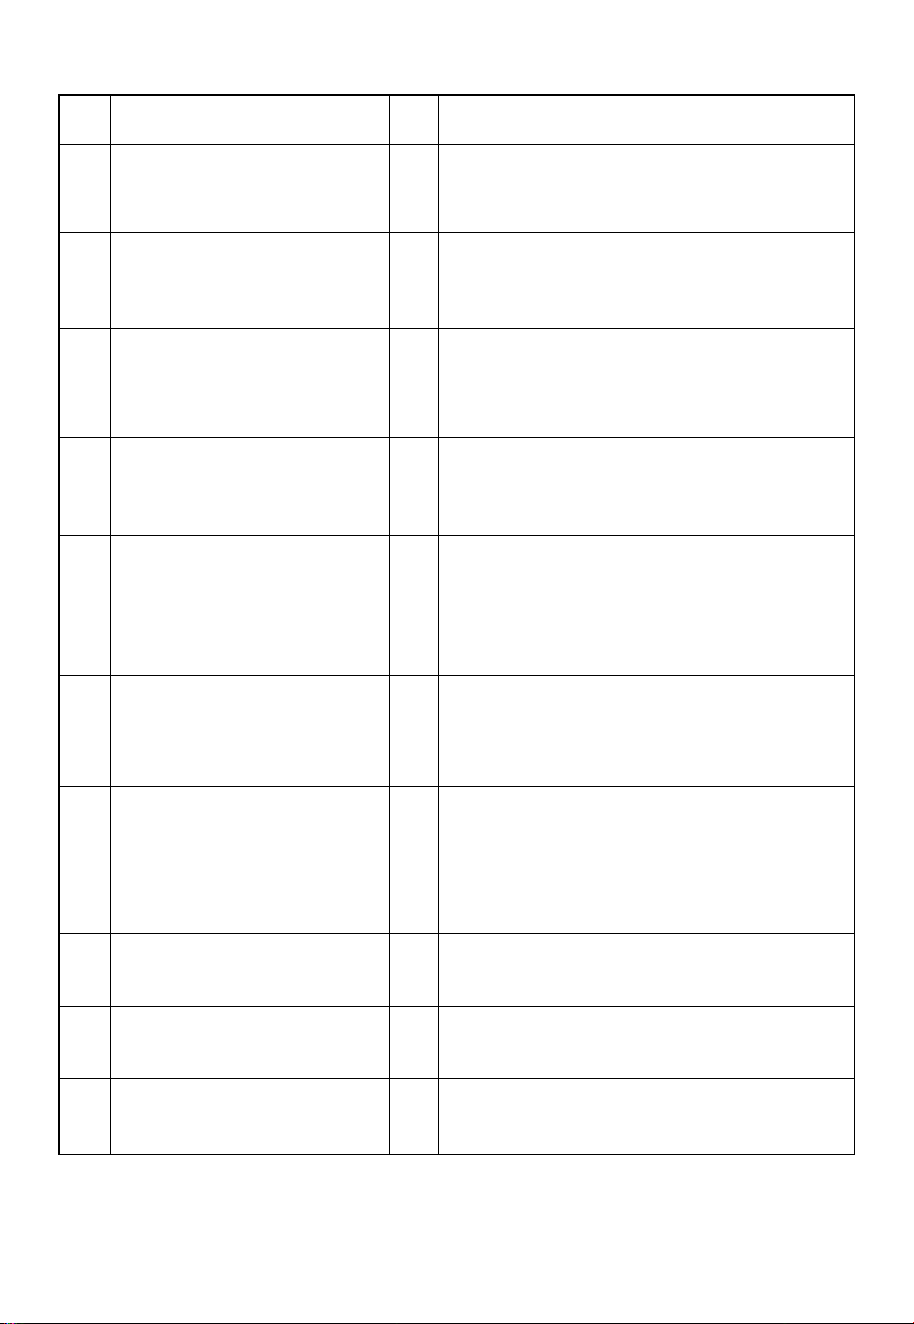
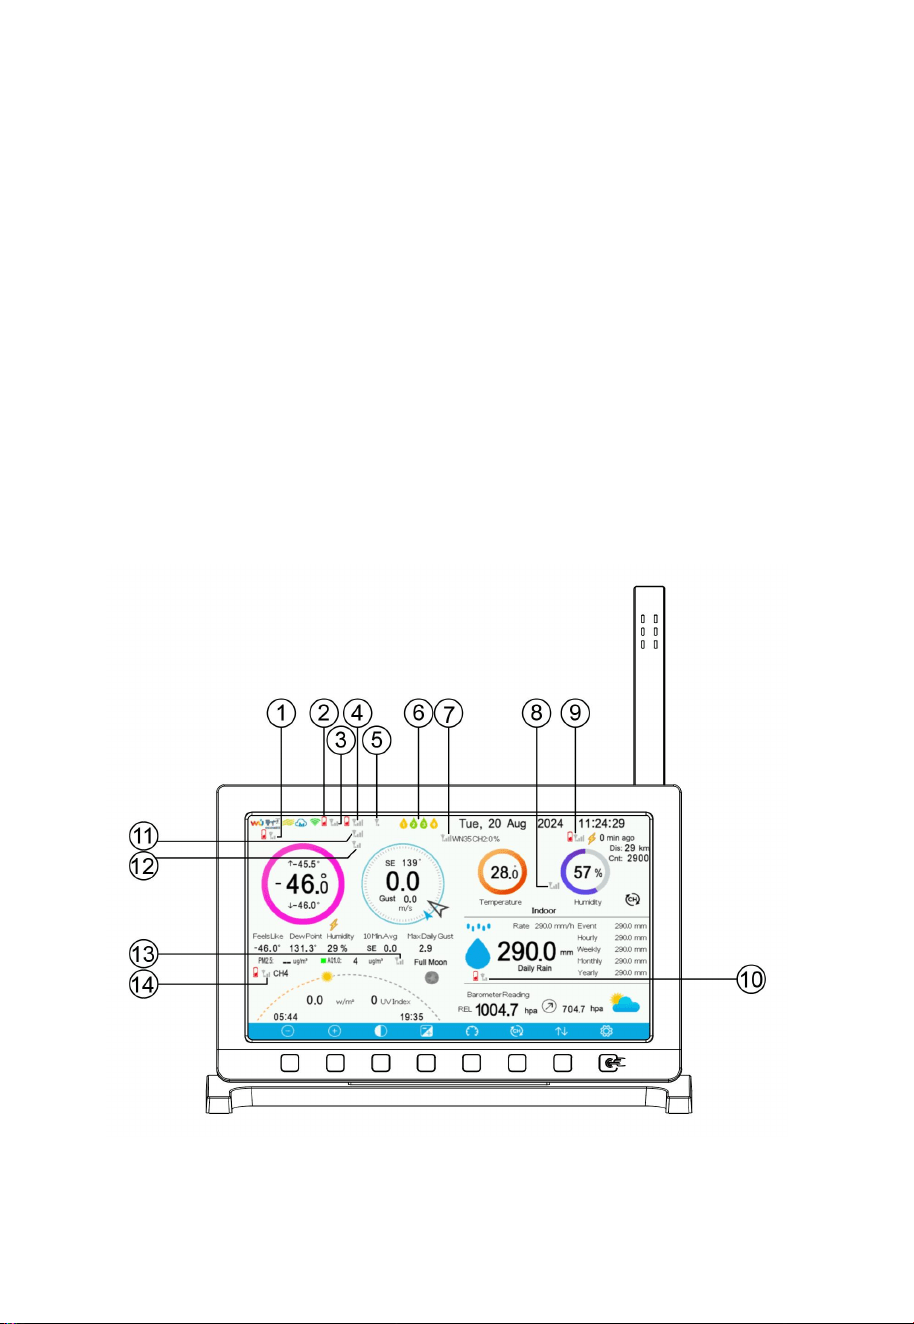
See Figure 17 and 18 to help you identify elements of the console’s
display screen.
Figure 17: Display Console Screen Layout
23
No
Description
No
Description
1
Icons of Weather Services
to which you successfully
uploaded data
2
RF signal bar for outdoor
sensor array
3
Multi-Channel water leak
sensor (optional Sensor)
4
Soil moisture (WH51(L))/WN34S/L
Temperature
/WN35 Leaf Wetness (optional sensor)
5
Indoor temperature
6
Last lightning strikes detected time /
distance ; daily counts (optional sensor)
7
Wind direction/Wind
speed/Gust
8
Outdoor temperature
9
Outdoor Feels Like/Dew
Point/Humidity/10Min.
Average /Max Daily Gust
10
WH41/WH45/WH46 particulate
matter detection sensor cycle display
(optional senors)
11
Indoor humidity
12
Multi-channel temperature and
humidity sensor cycle display mode
icon (optional sensor)
13
Indoor and Multi-channel
temperature and humidity
sensor names (optional
sensor)
14
Rain fall Daily / Event / Hourly / Weekly
/ Monthly / Yearly
15
Sunrise / Sunset Time
16
Solar Radiation
17
UV
18
Moon Phase
19
ABS/REL Barometer
20
Weather forecast
Table 3: Display console detailed items
24
For No.4, if you have purchased the optional WN34S/L Temperature
Sensor, WN35 Leaf Wetness Sensor and WH51(L) Soil Moisture Sensor,
all the data will be displayed in cycling mode.
3.1.2 Transmitter Signal Tower Icons
Check the connection and signal status of each sensor. You can view this
information on the main screen or on the Sensor ID page.
The little transmission tower symbol means that the sensor is registered.
The maximum four bars show how many of the past four data package
transmissions of this sensor were successfully received and processed. They
do not signify signal strength like on a mobile phone but rather indicate
signal quality.If there’s one bar is reduced after reaching full bars, it indicates
that there has been a recent data reception failure.
Figure 18 : Signal tower/signal quality of Sensors
25
No
Description
No
Description
1
WN32 Outdoor
Temperature and Humidity
Sensor
2
Low battery
3
WH65 Sensor Array
4
WS90 Haptic Sensor Array
5
WS80 Sensor Array
6
4 channels for water leak
detection
7
WN34S/L WN35 WH51(L)
Temperature Sensor,Leaf
Wetness Sensor/Soil
Moisture Sensor(Scroll
Display)
8
WN32 indoor WN31 WN37
Temperature and Humidity
Sensor(Scroll Display)
9
WH57 Lightning Detection
Sensor
10
WH40 Rain Collector Rainfall
Sensor
11
WS68 Anemometer with
Light & UV Sensor
12
WS85 3-in-1 Wind-Rainfall
Sensor
13
WH45/WH46 5-in-1/7-in-1
Air Quality Sensor
14
WH41 WH43 PM2.5 Air
Quality Sensor (Scroll Display)
Table 4: Signal tower/ signal quality
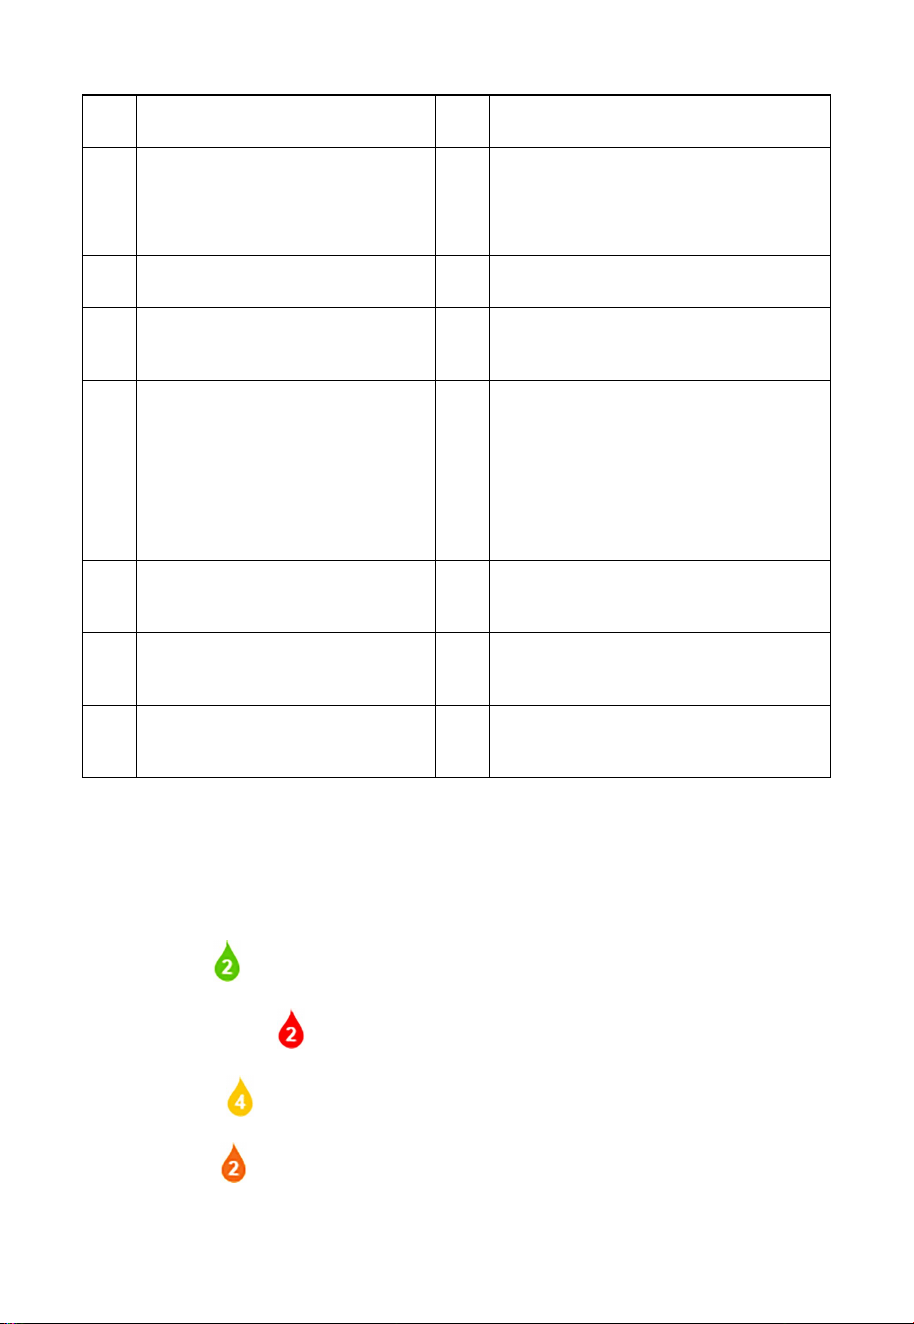
Note: If you have purchased the optional WH55 water leak sensor, please
check the following instructions for the display color:
Green - normal
Red & Flash - leaking
Yellow - low battery alert
Orange - offline over 10 mins
26
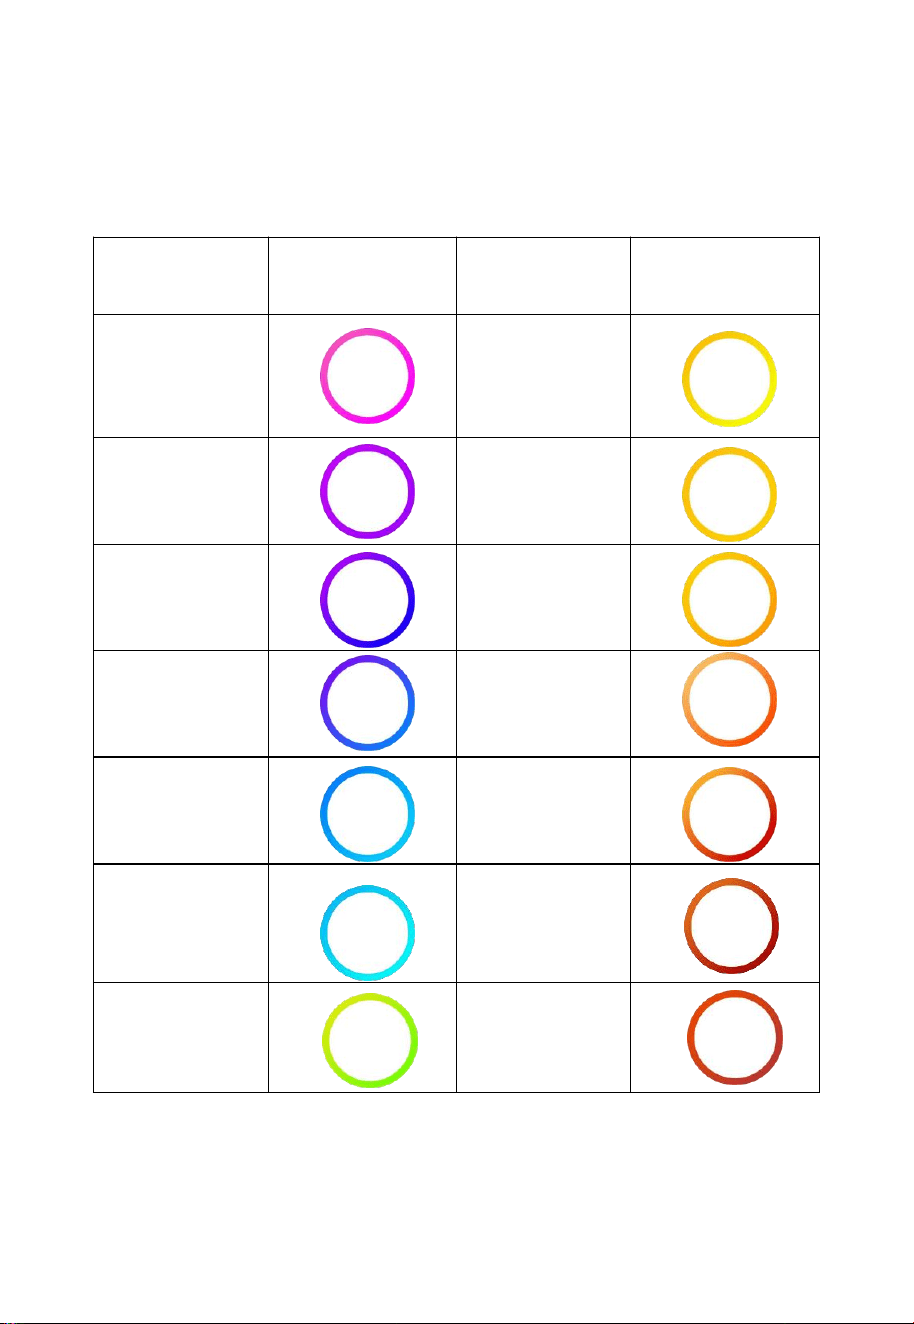
3.1.3 Temperature/Humidity/Wind direction/Rainfall
icons
1) Outdoor Temperature Icon
Temperature
Range (degF)
Color Ring
Temperature
Range (degF)
Color Ring
< -10
50.1 to 60
-10 to 0
60.1 to 70
0.1 to 10
70.1 to 80
10.1 to 20
80.1 to 90
20.1 to 30
90.1 to 100
30.1 to 40
100.1 to 110
40.1-50
> 110
Table 5
27
Note: Max/Min values of outdoor temperature: Max outdoor
temperature , Min outdoor temperature .
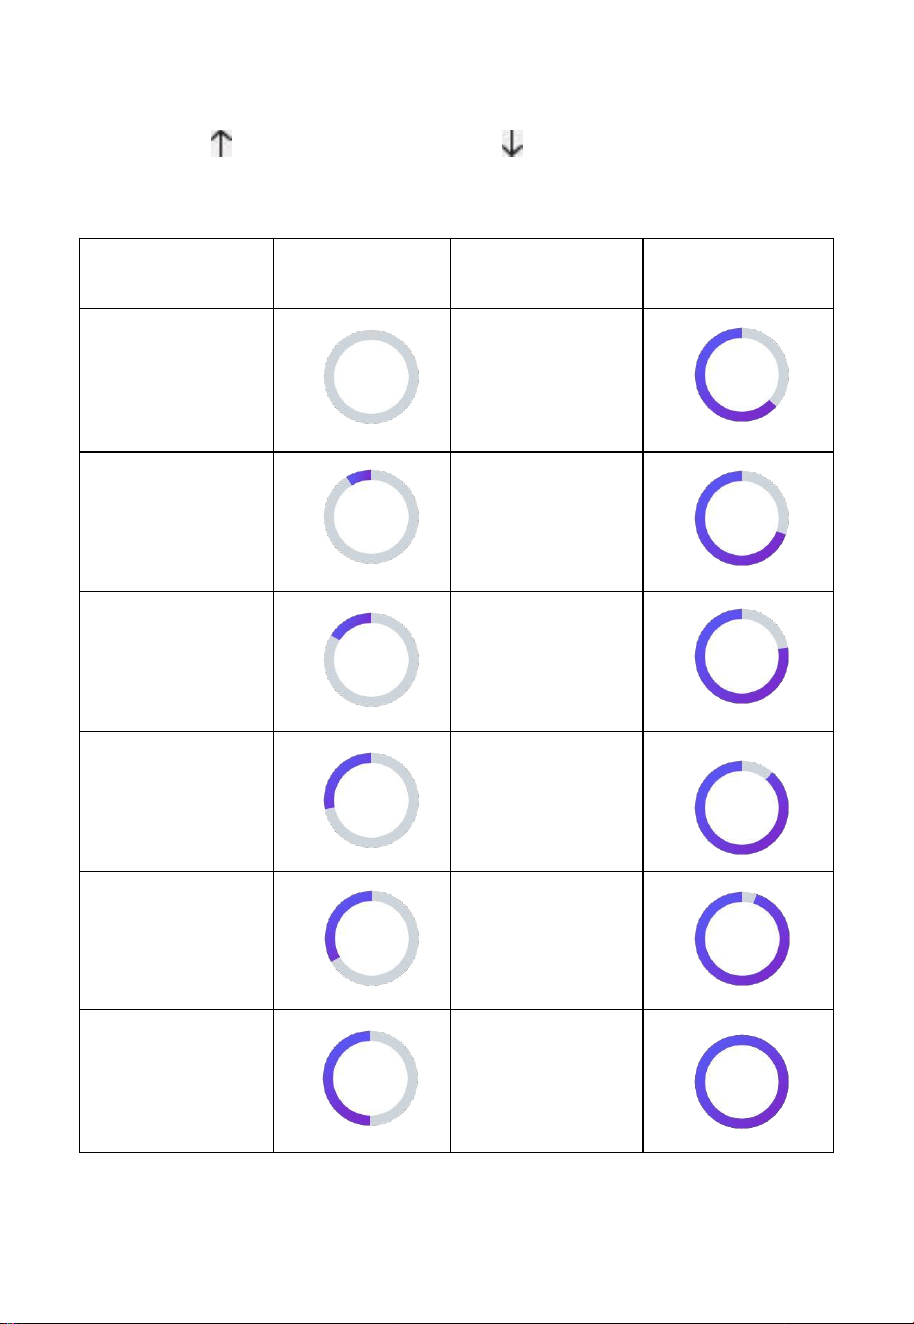
2) Indoor Humidity Icon
Humidity
Range (%)
Color Ring
Humidity
Range (%)
Color Ring
0%, No signal or
dashes
51 to 60
1 to 10
61 to 70
11 to 20
71 to 80
21 to 30
81 to 90
31 to 40
91 to 99
41 to 50
100%
Table 6
28
3) Wind Direction Icon
Current wind direction indication , 10-minute average wind
direction indication .
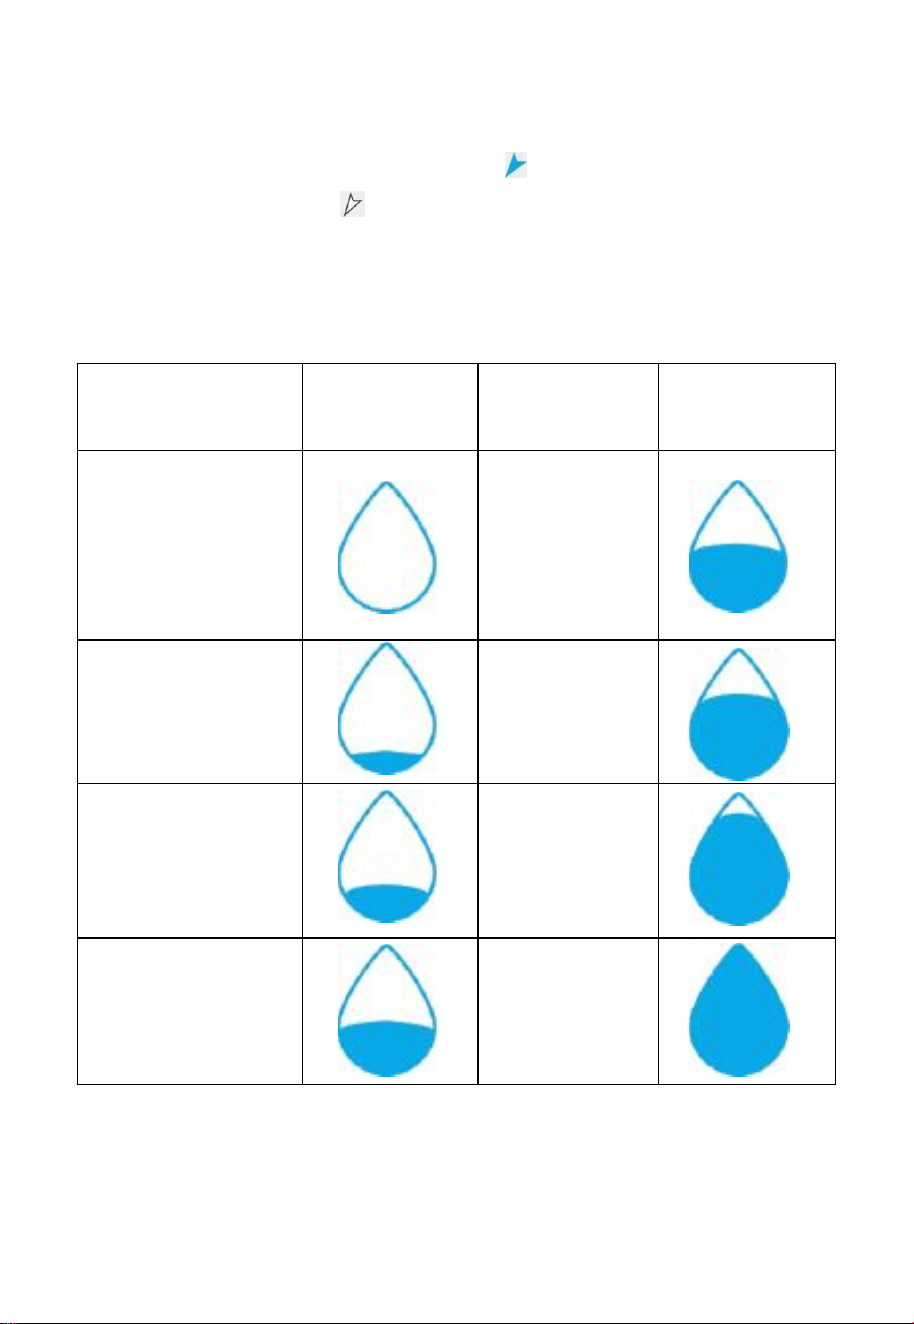
4) Hourly Rainfall Icon
Table 7
Hourly Rain (in)
Color Ring
Hourly
Rain (in)
Color Ring
0.0
0.6 to 0.8
0 to 0.2
0.8 to 1
0.2 to 0.4
1 to 1.2
0.4 to 0.6
1.2 to 1.4
29
3.1.4 Weather Forecasting/Moon Phase Icons
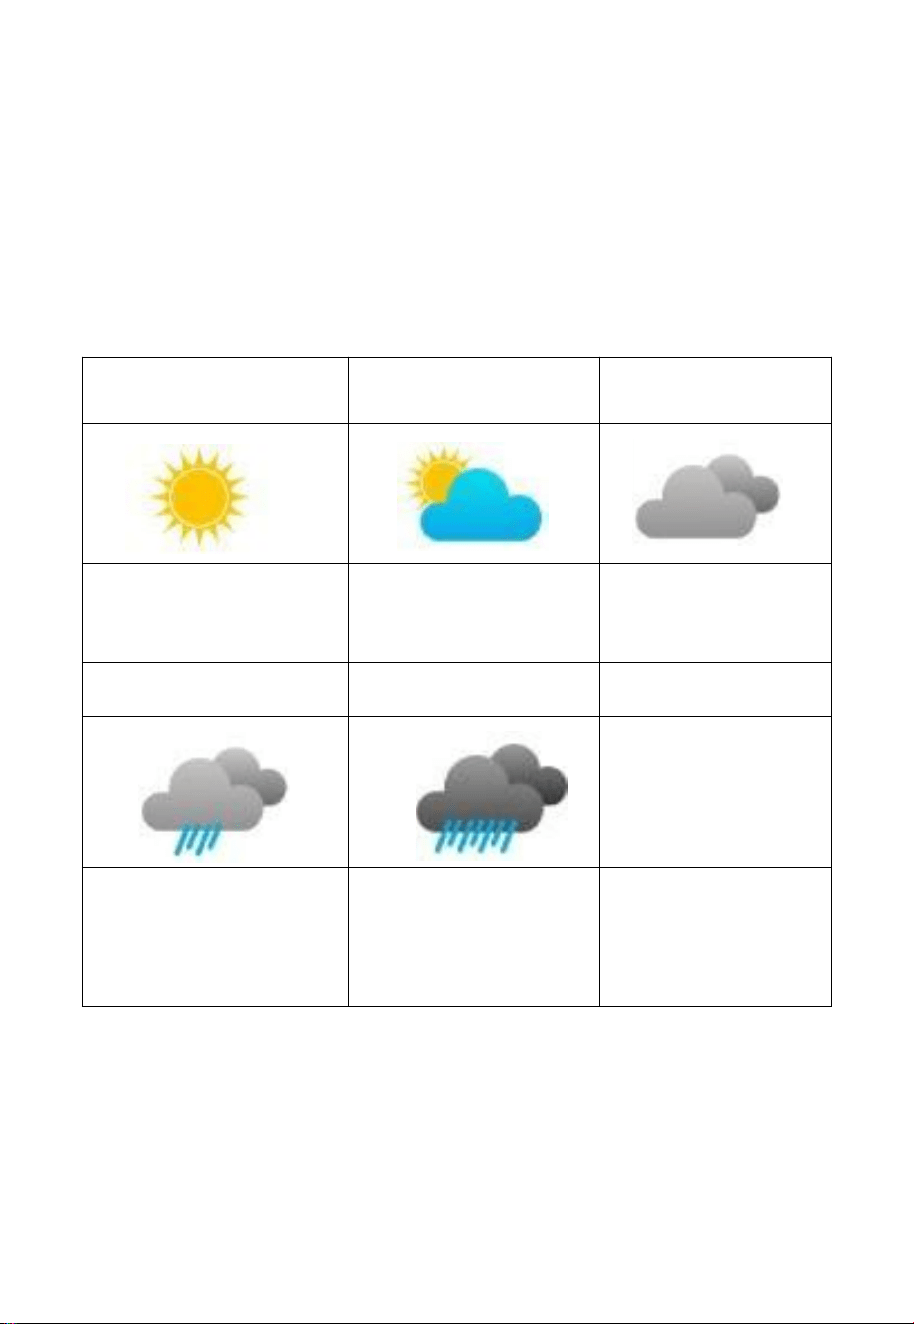
1) Weather Forecasting
This weather forecast provides a prediction for the upcoming 24 hours.
The forecast icon is based on the rate of change of barometric pressure.
Please allow at least one month for the weather station to learn the
barometric pressure over time.
Sunny
Partly
Cloudy
Cloudy
Pressure increases for a
sustained period of time
Pressure increases
slightly
or initial power up
Pressure decreases
slightly
Rainy
Stormy
Pressure decreases for a
sustained period of
time
Pressure rapidly
decreases
Table 8
In general, if the rate of change of pressure increases, the weather is
generally improving (sunny to partly cloudy). If the rate of change of
pressure decreases, the weather is generally degrading (cloudy, rainy or

30
stormy). If the rate of change is relatively steady, it will read partly
cloudy.
The reason the current conditions do not match the forecast icon is
because the forecast is a prediction 24-48 hours in advance. In most
locations, this prediction is only 70% accurate and it is a good idea to
consult the National Weather Service for more accurate weather forecasts.
In some locations, this prediction may be less or more accurate. However,
it is still an interesting educational tool for learning why the weather
changes.
As the forecast is based on pressure changes alone, modifying
components like inversions or jet stream changes cannot be noticed and
considered by the weather station. Only satellites or weather balloons
could do this.
The National Weather Services (and other weather services such as
Accuweather and The Weather Channel) have many tools at their
disposal to predict weather conditions, including weather radar, weather
models, and detailed mapping of ground conditions.
31
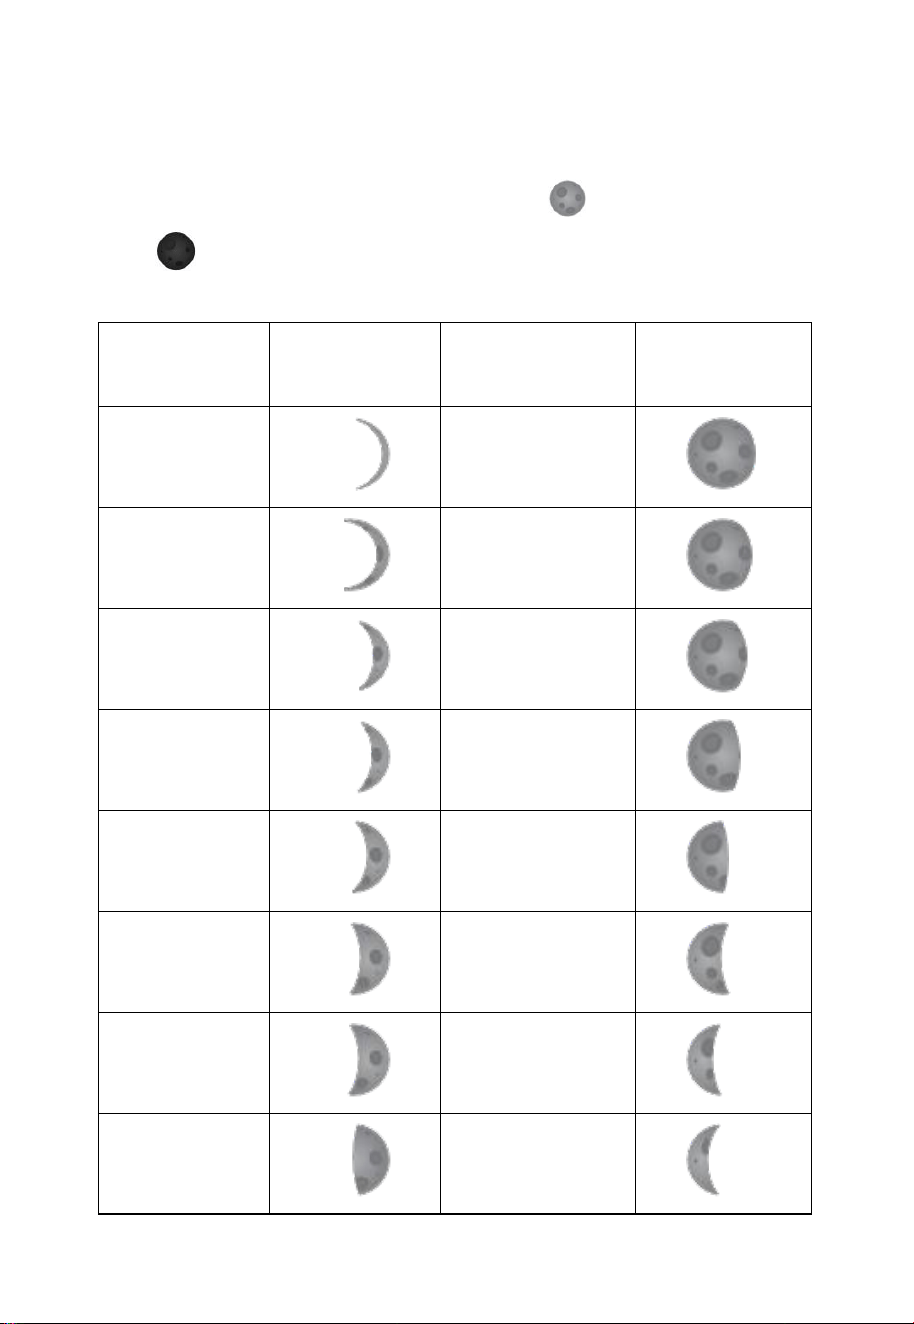
2) Moon Phase
The moon phase chart is displayed according to the moon phase
percentage breakdown. The Full Moon shows ,and the New Moon
shows .
Moon Phase
percentage
Image
Moon Phase
percentage
Image
1.38%-->5%
96%-->86%
5%-->13%
86%-->77%
13%-->21%
77%-->69%
21%-->29%
69%-->61%
29%-->37%
61%-->53%
37%-->45%
53%-->45%
45%-->53%
45%-->37%
53%-->61%
37%-->29%
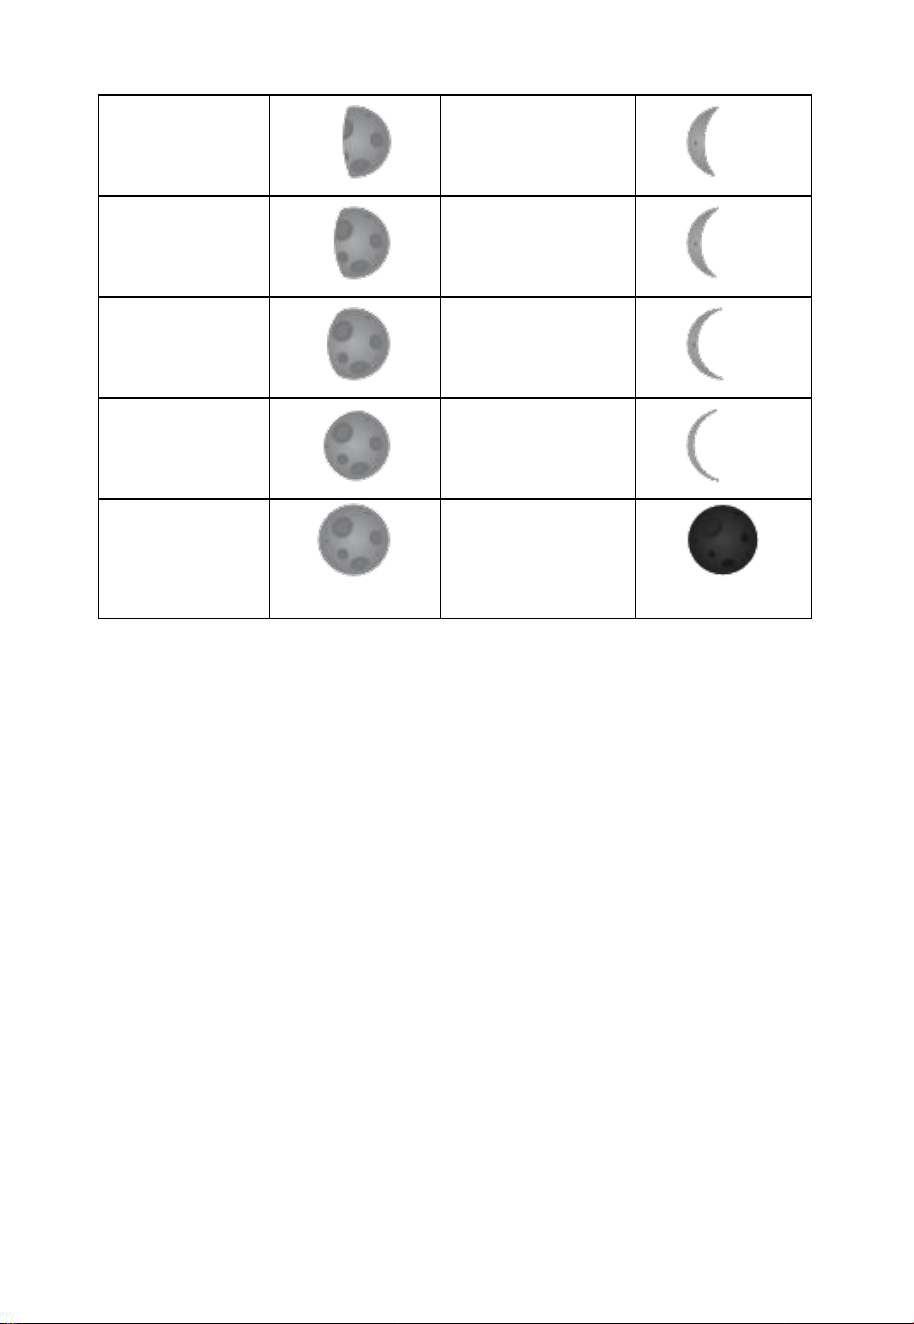
32
Table 9:Moon Phase
61%-->69%
29%-->21%
69%-->77%
21%-->13%
77%-->86%
13%-->5%
86%-->96%
5%-->1.38%
96%-->100%
100%-->96%
Full Moon
0%-->1.38%
1.38%-->0%
New Moon
33
3.1.5 Beaufort Wind Force Scale
If you have selected the use of Beaufort wind speed units, you can use the
Table 10 below for reference. The Beaufort scale is based on qualitative
wind conditions and how they would affect a ship’s (frigate) sails (so yes,
it is an “old” standard). It is therefore less precise than the other scales
but is still in use in various locales.
Wind speed
Beaufort number
Description
0 - 1 mph, or 0 - 1.6 km/h
0
Calm
1 - 3 mph, or 1.6 - 4.8 km/h
1
Light air
3 - 7 mph, or 4.8 - 11.3 km/h
2
Light breeze
7 - 12 mph, or 11.3 -1 9.3 km/h
3
Gentile breeze
12 - 18 mph, or 19.3 - 29.0 km/h
4
Moderate breeze
18 - 24 mph, or 29.0 - 38.6 km/h
5
Fresh breeze
24 - 31 mph, or 38.6 - 49.9 km/h
6
String breeze
31 - 38 mph, or 49.9 - 61.2 km/h
7
Near gale
38 - 46 mph, or 61.2 - 74.1 km/h
8
Gale
46 - 54 mph, or 74.1 - 86.9 km/h
9
Strong gale
55 - 63 mph, or 88.5 - 101.4 km/h
10
Storm
64 - 73 mph, or 103 - 117.5 km/h
11
Violent storm
74 mph and above, or 119.1 km/h
and above
12
Hurricane
Table 10: Beaufort wind force scale
34
3.1.6 Lightning Alert
The lightning icon will appear if the Dew Point exceeds 70 °F. This
means there is a chance of lightning storms forming.
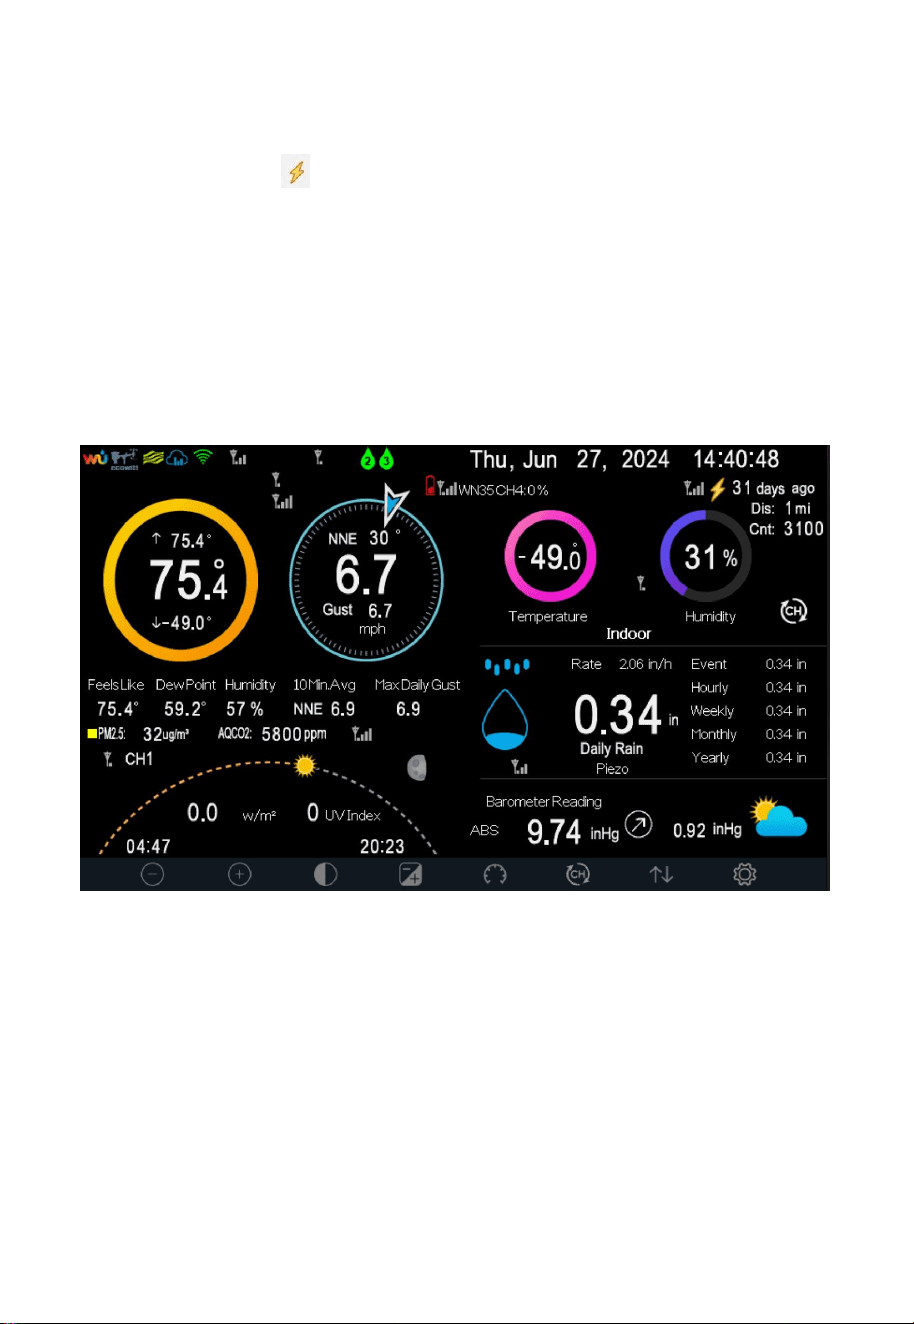
3.1.7 Background (dark/light) Themes
Immediately after power up (inserting USB power supply), the unit will
turn on the display, and the unit will start to look for reception of the
indoor and outdoor sensor data. This may take up to 3 minutes.
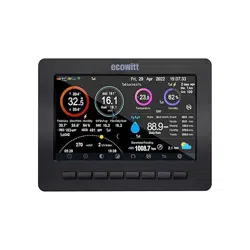
Figure 19: Dark Background Display
35
Figure 20: Light Background Display
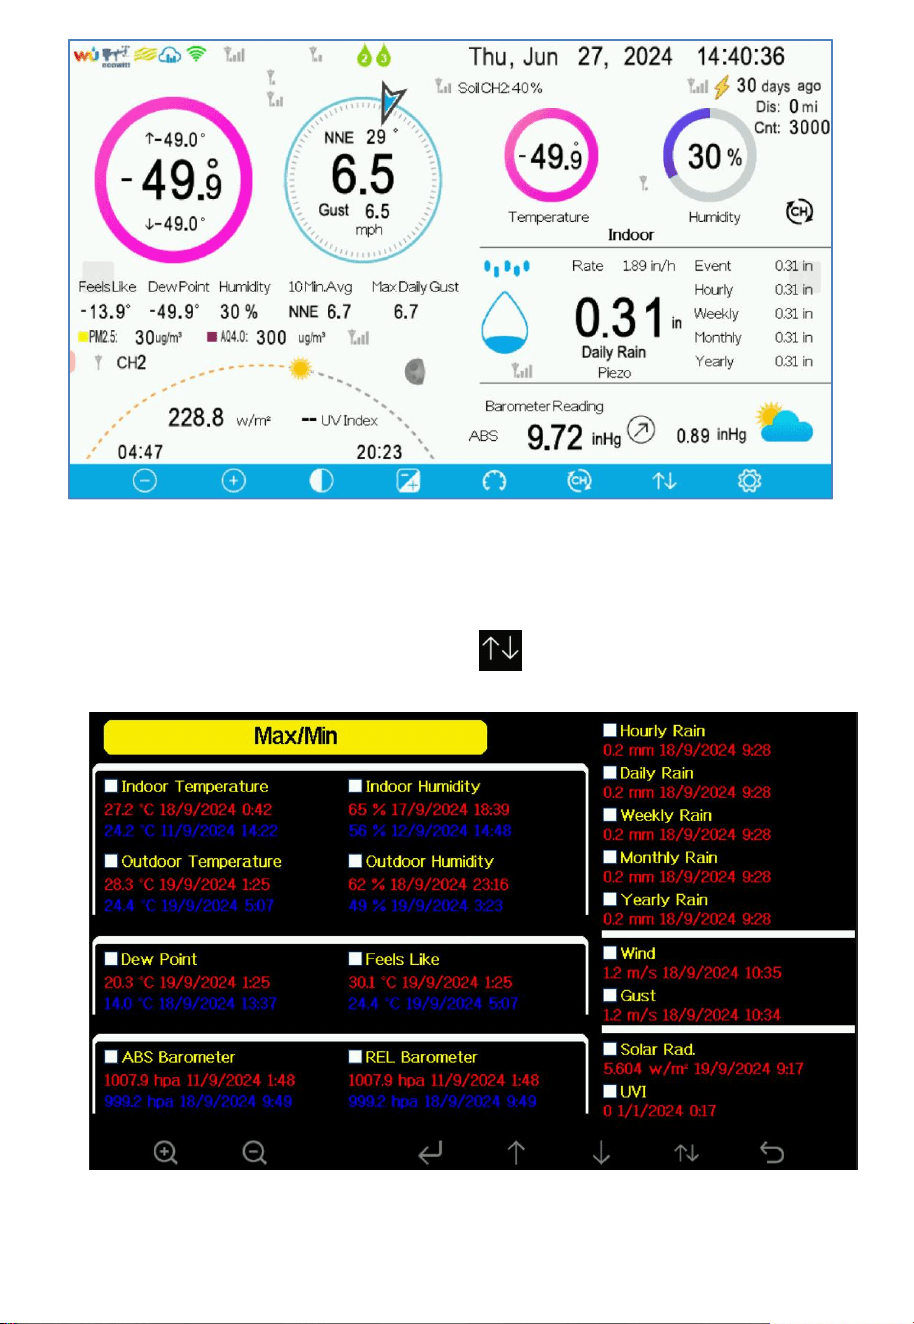
3.2 View and Reset MAX/MIN
While in the home screen, touch the button once to view and
reset minimum and maximums.
Figure 21 : Max/Min Screen
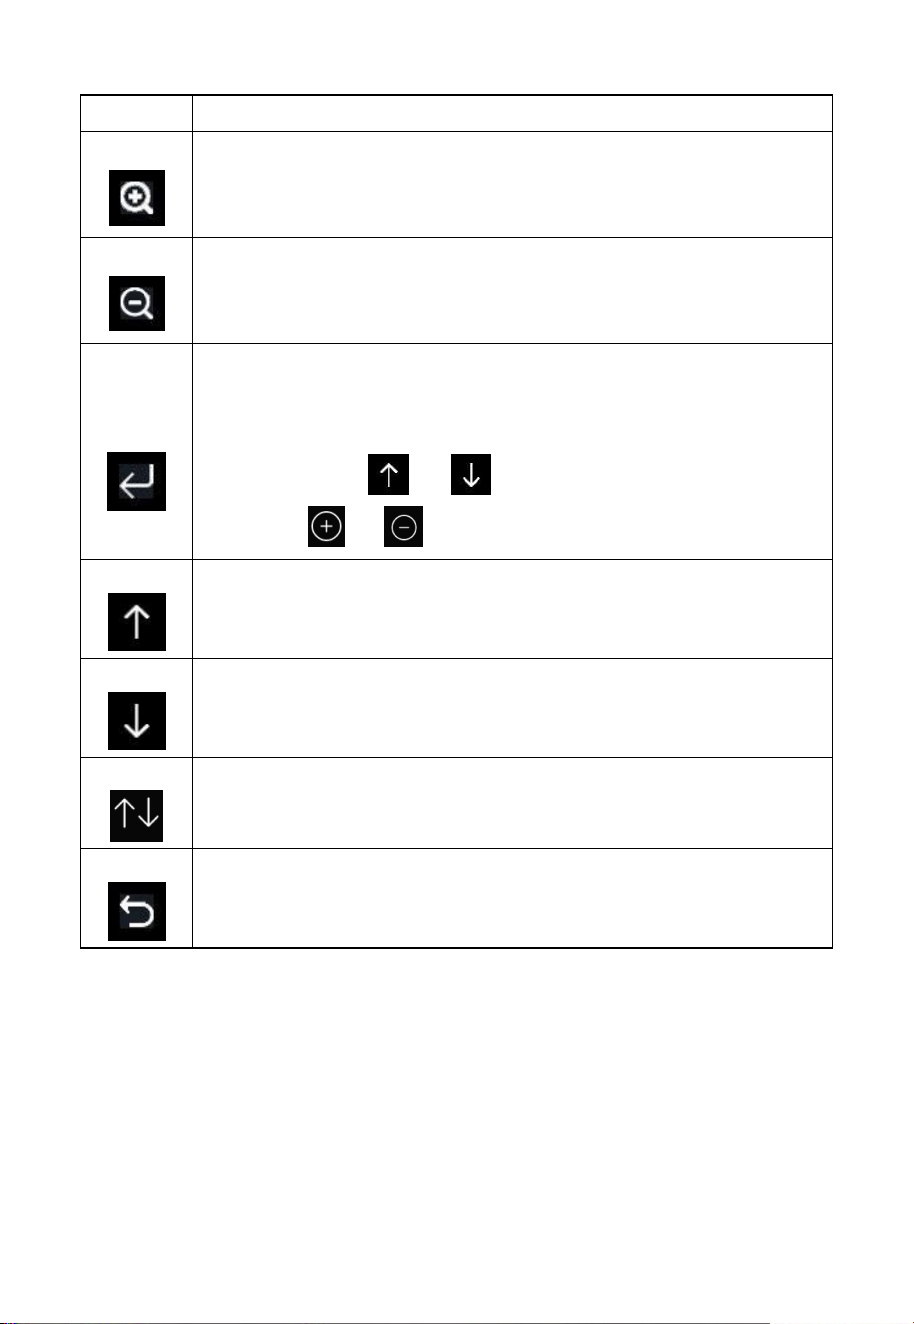
36
Icon
Description
Selection button
Touch this button to select the weather MAX/MIN record
which need to clear.
Selection button
Touch this button to select the weather MAX/MIN record
which need to clear.
Enter button
While the desired weather MAX/MIN record selected, touch
this button to popup Message Box “Clear the Max/Min
record?”.Touch or button to select YES or NO.
Touch the or button to confirm the selection.
Up arrow button
Touch this button to change the activated option field.
Down arrow button
Touch this button to change the activated option field.
History button
Touch this button to select History data display.
Return button
Touch this button to return to normal display mode.
Table 11

37
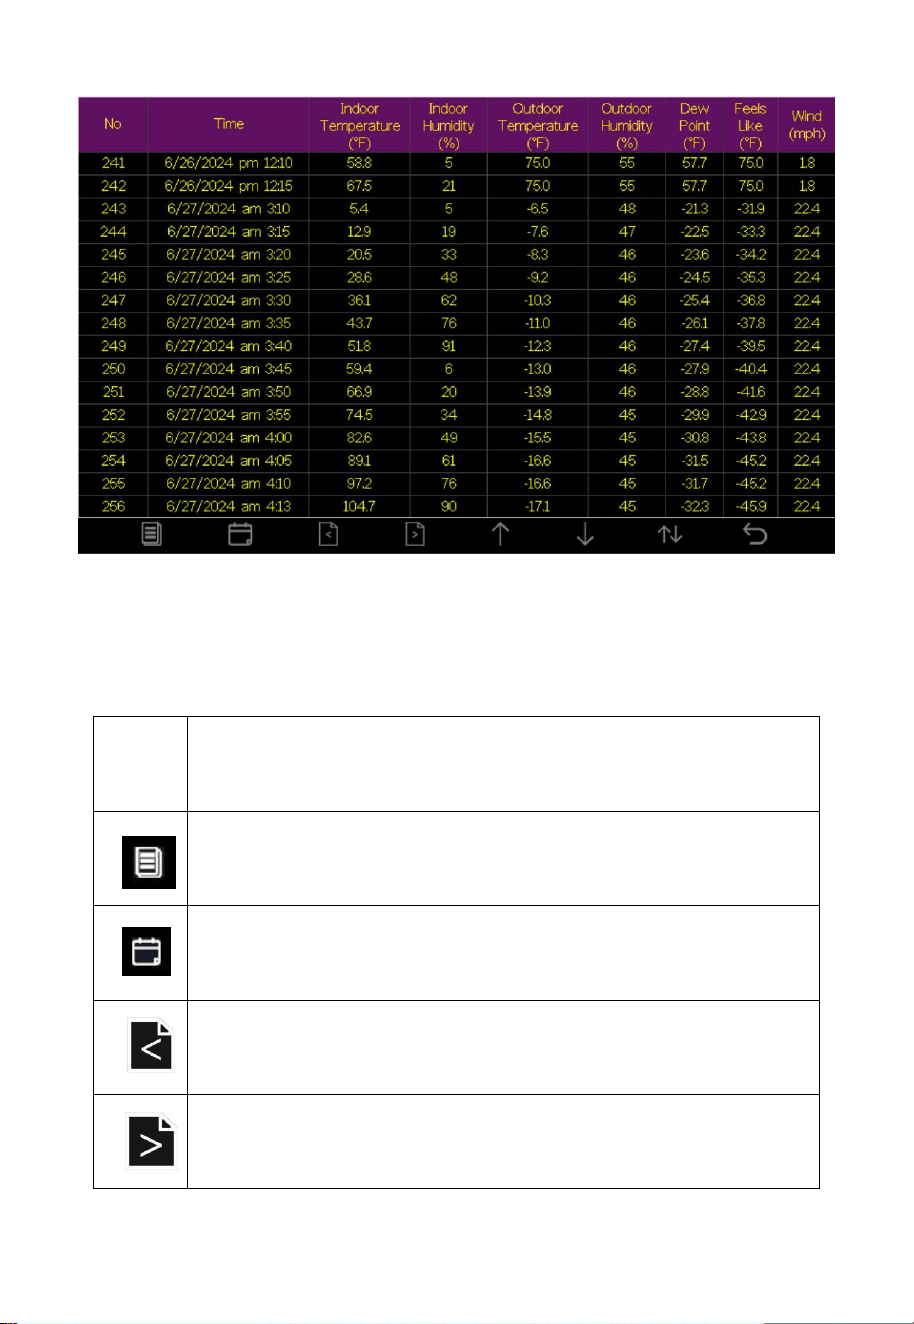
3.3 History Record
While in normal display, touch the button twice to enter History
Record Mode.
In History mode only data saved to the console memory can be seen.
When that memory is full, the oldest record will be overwritten. These
are only the basic weather data like wind, rain, temperature, humidity,
pressure, solar and UVI. Extra sensor data are not stored in the internal
memory. They will, together with the basic data, be archived on an SD
card if one is present. They cannot be displayed on the console but can be
downloaded from the SD card as CSV (comma separated values) files
and processed in a spreadsheet application.
Note: The console can store historical data on a memory card. This
memory card is not included. If you want to use this function, you will
need a micro SD memory card. The supported max capacity of the card is
32G (Format: FAT32). A 1GB card will store more than 10 years of data,
so you do not need a very large capacity card. There is also no
requirement on the speed class of this card as data writing happens
infrequently and is not speed critical.
If you need an SD card larger than 32G,use the Rufus tool to format the
SD card to FAT32. Download the tool from https://rufus.ie/en/.
38
Figure 22: History record Screen
Icon
Description
File Select button
Touch this button to clear all history record.
Page Select button
Touch this button to enter particular page of the history data.
Each page contains 16sets data.
Page up button
Touch this button to switch the columns of data to be viewed.
Page up button
Touch this button to switch the columns of data to be viewed.
39
Page up button
Touch this button to scroll up the page you are viewing.
Page down button
Touch this button to scroll down the page you are viewing.
History button
Touch this button to select the Max/Min record or History.
Return button
Touch this button to return to previous mode.
Table 12
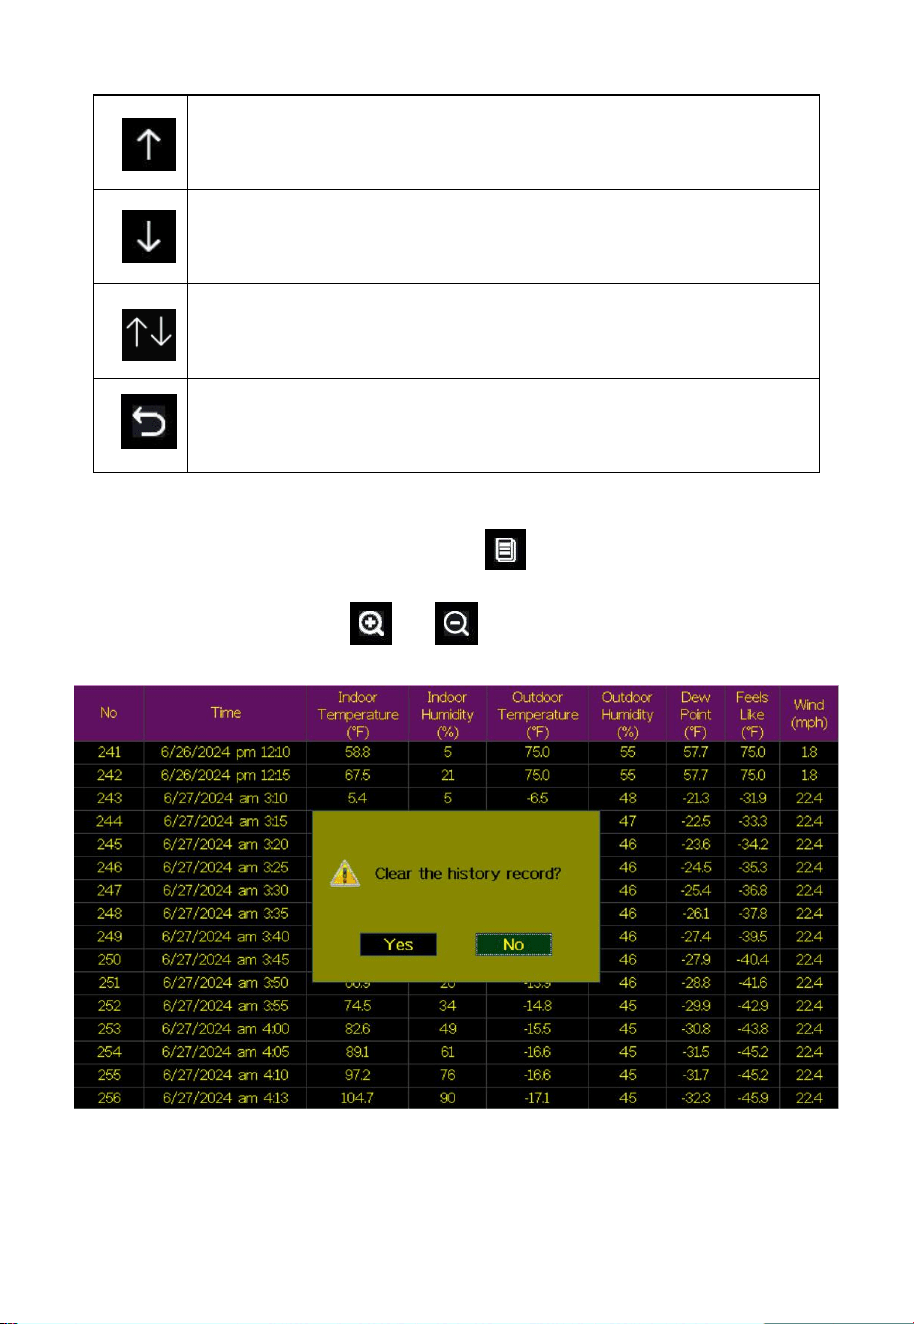
While in History Record Mode, touch button to popup the Message
Box: “Clear the history record?” Touch “Yes” to clear all history records
saved on console. Touch or button to return to History record
Mode.
Figure 23: Clear History Record Screen
40
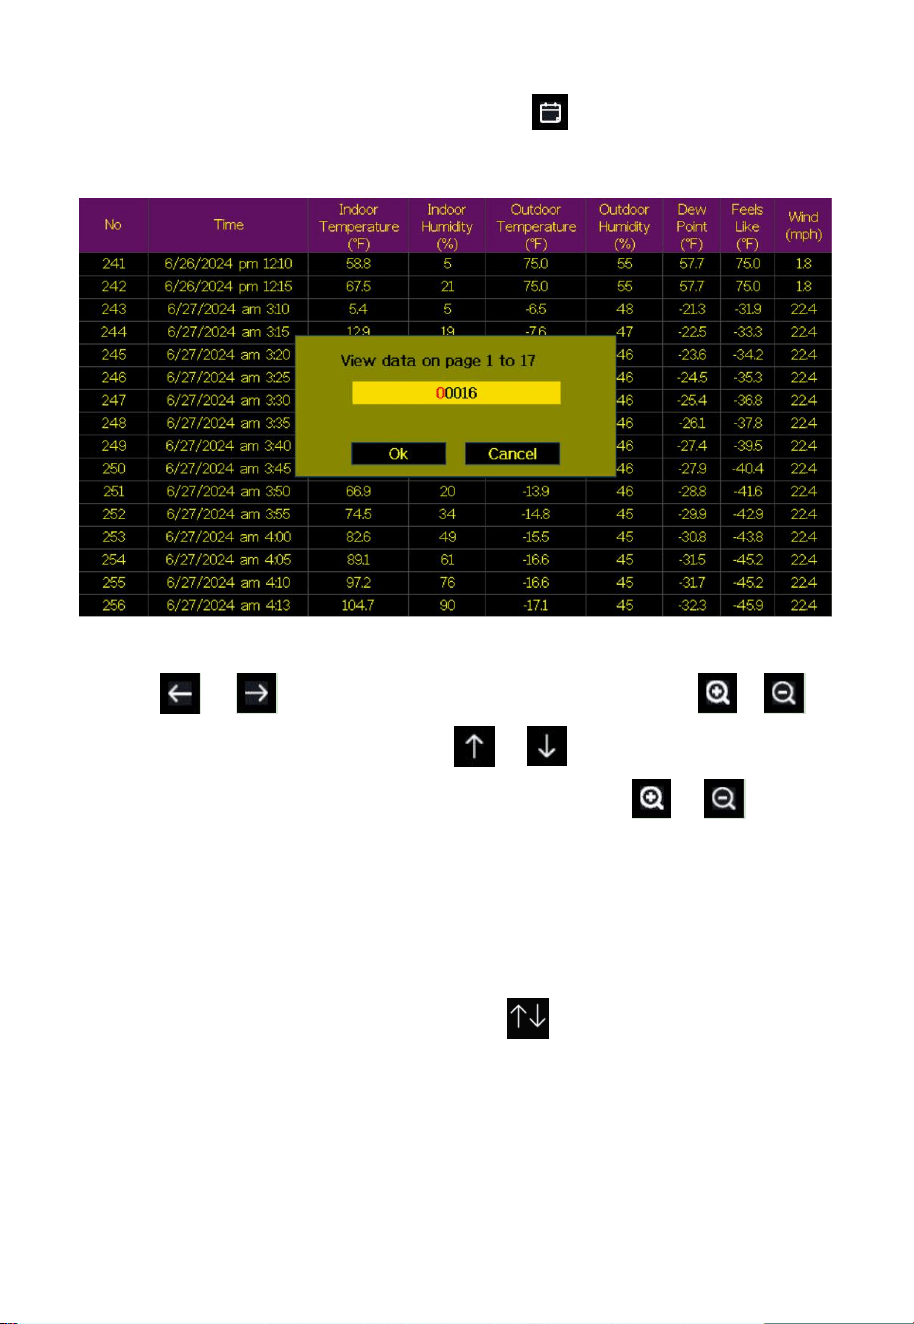
While in History Record Mode, touch the button to enter the page
selection mode:
Figure 24: View a specific page of history Screen
Touch or button to select a digit in a number, touch or
button to change the number. Touch or button to change the
activated option field, toggle OK or Cancel then touch or button
to confirm.
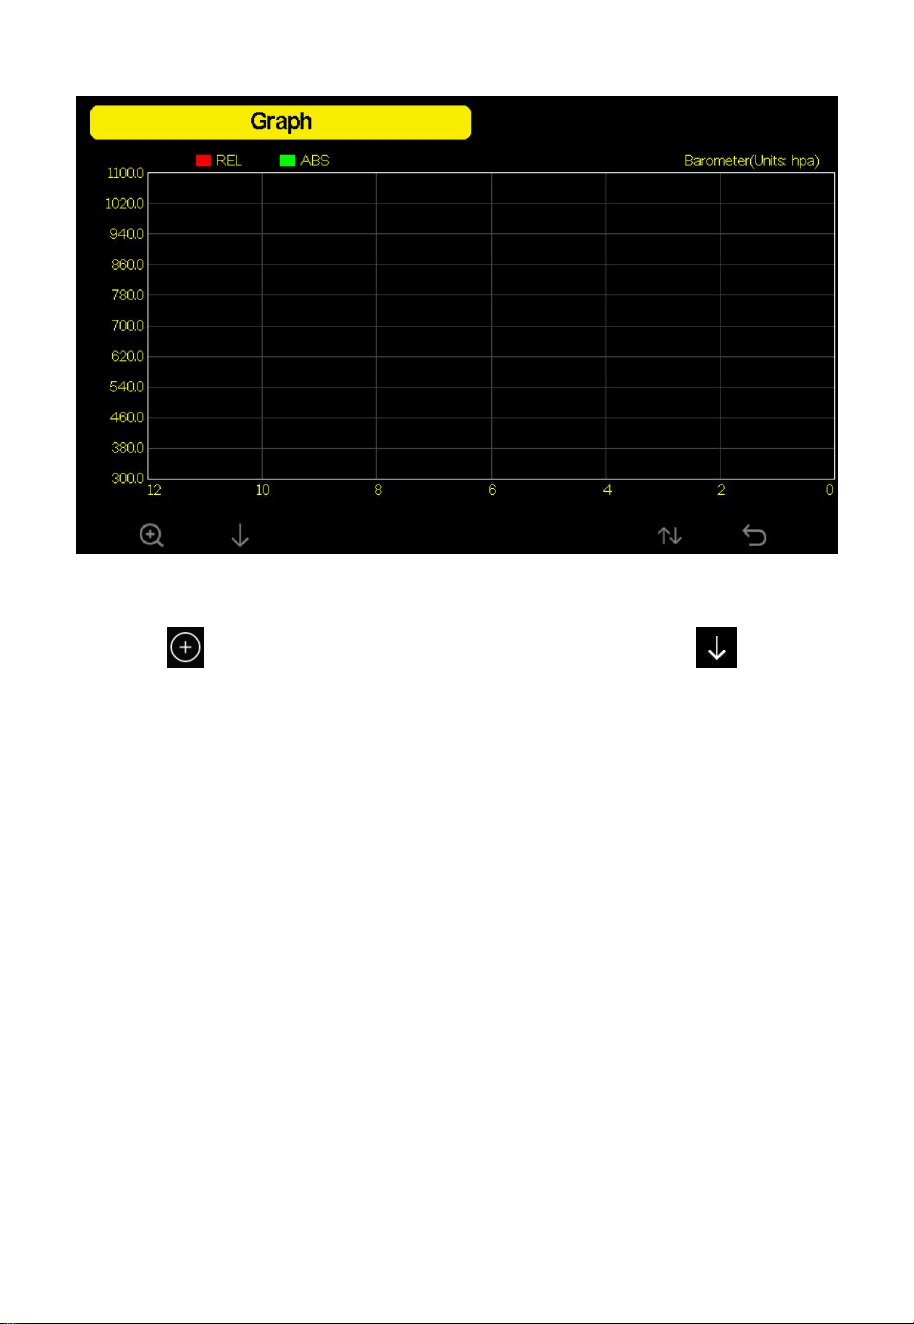
3.4 Graph Mode
While in History Record Mode, touch the button once to enter
Graph Mode.
41
Figure 25: Graph mode
Touch to shift the data display of 12/24/48/72H. Touch to
view the graph of the following data:
Indoor Outdoor temperature
Dew Point and Feels like
Indoor Outdoor humidity
Wind speed and Gust
Wind Direction
UVI
Solar Radiation
Rainfall hourly and daily
Barometer (REL & ABS)
42
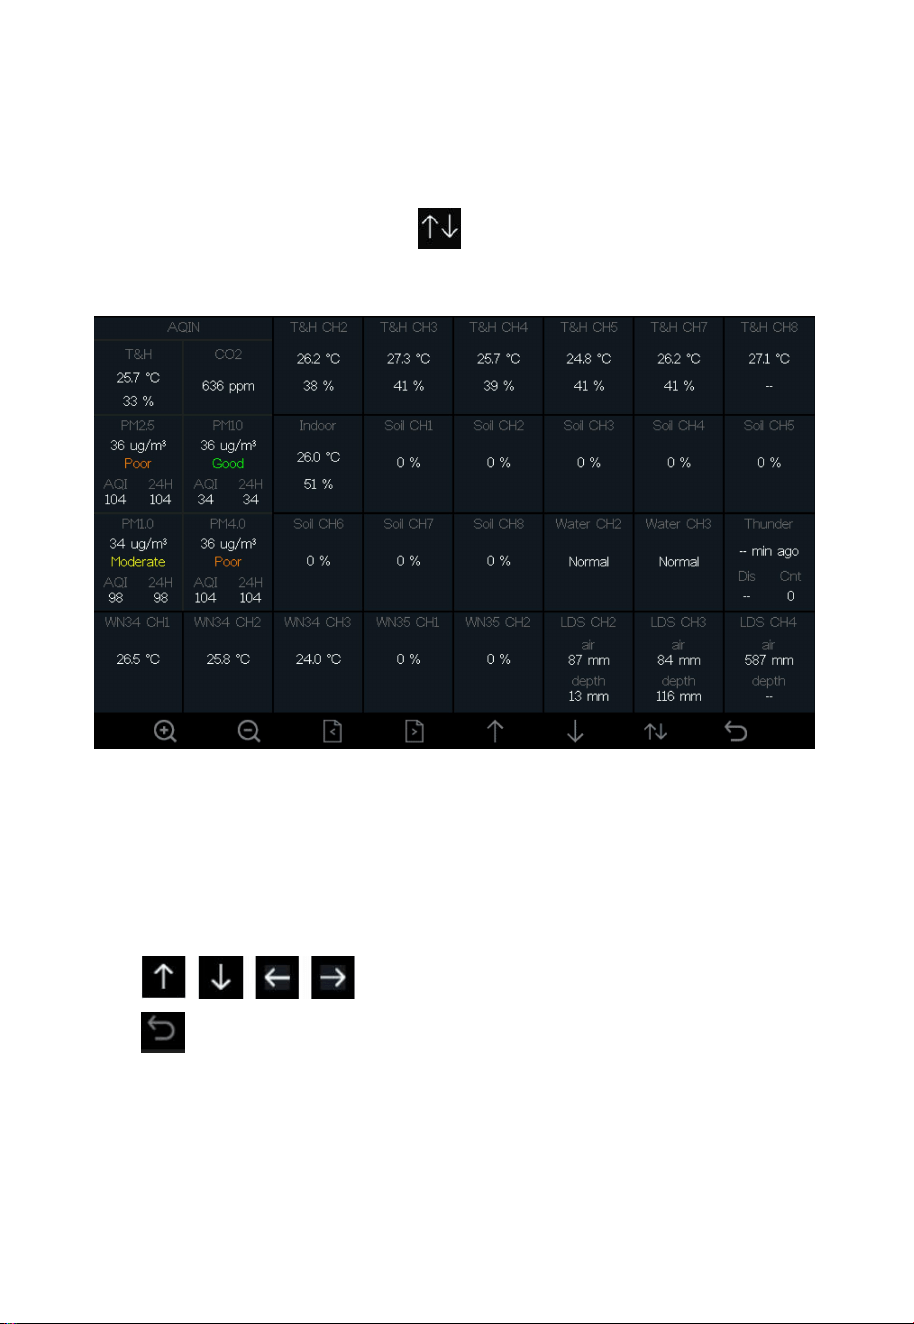
3.5 Optional Sensor Display Mode
To view the full display of multi-channel sensors you can do this:
While in Graph Mode, touch the button once to enter Optional
Sensor Display Mode.
Figure 26: Optional sensor display
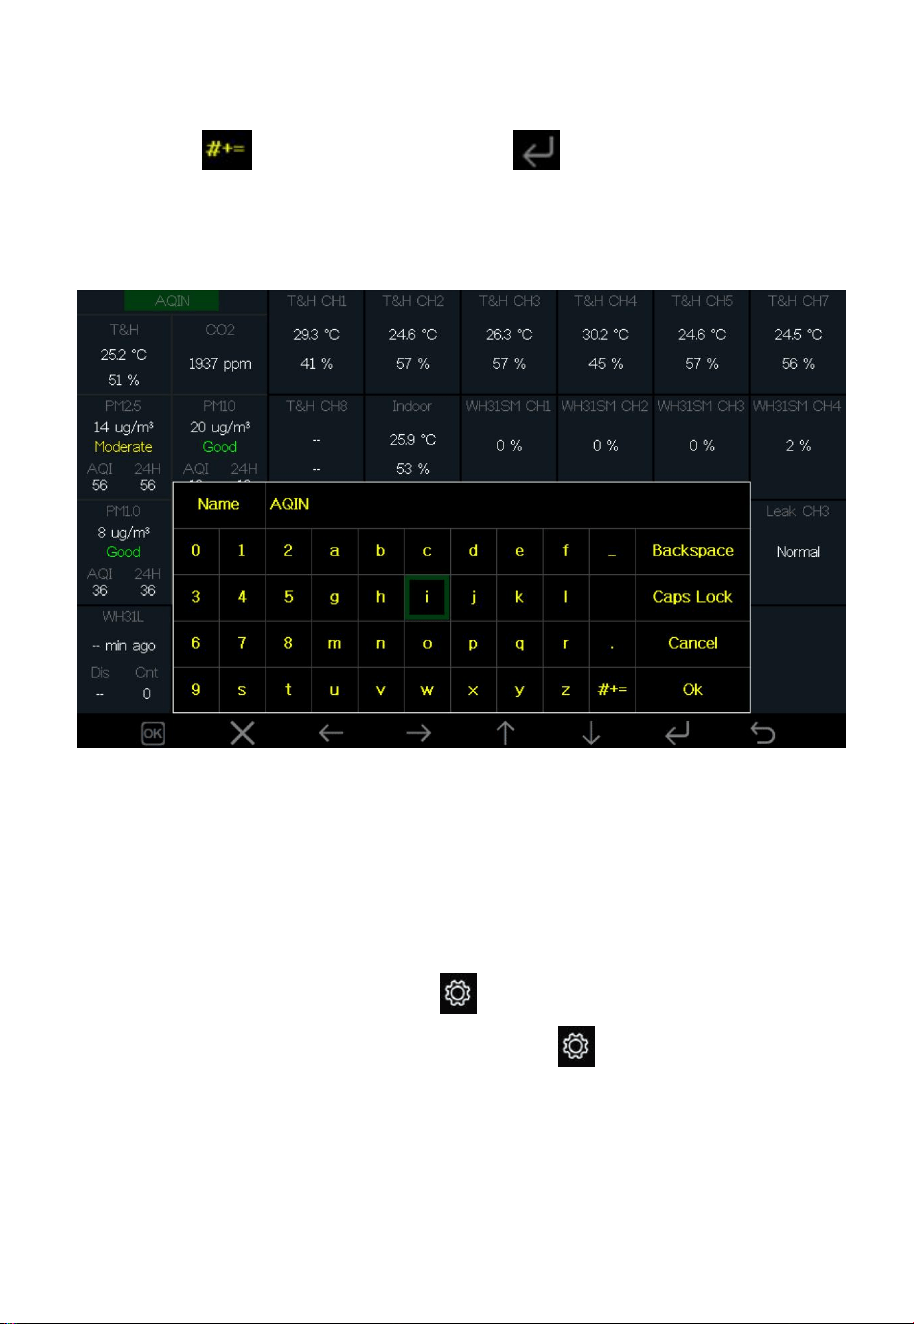
Note: Channel names can be edited on this page.
Touch the up or down button to select the channel, then touch the
plus or minus button to display the keyboard. Touch the one of the
button to select the character, then touch the
button to confirm it.Finally touch the “OK” button to change
the channel name.
43
The character you want does not appear on the keyboard, please
select and then touch the button to switch to the desired
character.
Figure 27: Edit the channel name
4. Setup Guide
While in normal display, touch the button to enter Setting mode. You
can select the below sub-mode by touching the button.
44
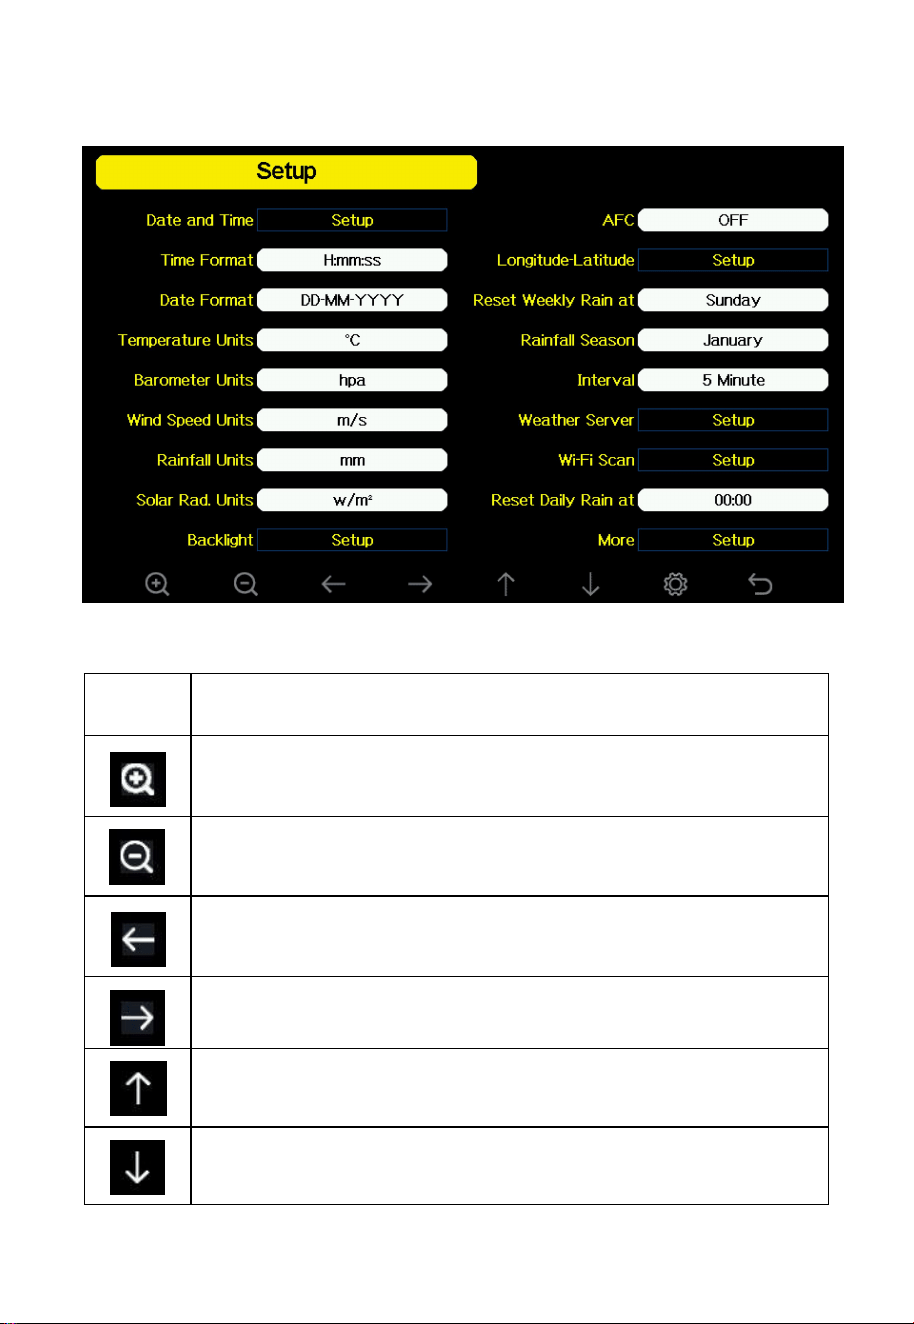
4.1 Setup page
Figure 28: Setup Menu Screen
Icon
Description
Select button
Touch this button to select the unit or scrolls the value.
Select button
Touch this button to select the unit or scrolls the value.
Left button
Touch this button to select the set value.
Right button
Touch this button to select the set value.
Up arrow button
Touch this button to change the activated option field.
Down arrow button
Touch this button to change the activated option field.
45
Set button
Touch this button to select the Setting sub-Mode.
Return button
Touch this button to return to previous mode.
Table 13
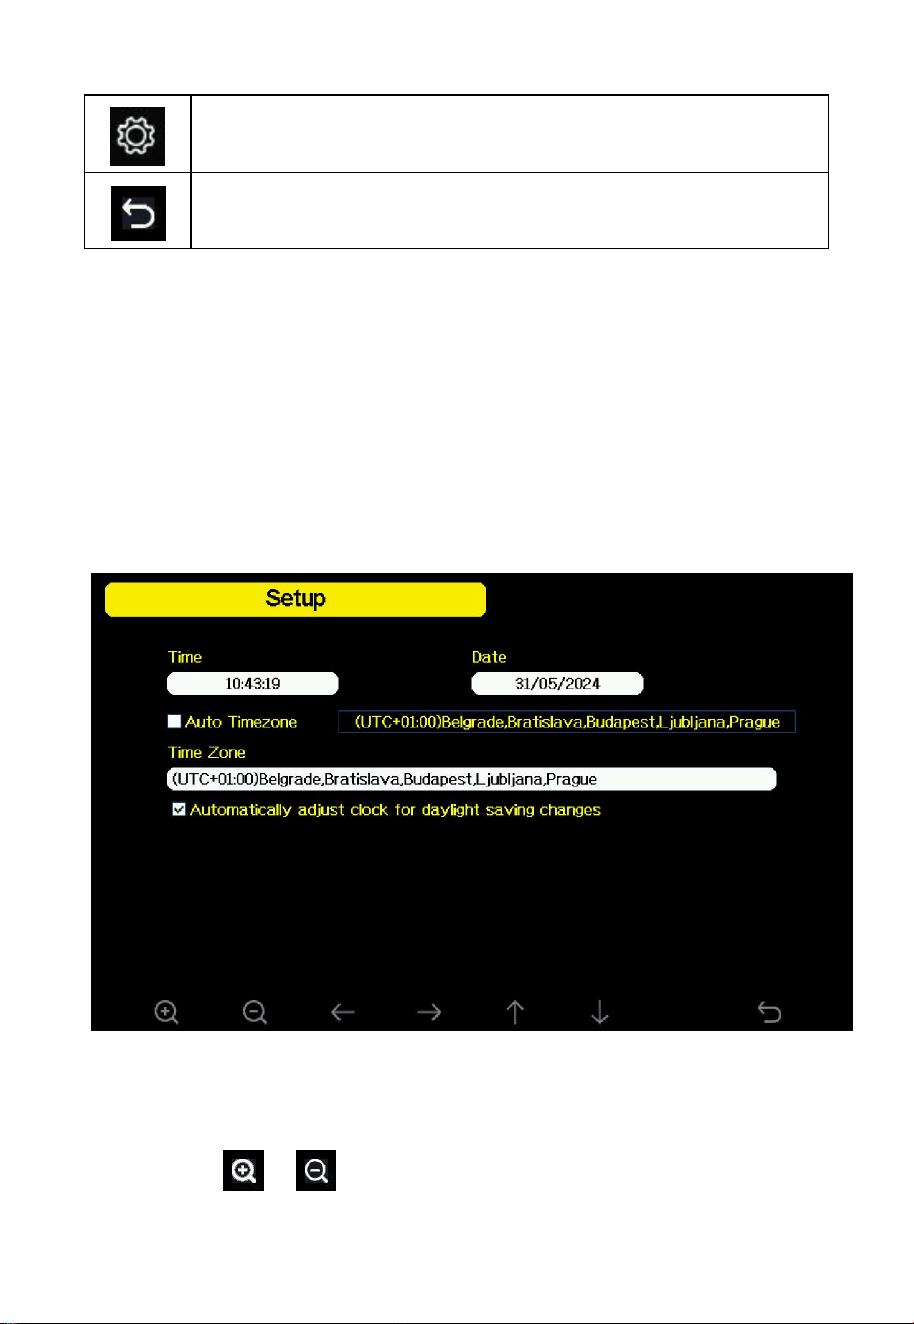
4.1.1 Date and Time
The automatic time synchronization function is turned on by default, and
the network time synchronization will be automatically performed every
2 hours. If the external crystal oscillator is damaged, the network time
synchronization will be performed every 10 minutes. The network time
synchronization function must be connected to the Internet normally to be
effective.
Figure 29: Date and Time Setting
Note: Touch or button to select and confirm.

46
4.1.2 Time Format
Options: h:mm:ss am,am h:mm:ss,H:mm:ss
4.1.3 Date Format
Options: DD-MM-YYYY, YYYY-MM-DD ,MM-DD-YYYY.
4.1.4 Temperature Units
Options: °F and °C
4.1.5 Barometric Units
Options: inHg,mmHg,hpa
4.1.6 Wind speed Units
Options: km/h, knot, mph, bft(Beaufort scale), ft/s, m/s.
4.1.7 Rainfall Units
Options: in,mm.
4.1.8 Solar Rad.Units
Options: w/m², Fc,Lux.
47
4.1.9 Backlight
While in Menu Setting Mode, touch button to select the specific
functions.
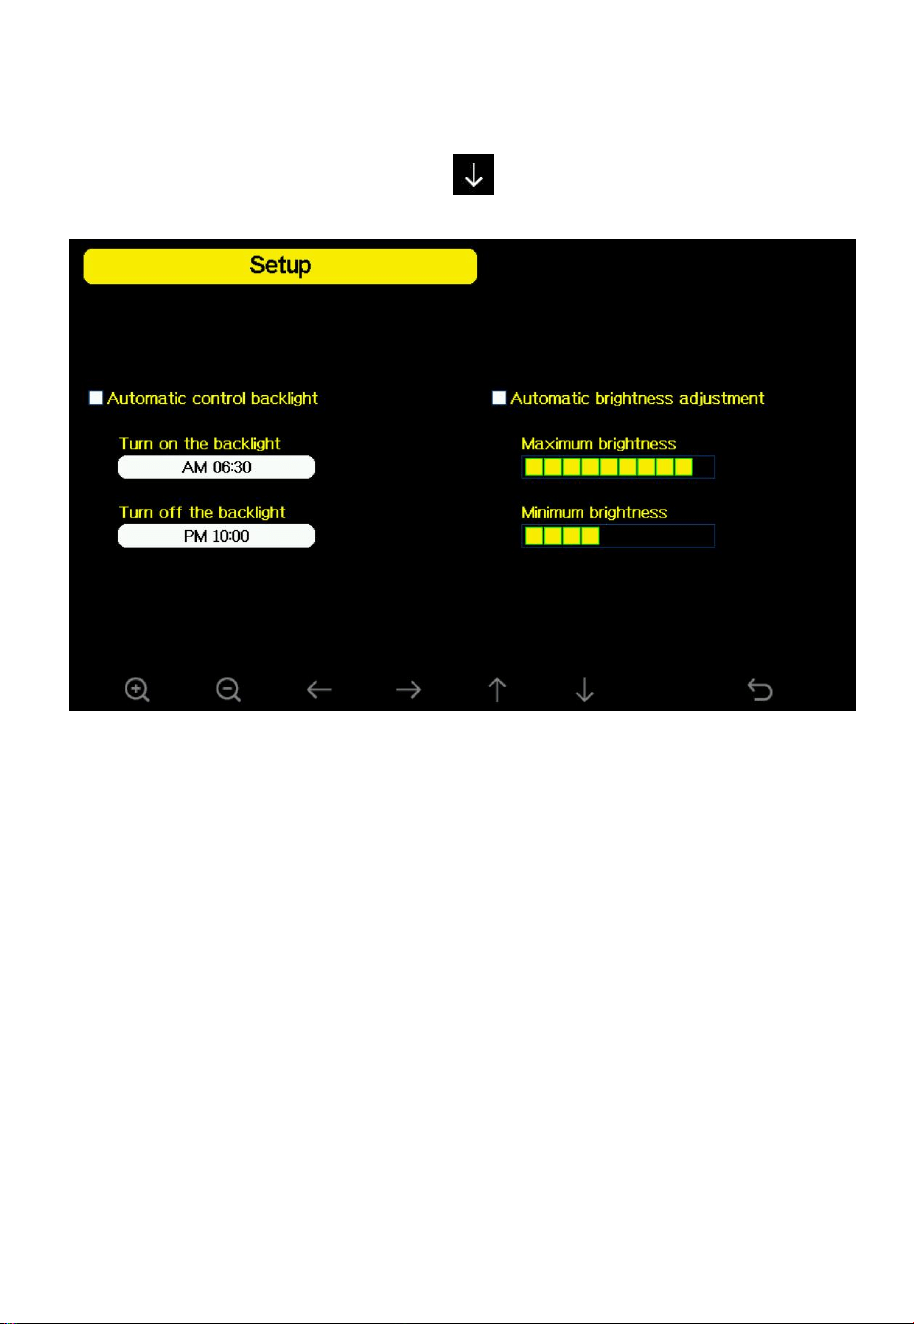
Figure 30: Backlight Setting Screen
Automatic control backlight: select this option, the backlight will
auto turn on and off according to the set time.
Turn on the backlight: set the time of turning on backlight.
Turn off the backlight: set the time of turning off backlight.
Automatic brightness adjustment: selecting this option, the
brightness will change according to the light intensity measured
from outdoor sensor.
Maximum brightness: set the maximum brightness while it is the
highest light intensity.
48
Minimum brightness: set the minimum brightness while it is the
weakest light intensity.
Note: If the auto backlight turn-on time has been set, you can touch any
button to turn off the backlight within the turn on time. Backlight will
turn on again automatically at next turn on time. During the backlight off
time, you can touch any button to turn on the backlight until the next
backlight off time.
4.1.10 AFC (Default: OFF)
AFC typically stands for "Automatic Frequency Control".
Touch the or button to choose the ON and OFF. The "AFC"
option optimizes the console's radio signal reception in specific
conditions and potentially improves reception capabilities. If you're
experiencing reception issues, enable this option to see if it helps. If you
have no reception problem at all, it's best to leave this option untouched.
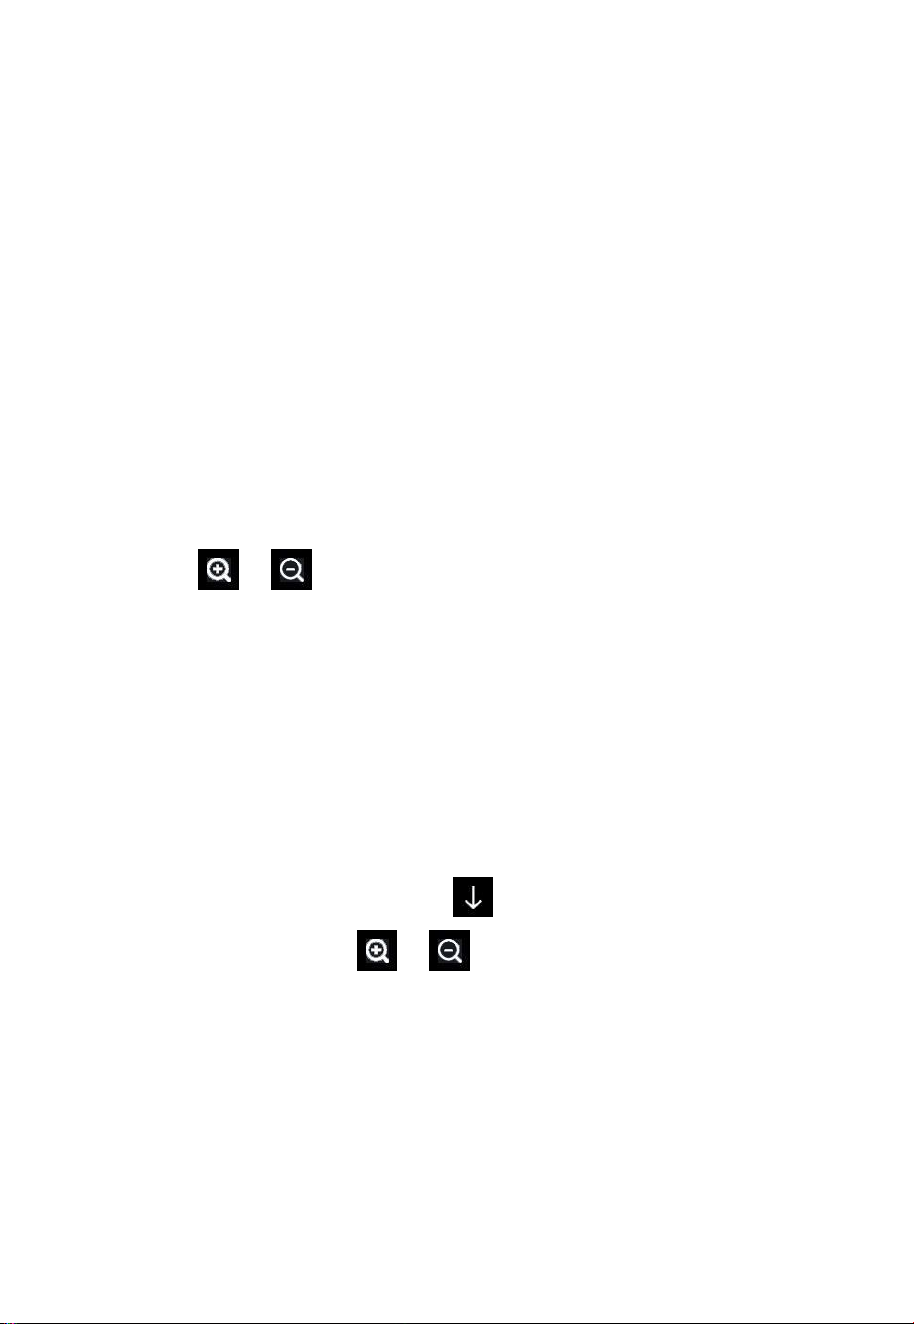
4.1.11 Longitude and Latitude
Options: Longitude,Latitude
While in Menu Setting Mode, touch button to select Longitude and
Latitude setup field, touch or button to enter Longitude and
Latitude.
49
Figure 31: Longitude and Latitude Setting Screen
The sunrise/sunset times will be calculated automatically based on the
Longitude and Latitude. Two decimal places are sufficient for this feature
to function correctly.
Locations between the equator and the North Pole have northern latitude,
while locations between the equator and the South Pole have southern
latitude. Locations east of the Prime Meridian (0°) to the International
Date Line (180°) include areas across Europe and Asia, which are in
eastern longitude. Locations west of the Prime Meridian (0°) to the
International Date Line (180°) include areas across the Atlantic and
Pacific Oceans, which are in western longitude.
4.1.12 Reset Weekly Rain at (default: Sunday)
Options: Monday, Sunday.
In this setting, you can choose whether the weekly rainfall count starts
from Sunday at 0:00 or from Monday at 0:00
.

50
4.1.13 Rainfall Season (default: January)
Options: January to December
This refers to the month for resetting the annual rainfall to zero.
For example, if the clearing month is set to February, the annual rainfall
will be cleared on February 1st of the following year.
4.1.14 Interval (1-240minutes Selectable)
This refers to the time interval for recording historical data, and SD card
backup data interval.
For example, if the time interval for recording historical data is set to 1
minute, then one set of data will be recorded every minute.
4.1.15 Weather Server
There are several weather servers available for your selection. We have
dedicated a separate Section 5 to guide you on how to create an account
and view the data for your reference.
4.1.16 WiFi-Scan
Please refer to Section 2.7.3 for detailed operation.
4.1.17 Reset Daily Rain at (default: 00:00)
Options: 0:00-23:00
You can set the daily reset time for daily rainfall.
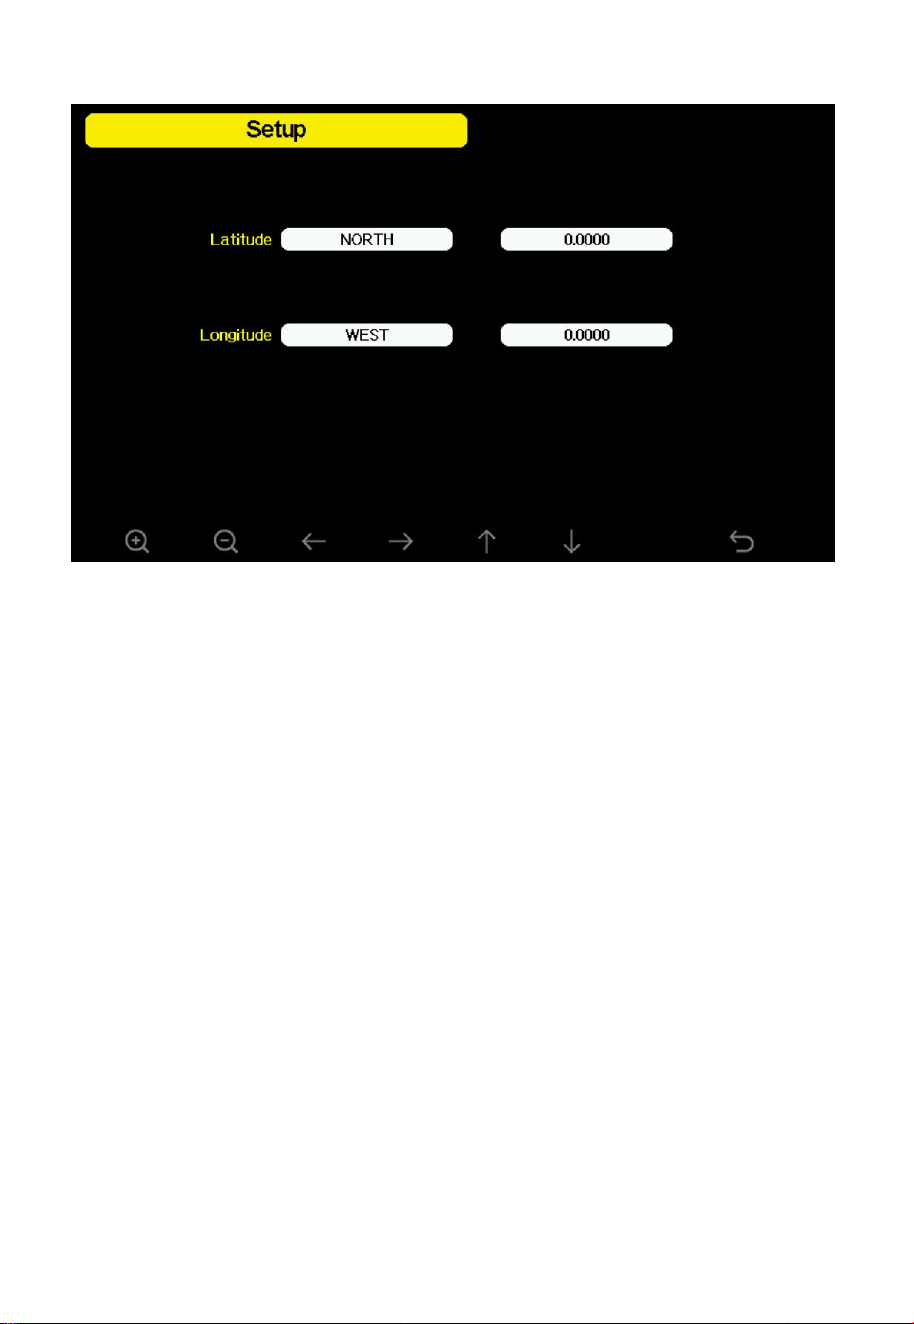
4.1.18 More
Touch the or button to access the
“
More
”
page.
Touch the or button to access or confirm the mode you need.
51
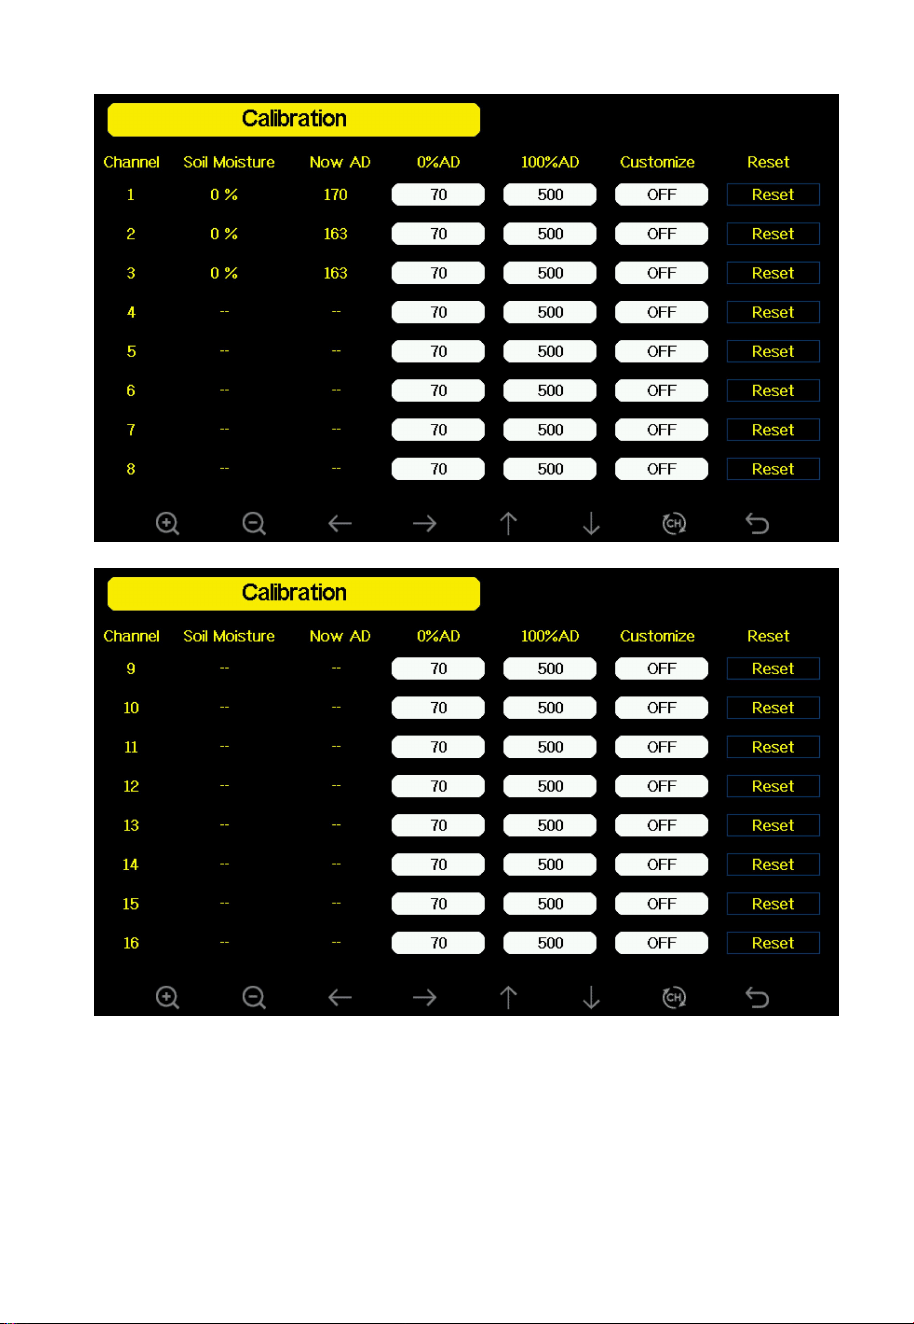
Figure 32
① Soil Moisture Calibration mode
Channel: Channel name
Soil Moisture: Current soil moisture value
Now AD: The AD value corresponding to the current soil moisture
0% AD: The AD value corresponding to 0% soil moisture (range: 70 to
200)
100% AD: The AD value corresponding to 100% soil moisture (range:
0% AD + 10 to 1000)
Customize: Customization option
Reset: Reset button
52
Figure 33: Soil Moisture Calibration
53
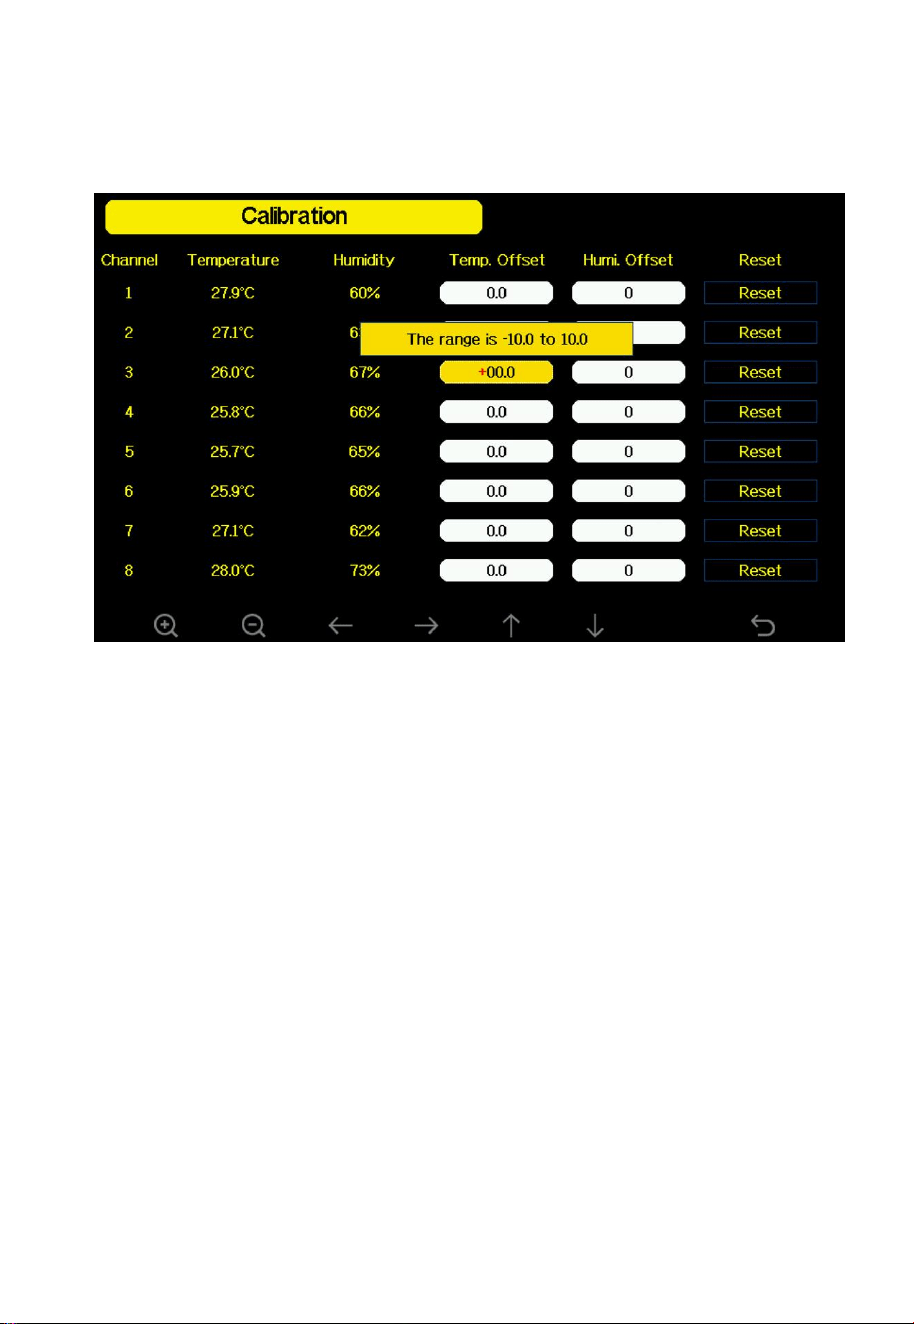
② Multi CH T&H Calibration mode
Please refer to Section 4.3 to view about how to calibrate.
Figure 34
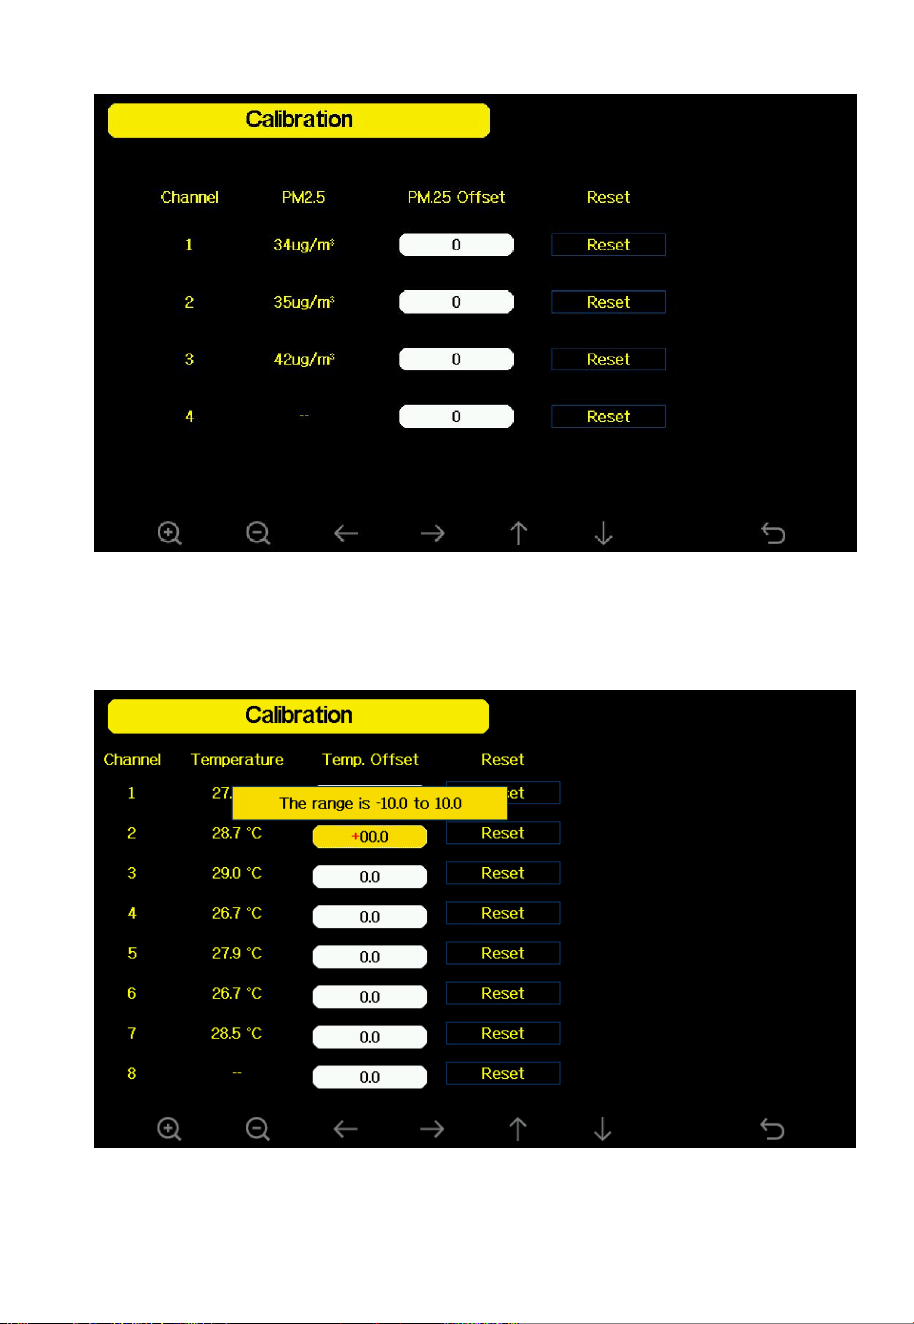
③ PM2.5 Calibration mode
Channel: Channel Name
PM2.5: Current PM2.5 value
PM2.5 Offset: PM2.5 Compensation value
Reset: Reset Button
54
Figure 35: PM2.5 Calibration
④ WN34 Calibration mode
Figure 36

55
⑤ Rainfall data priority mode
You can switch the rainfall display priority here.
Options: Traditional Rain Gauge→ Piezoelectric Rain Gauge →No Rain
Gauge
WH40 and WS69 for traditional rainfall,
WS85 and WS90 for piezoelectric rainfall.
⑥ Display 10 Min.Avg or 10 Min.Max for wind speed
Options: 10 Min.Avg→10 Min.Max
⑦ Sensors ID
You can view your sensors ID or register a new one. The detailed
information and operation have been elaborated in Section 2.6.
⑧ Sensor Name&Data
You can change the sensor name and view the sensor data. The detailed
information and operation have been elaborated in Section 3.5.
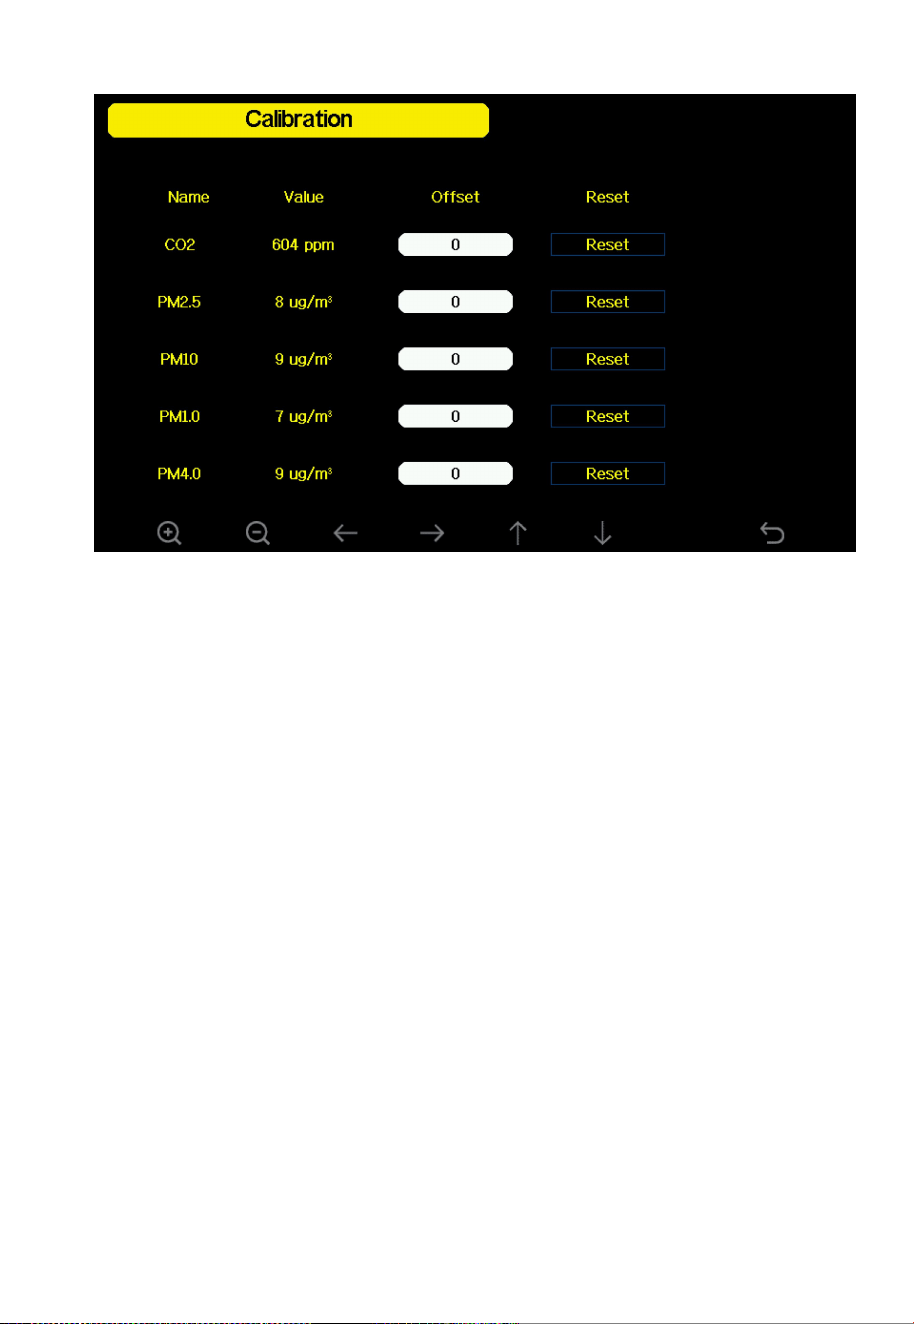
⑨ AQIN Calibration mode
When the console receives the WH46 sensor, the page will also display
options for PM1.0 and PM4.0. A WH45 sensor shows only PM2.5 and
PM10.
56
Figure 37: AQIN Calibration
⑩
Temperature Compensation WH65/WS69/WS80/WS90 mode
This option defaults “OFF”.
If the arrays are installed above grass and are not affected by background
heating, you do not need to enable this option. However, if it is installed
on a rooftop where heating from the roof could influence the outdoor air
temperature measurement, you should enable this option. This setting will
account for the sun's heating effect and compensate for the setup's
potential inaccuracies.
⑪
Feels Like/App Temp
Options: Feels Like→ App Temp.
Feels Like measurement range: -40°F ~ 140°F (40°C ~ 60°C).

57
When the outdoor temperature is less than 50°F (10°C), the value of
Feels Like is wind chill. When the outdoor temperature is greater than or
equal to 50°F(10°C) and less than or equal to 80°F (26.7°C), the value of
Feels Like is the outdoor temperature.
When the outdoor temperature is greater than 80°F (26.7°C), the value of
Feels Like is the heat index.
Please refer to this URL to read the Feels Like definition:
https://s.ecowitt.com/PXK90X
If you are in Australia, you can also refer to this:
https://s.ecowitt.com/0K64B3
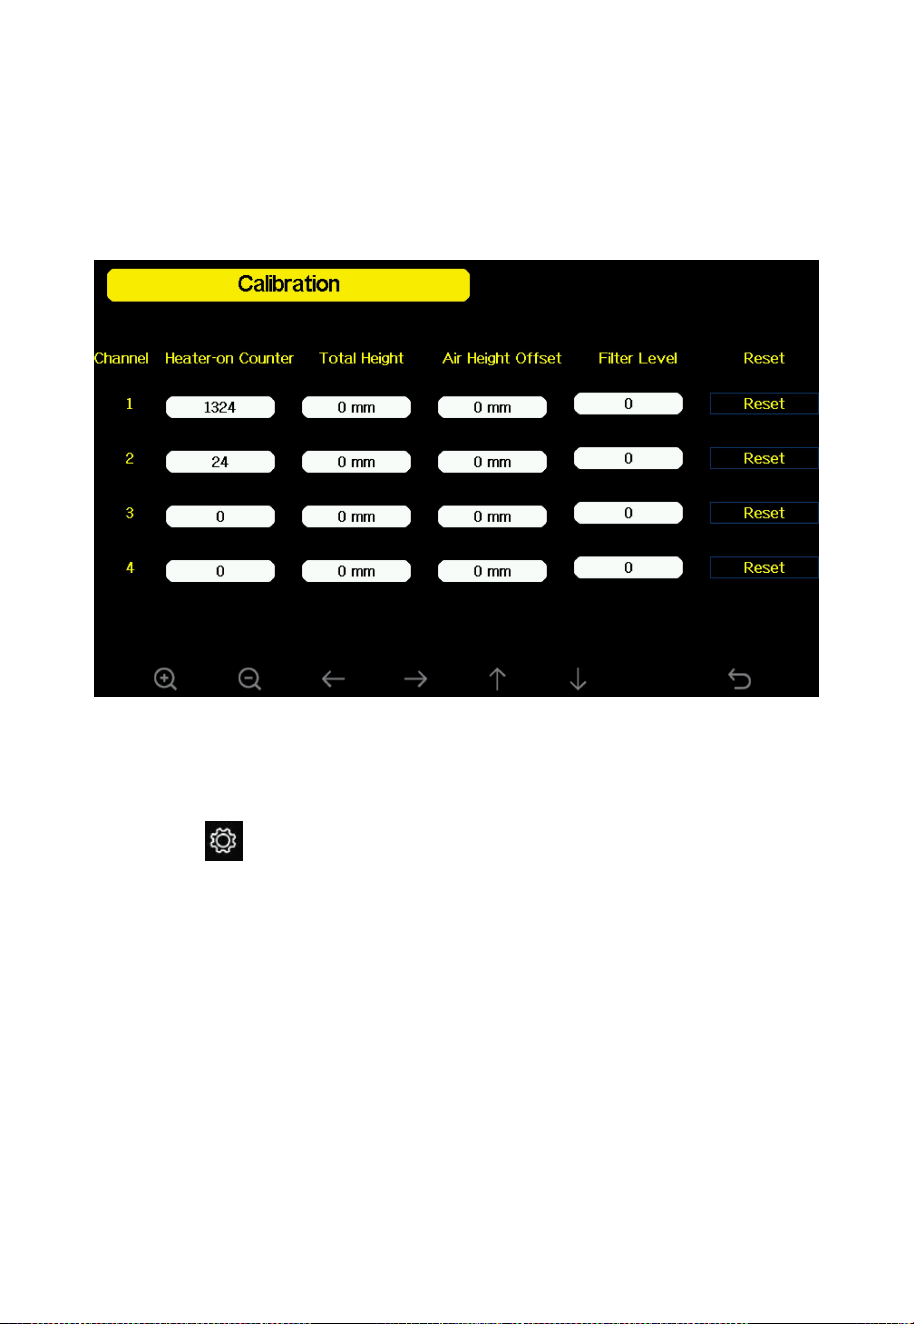
⑫
LDS Calibration
Channel: Channel name
Heater-on Counter: Displays the number of times the heater has been
activated since it was first turned on, with a default value of 0. Once the
heating function is enabled on the LDS01, the counter will automatically
increment and save each time the heater is activated.
Total Height: This refers to the distance from the bottom of the tank to
the bottom of the device (for water measurement) or from the bottom of
the device to the ground (for snow measurement). This value must be
manually entered by the user.
Air Height Offset: This is the distance from the air space above the
water/snow level to the bottom of the device. If the measured value of the
device is considered inaccurate, you can set an offset to correct it.
Filter Level: It is used to process the air height values obtained by the
LDS01, reducing the impact of instantaneous fluctuations on the data and
improving the stability and accuracy of the data. There are 5 levels in
total, with the default being level 0.According to the most recent obtained
Air Height values, sorted in ascending order.
The Air Height values corresponding to the filter levels are as follows:

58
Level 0 (default)
Uses the current latest value directly, suitable for
scenarios with high real-time requirements, but may
be affected by instantaneous fluctuations. If highly
stable data is not necessary, this level can be chosen.
Level 1
Uses the median value of the most recent 3
measurements, sorting to remove extreme values
and providing more stable results.
Level 2
Uses the median value of the most recent 5
measurements, further reducing fluctuations and
improving data smoothing.
Level 3
Uses the median value of the most recent 7
measurements, suitable for scenarios requiring
higher data stability, effectively eliminating more
fluctuations.
Level 4
Uses the median value of the most recent 9
measurements, suitable for scenarios requiring
extremely high data stability. This level smooths the
data to the greatest extent, removing more
fluctuations.
By adjusting the filter level, you can balance the real-time performance
and stability of the data, meeting the requirements of different
applications.
Reset: Resets the Heater-on Counter, Total Height, and Air Height
calibration data to zero.
Notes:
1. The “air” shown in Section 3.5 “Optional Sensor Display Mode”
refers to the distance. When measuring depth, the total height
value is a required setting.
59
2. The total height setting must be greater than or equal to the air
height for the water depth to be displayed correctly. Otherwise, it
will show as "--".
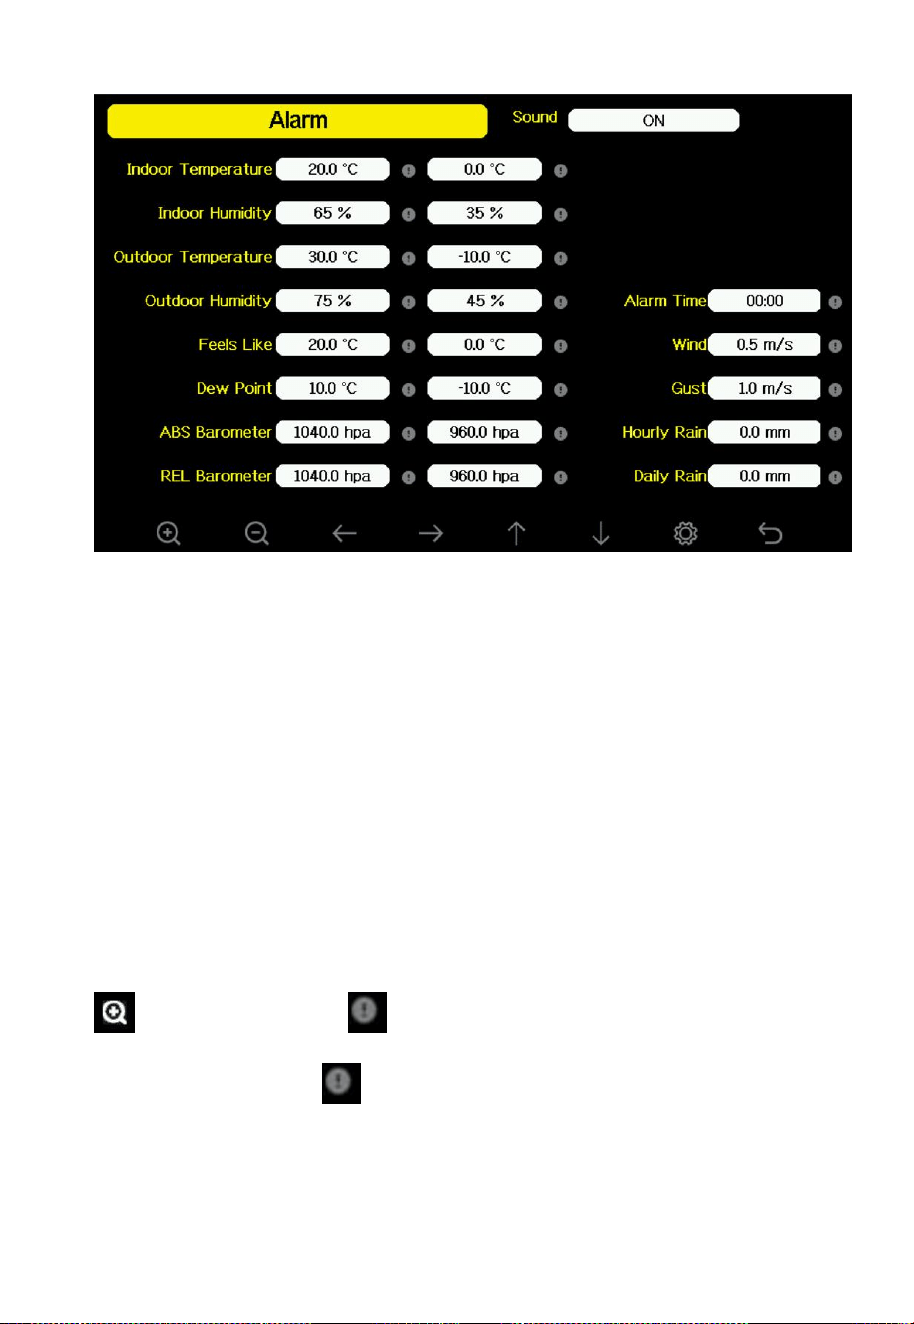
4.2 Alarm page
Touch the button on the home screen once, then touch it again to
access the Alarm page.
60
Figure 38: Alarm setting mode
The first row is high alarm value and the second row is low alarm value.
When a high value is reached or crossed or a low value is reached or
crossed, the alarm will be triggered.When a weather alarm condition has
been triggered, that particular alarm will sound for 120 seconds and the
corresponding icon will flash until the weather condition no longer meets
the user set level. Touch any button to mute the alarm.
Note: Please turn on the sound button first, otherwise the console will not
sound an alarm. Then set a value which need to be alarmed and touch the
button to turn on the .
The little alarm circles will be shown with their colour on the console
display next to the respective sensor.
61
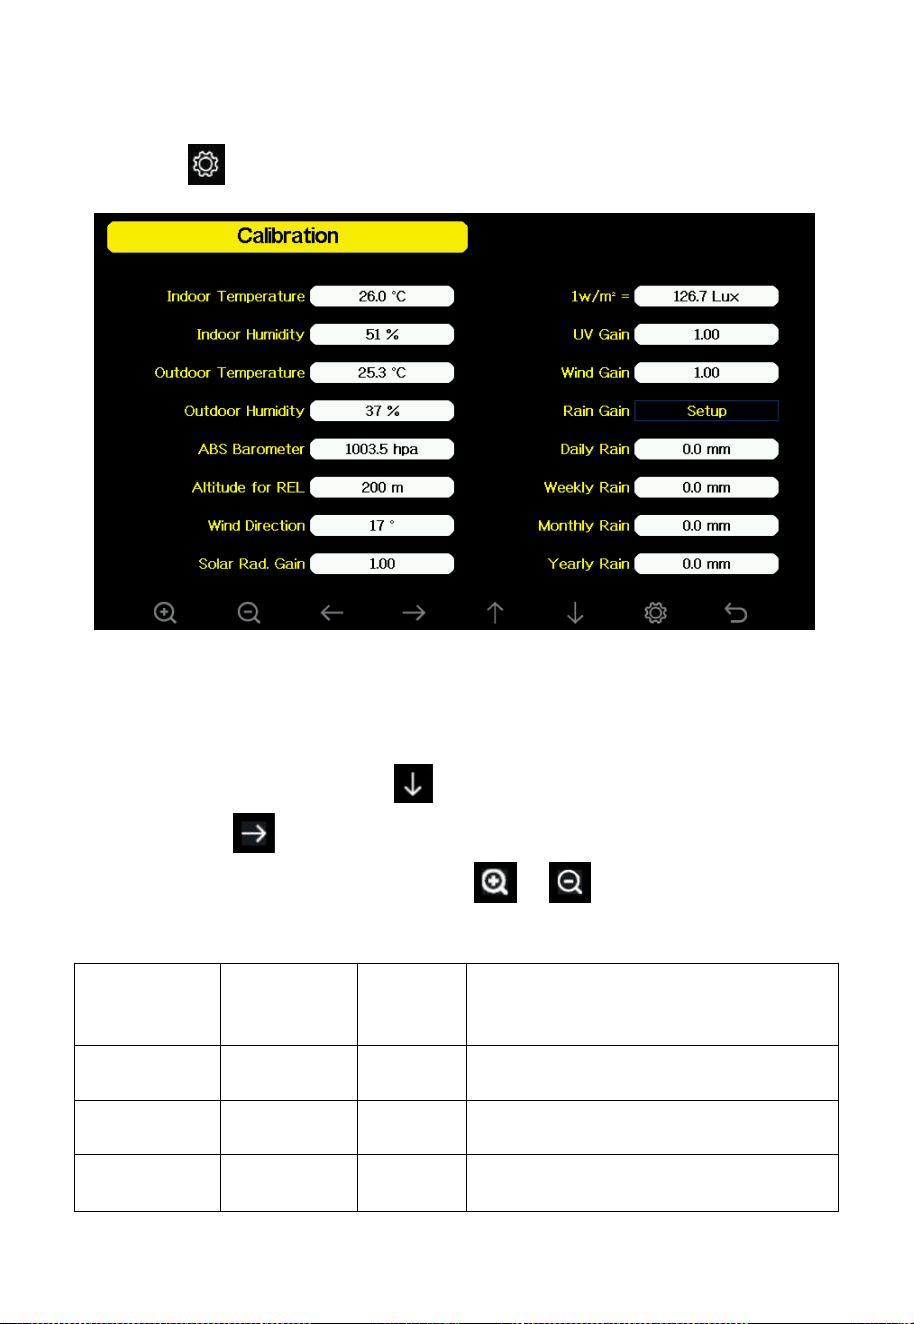
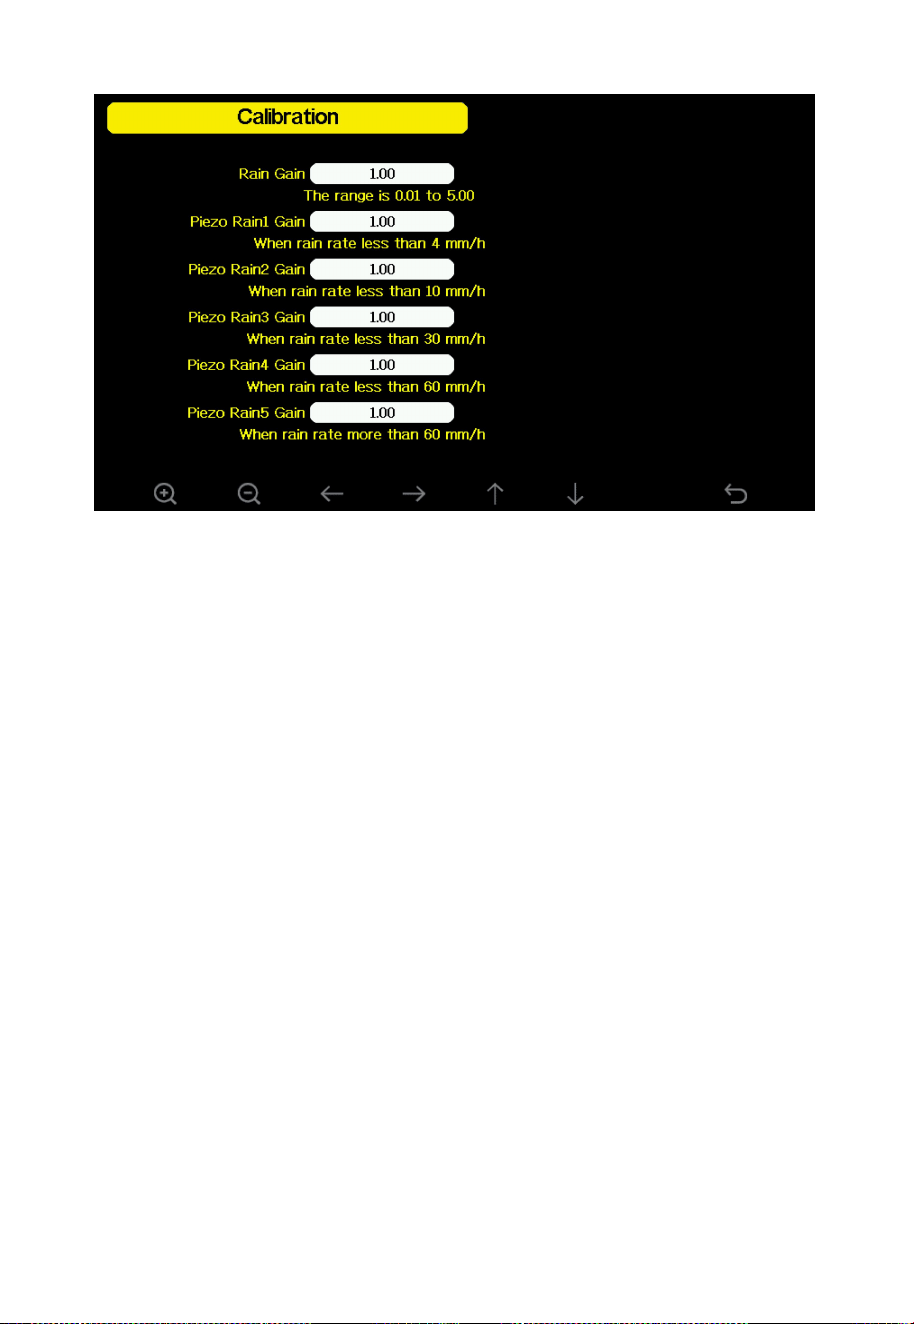
4.3 Calibration page
Press the button on Alarm page to access the Calibration Mode page.
Figure 39: Calibration Mode
To adjust the parameter, press to scroll to the parameter you wish to
change. Press to highlight the sign (positive vs. negative, if
applicable) and significant digit. Press or to change the
calibrated value.
Parameter
Type of
Calibration
Default
Typical Calibration Source
Temperature
Offset
Current
Value
Red Spirit or Mercury
Thermometer (1)
Humidity
Offset
Current
Value
Sling Psychrometer (2)
ABS
Barometer
Offset
Current
Value
Calibrated laboratory grade
62
barometer
Altitude for
REL
Offset
0m
Current Location Altitude (3)
Wind
Direction
Offset
Current
Value
GPS, Compass (4)
Solar
Radiation
Gain
1.00
Calibrated laboratory grade solar
radiation sensor
1 w/m
2
Gain
126.7
lux
Solar radiation conversion from lux
to w/m
2
for wavelength correction
(5)
Wind
Gain
1.00
Calibrated laboratory grade wind
meter (6)
Rain
Gain
1.00
Sight glass rain gauge with an
aperture of at least 4” (7)
Daily Rain
Offset
Current
Value
Apply an offset if the weather
station was not operating for the
entire day.
Weekly Rain
Offset
Current
Value
Apply an offset if the weather
station was not operating for the
entire week.
Monthly Rain
Offset
Current
Value
Apply an offset if the weather
station was not operating for the
entire month.
Yearly Rain
Offset
Current
Value
Apply an offset if the weather
station was not operating for the
entire year.
Table 14
(1) Temperature errors can occur when a sensor is placed too close to a
heat source (such as a building structure, the ground or trees).
To calibrate temperature, we recommend a mercury or red spirit (fluid)
thermometer. Bi-metal (dial) and digital thermometers (from other
weather stations) are not a good source and have their own margin of
error. Using a local weather station in your area is also a poor source due
to changes in location, timing (airport weather stations are only updated

63
once per hour) and possible calibration errors (many official weather
stations are not properly installed and calibrated).
Place the sensor in a shaded, controlled environment next to the fluid
thermometer, and allow the sensor to stabilize for 3 hours. Compare this
temperature to the fluid thermometer and adjust the console to match the
fluid thermometer.
(2) Humidity is a difficult parameter to measure electronically and
drifts over time due to contamination. In addition, location has an
adverse effect on humidity readings (installation over dirt vs. lawn
for example).
Official stations re-calibrate or replace humidity sensors on a yearly basis.
Due to manufacturing tolerances, the humidity is accurate to ± 5%. To
improve this accuracy, the indoor and outdoor humidity can be
calibrated using an accurate source, such as a sling psychrometer.
(3) Relative Pressure Compensation Calculation
The relative pressure compensation value (REL) is calculated based on al
titude, outdoor temperature, and absolute pressure (ABS). If outdoor tem
perature data is unavailable, REL can be calculated using the following fo
rmula:
REL = ABS + Altitude/11
The altitude unit can be either feet (ft) or meters (m), depending on
the selected rainfall unit:
If the rainfall unit is set to inches (in), the altitude unit will be feet (ft).
If the rainfall unit is set to millimeters (mm), the altitude unit will be
meters (m).
Please select the appropriate units based on your needs to ensure accurate
calculations.

64
(4) Only use this if you improperly installed the weather station sensor
array, and did not point the direction reference to true north.
(5) The default conversion factor based on the wavelength for bright
sunlight is 126.7 lux ~ 1 W/m2. It results from a photometrically
determined light value converted into a radiometrically based power
unit. This variable can be adjusted by photovoltaic experts based on
the light wavelength of interest, but for most weather station owners,
it is accurate for typical applications, such as calculating
evapotranspiration and solar panel efficiency for equally aligned
panels.
(6) Wind speed is most sensitive to installation constraints. The rule of
thumb for properly installing a wind speed sensor is 4 x the distance
of the tallest obstruction. For example, if your house is 20’ tall and
you mount the sensor on a 5’ pole:
Distance = 4 x (20 – 5)’ = 60’ or =4 x (6.10-1.52) =18.32m.
Many installations are not perfect and installing the weather station on a
roof can be difficult. Thus, you can calibrate for this error with a wind
speed multiplier.
In addition to the installation challenges, wind cup bearings (moving
parts) wear over time.
Without a calibrated source, wind speed can be difficult to measure. We
recommend using a calibrated wind meter (not included) and a constant
speed, high speed fan.
Note: If located in Southern hemisphere, please follow the steps to
calibrate the wind direction:
1. Install the outdoor sensor package with the West arrow on the
sensor pointing due East.

65
2. Check the wind direction offset (Default: equals to the current
wind direction).
If: Current wind direction offset < 180, then it should be calibrated to be:
current wind direction + 180. If: Current wind direction offset > 180, then
it should be calibrated to be: current wind direction - 180
For example, if the current wind direction is 288, then you’ll need to set
the wind direction offset to be: 288-180=108.
If the current wind direction is 12, then you’ll need to set the wind
direction offset to be: 12+180=192.
(7) The rain collector is calibrated at the factory based on the funnel
diameter. The bucket tips every 0.1mm or 0.004 inch of rain
(referred to as resolution). The accumulated rainfall can be
compared to a sight glass rain gauge with an aperture of at least 4”
or 0.1m. 1 mm refers to the water level on a 1 m
2
surface or one litre.
A 1,000 mm high cubic container with a ground area of 1 m
2
will
contain 1 m
3
or 1,000 litres of water when filled. This applies to the
WH40 rain gauge. One bucket tip of the WS69/WH65 rain gauge
corresponds to 0.254 mm or 0.1 inch.
Make sure you periodically clean the rain gauge funnel.
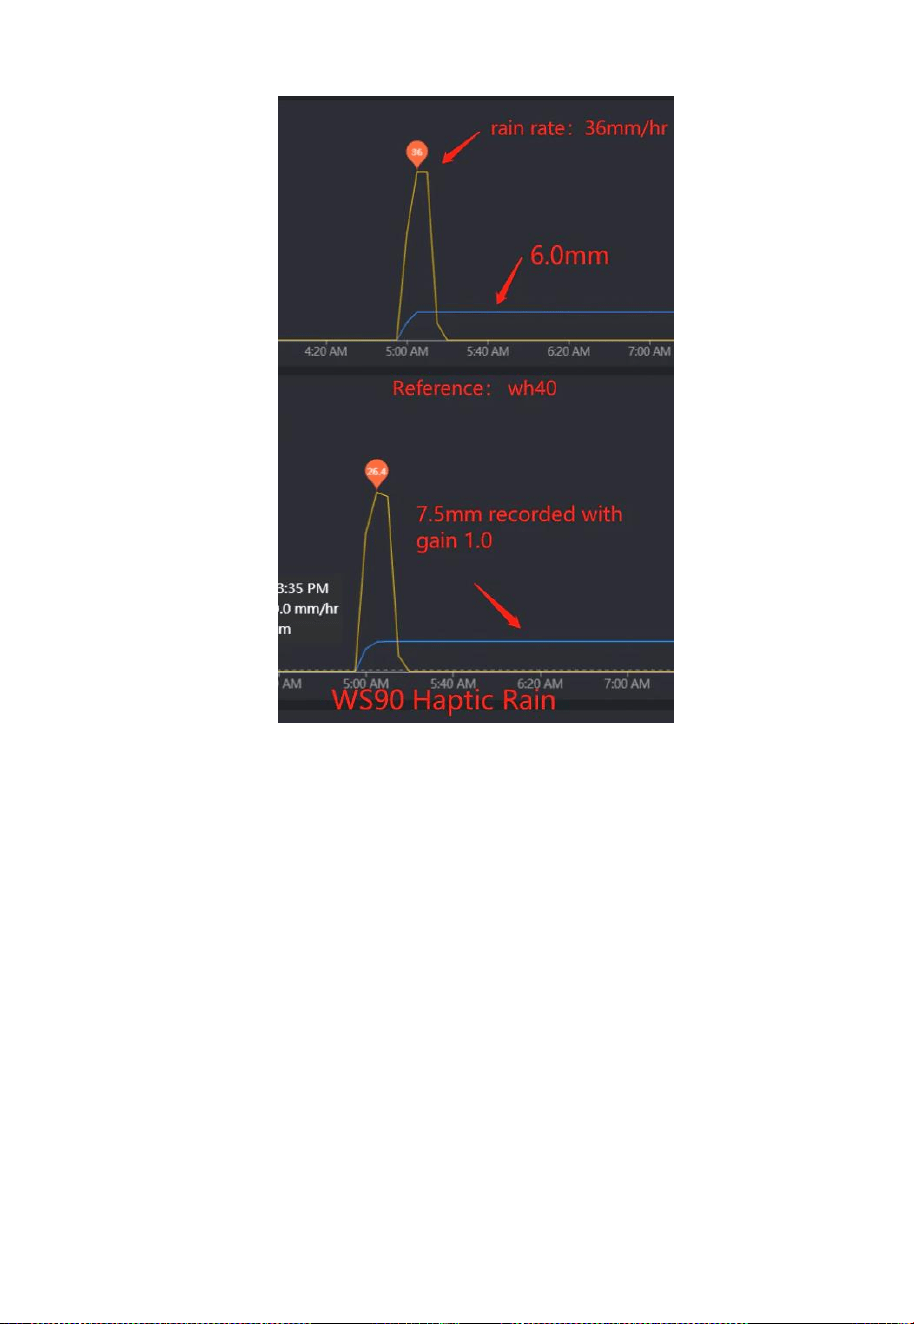
WS90/WS85 Piezoelectric Rain Calibration
66
Figure 40
WS90 and WS85 are weather stations equipped with piezoelectric rain
gauges. To make your rain data more accurate, you can calibrate the rain
sensor accuracy by yourself on this calibration page or Ecowitt app:
1. A reference is needed to record the rainfall value, and it is also
important to be able to record the rain rate. Our WH40 rain
sensor can be used for this purpose.
2. You can set five rain gain parameters: Piezo Rain1: Rain5. We
usually leave Rain1 as it is unless you can confirm it consistently
produces the same result, and then you can adjust this.
3. Please ensure that you record rain data as follows: set rain4 gain
to 6/7.5, which equals 0.8. For easier management, set rain2,
rain3, and rain5 all to 0.8 for now. Only when different rain rates
are recorded, divide the ws90 rain by 0.8 to get 1.0 rain, and then
recalculate (reference/ws90/0.8) to precisely adjust the
corresponding rain gain setting.
67
Figure 41
Note:
1. The purpose of calibration is to fine tune or correct for any sensor error
associated with the device’s margin of error. Errors can occur due to
electronic variation (example, the temperature sensor is a resistive
thermal device or RTD, the humidity sensor is a capacitance device),
mechanical variation, or degradation (wearing of moving parts,
contamination of sensors).
Calibration is only useful if you have a known, calibrated reference to
compare it against, and is optional. This section discusses practices,
procedures and sources for sensor calibration to reduce manufacturing
68
and degradation errors. Do not compare your readings obtained from
sources such as the internet, radio, television or newspapers. The purpose
of your weather station is to measure conditions of your surroundings,
your micro-climate, which can vary significantly from location to
location.
UV Calibration MUST be performed every 2 to 3 months to improve
results. Over time, UV Index may alter results based on bright and strong
sunlight conditions. This is why diligent UV Calibration is recommended.
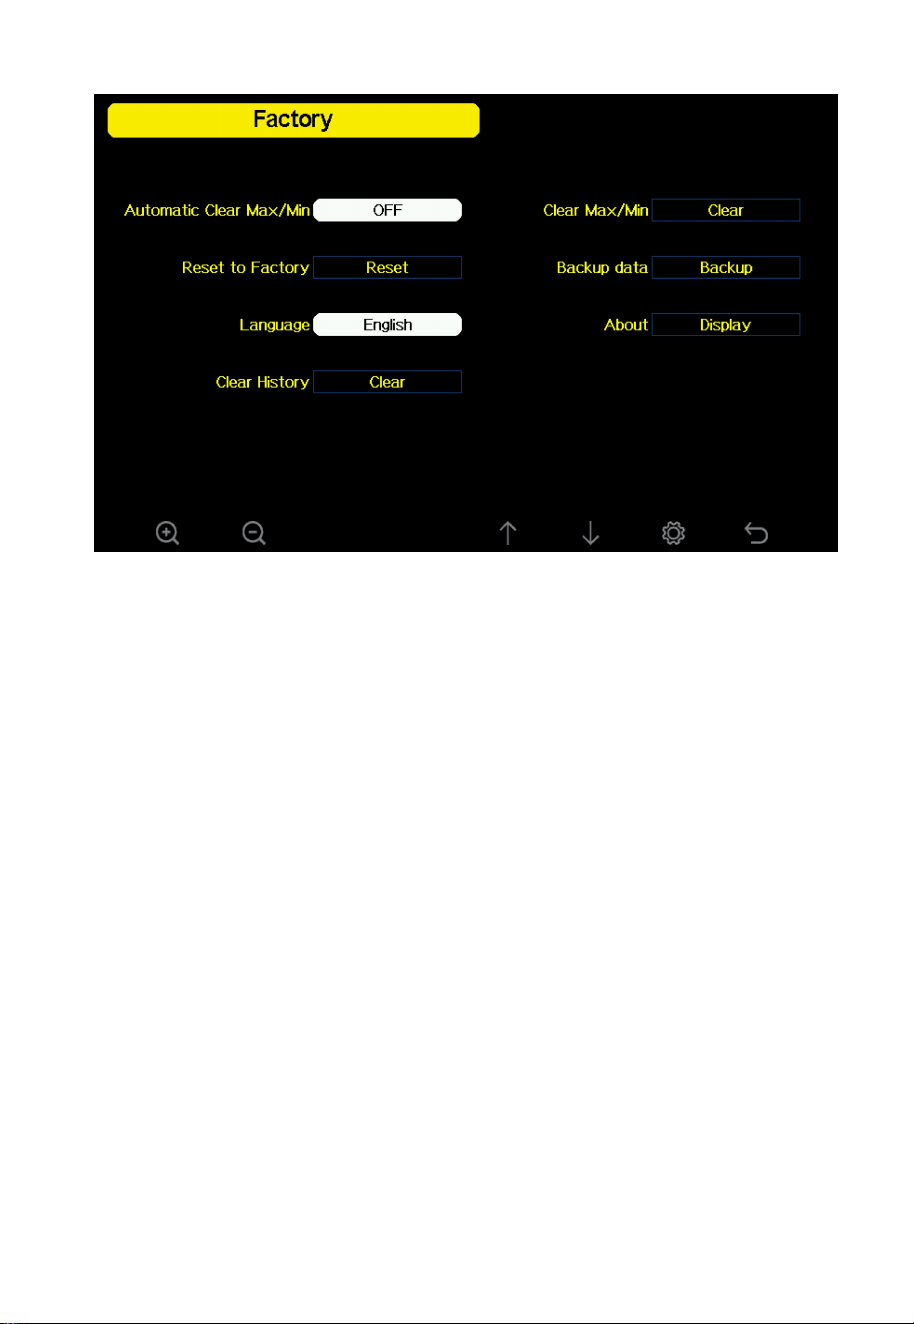
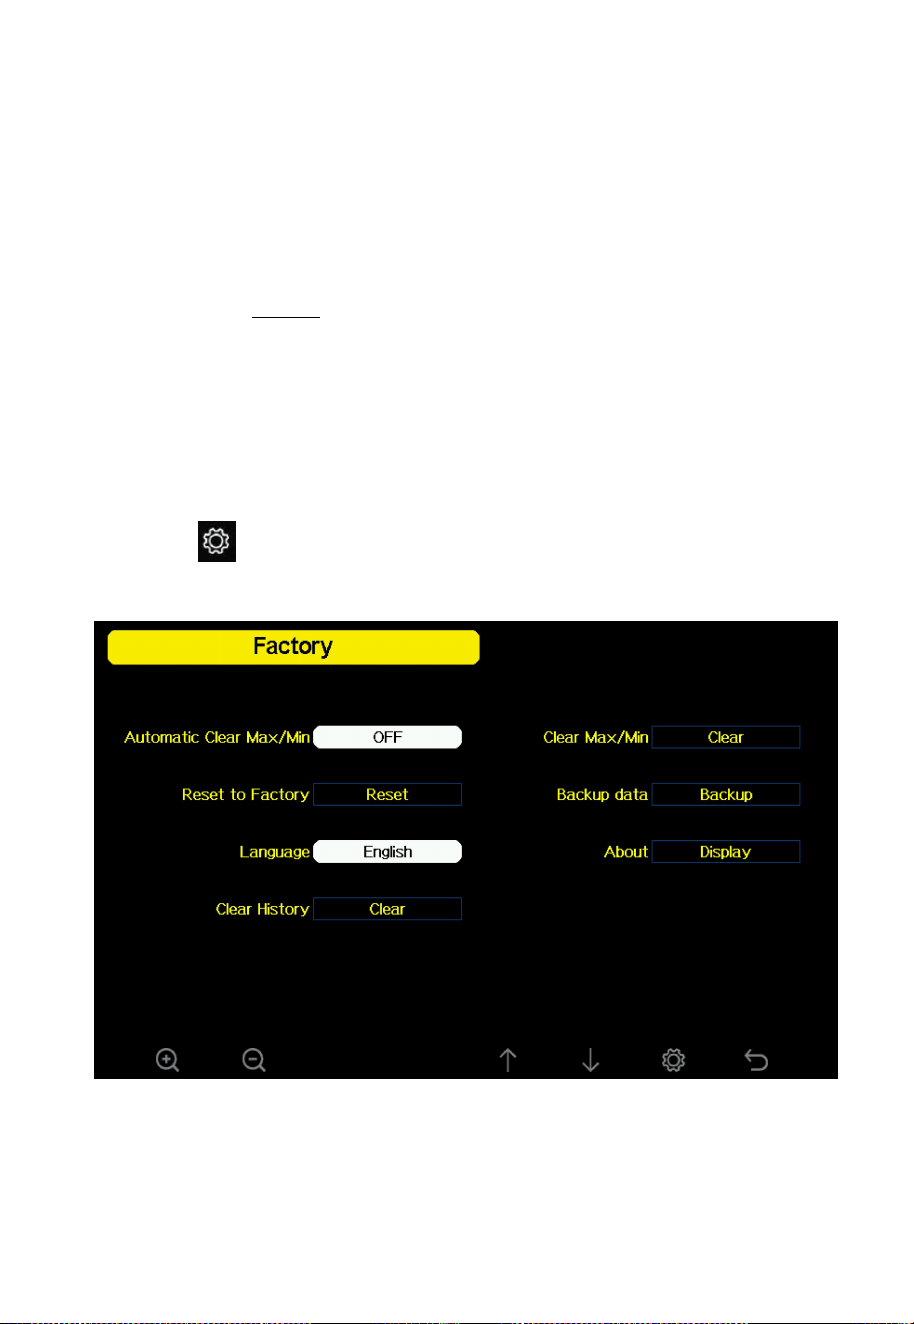
4.4 Factory page
Touch the button on calibration mode page to access the Factory
page.
Figure 42: Factory mode
69
4.4.1 Automatic Clear Max/Min
To turn on/off automatically clear Max/Min record at 0:00hr every day.
Touch or to switch on/off. When it is selected with ON option,
min/max will be presented as daily min/max, and with OFF option
selected, it is for history min/max record.
4.4.2 Reset to Factory
Touch or to popup the Message Box “Reset to factory
default?”
Touch or to select Yes or No. Touch the or to
confirm the selection.
Be aware that a factory reset will delete all calibration and rain data
including the data saved in memory. We suggest making a backup of the
internal memory to a SD card beforehand. If you need to perform a
factory reset due to some electronic dysfunction, note down your
calibration values to enter them again once the factory reset is done.
4.4.3 Language
Please jump to Section 2.5 to refer the specific details.
4.4.4 Clear History
Touch or to select Clear History. Touch or to popup
the Message Box “Clear the history record?” Touch or to
select Yes or No. Touch the or to confirm the selection.
70
4.4.5 Clear Max/Min
This operation is the same as the one described in Section 4.4.4.
4.4.6 Backup data
Touch or to select Backup data. Touch or to popup the
Message Box “Copy history data to SD card?” Touch or to
select OK or Cancel. Touch the or to confirm the selection.
Note: You need to insert a SD card (not included) into the console before
using this function.
When you have a SD card permanently inserted, all your sensor data
(basic data and extra sensor data) will be written to the SD card in the
interval chosen (1-240 minutes).
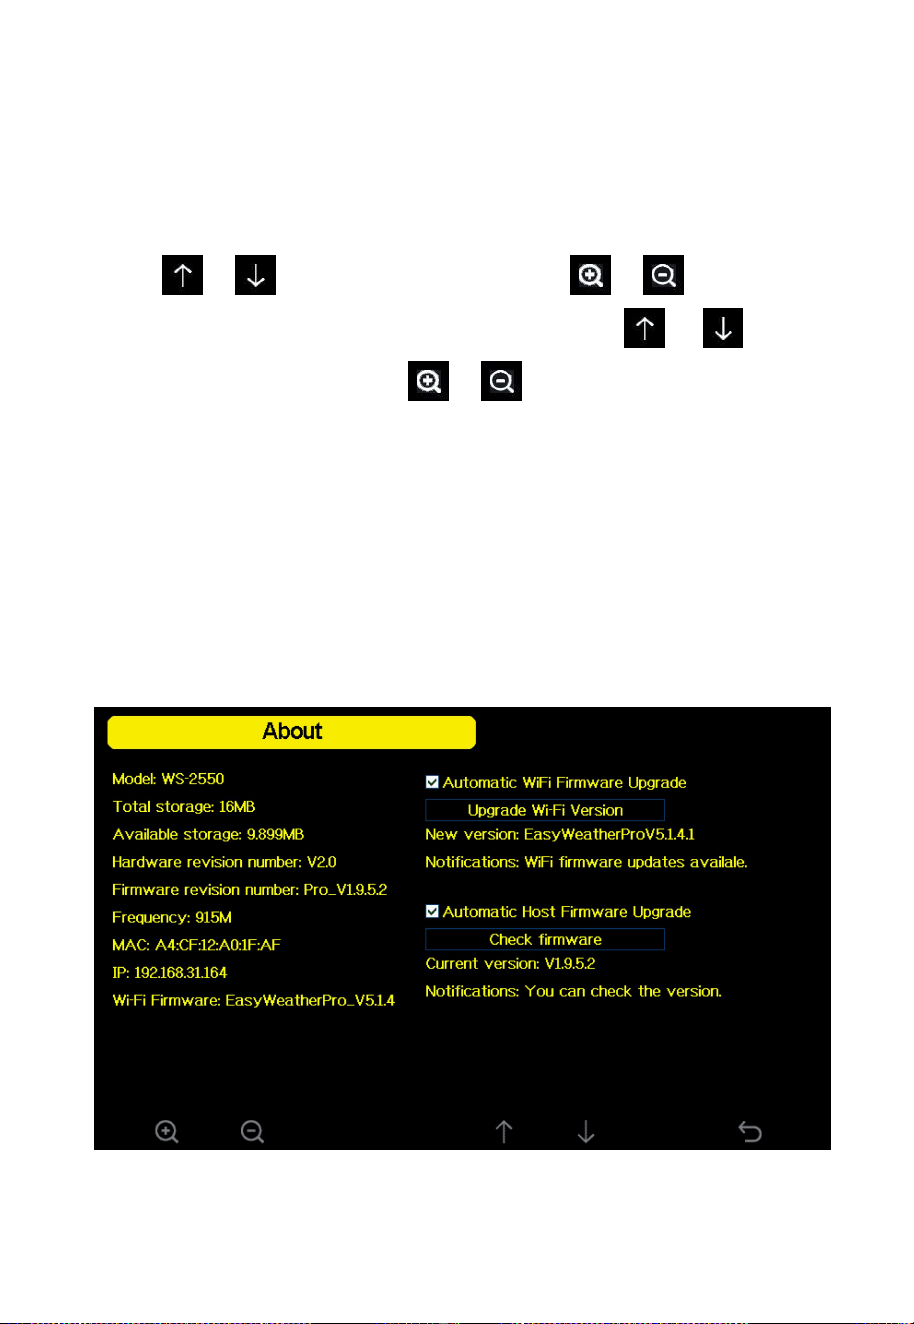
4.4.7 About information
Figure 43: About information

71
Note 1: This figure is just for reference (model and frequency will
change according to different market). The actual display console may be
with higher firmware version than this manual described because we will
update the firmware occasionally.
Note 2: You can touch the or to choose if check “Automatic
WiFi Firmware Upgrade ”and “Automatic Host Firmware Upgrade”.
Note 3: If your Wi-Fi firmware is EasyWeather, please go to WSView
Plus to upgrade to EasyWeatherPro, then this function can be used.
Note 4: the OTA (over the air, here WLAN) upgrade of the firmware
(device and WiFi firmware) is only possible with the newer HP2560
models with WiFi firmware EasyWeatherPro >= 5.1.4.
5. Optional Weather Servers
Note: This function must be performed while the console is connected to
the Wi-Fi network.
Your console is capable of sending your sensor data to selected internet-
based weather services. The supported services are shown in the Table
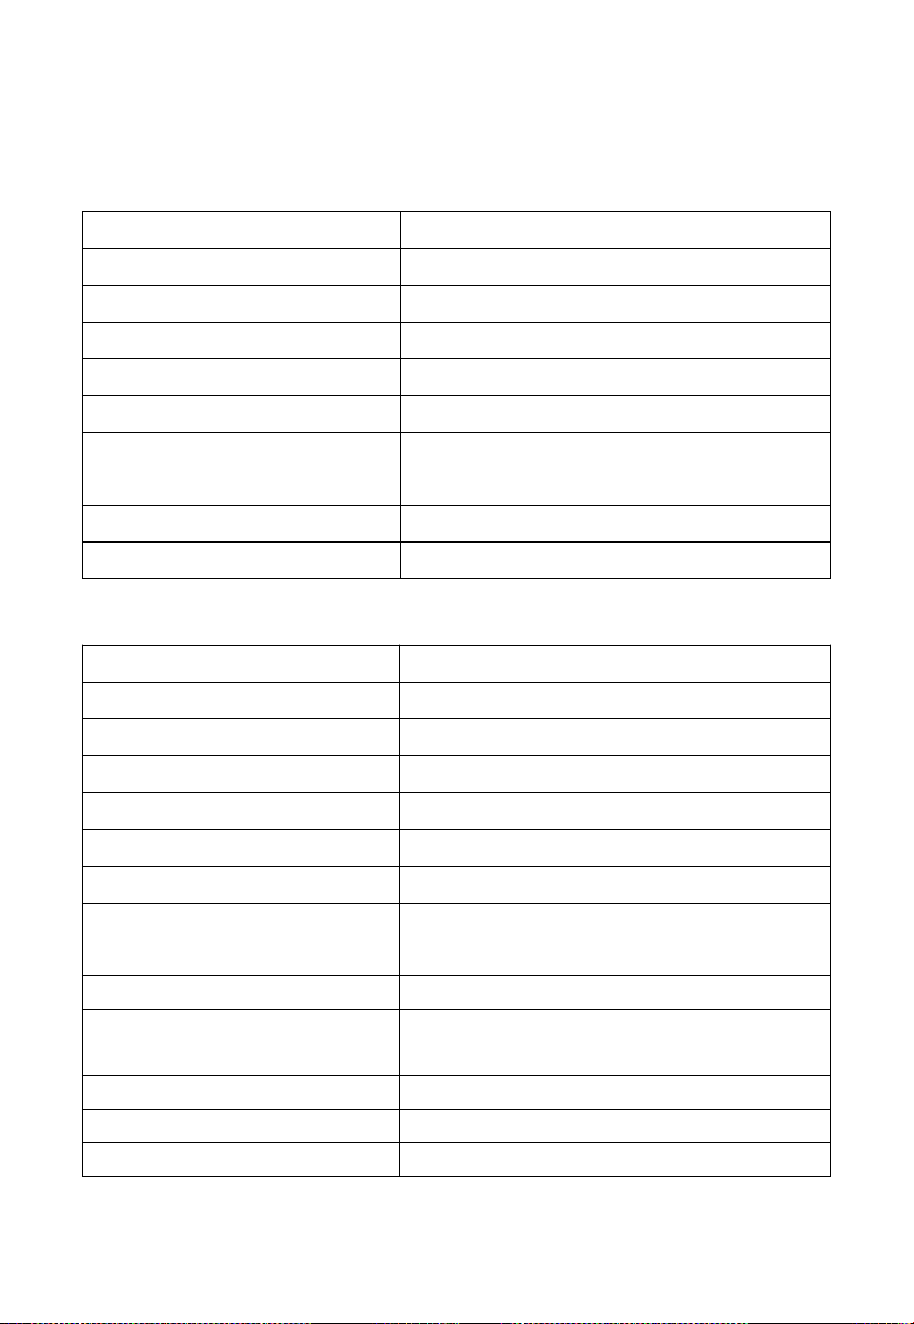
15 below:
Services
Description
Wunderground
Site: Wunderground.com
Provides local & long-range weather forecasts, weather
reports, maps & tropical weather conditions for
locations worldwide.
WOW
Site: wow.metoffice.gov.uk
A UK based weather observation website.
72
Weathercloud
Site: Weathercloud.net
A large network of weather stations reporting data in
real time from all over the world.
Ecowitt
Site: ecowitt.net
Ecowitt’s new weather server that can host a bunch of
sensors that other services don’t support at this time.
Table 15: Supported weather services
Note: If you are testing the setup with the outdoor sensor package nearby
and indoor, you may want to consider connecting to Wi-Fi, but not yet
configuring any of the weather services. The reason is that while indoor
the temperatures and humidity recorded by the outdoor sensor, and as
reported to the weather service(s) will reflect indoor conditions, and not
outdoor conditions. Therefore, they will be incorrect. Furthermore, the
rainfall bucket may be tripped during handling, causing rain to register
while it may not actually have been raining. One way to prevent this is to
follow all instructions, except to use an incorrect password on purpose!
Then, after final outdoor installation, come back and change the
password after clearing console history. That will start uploading to the
services with a clean slate.
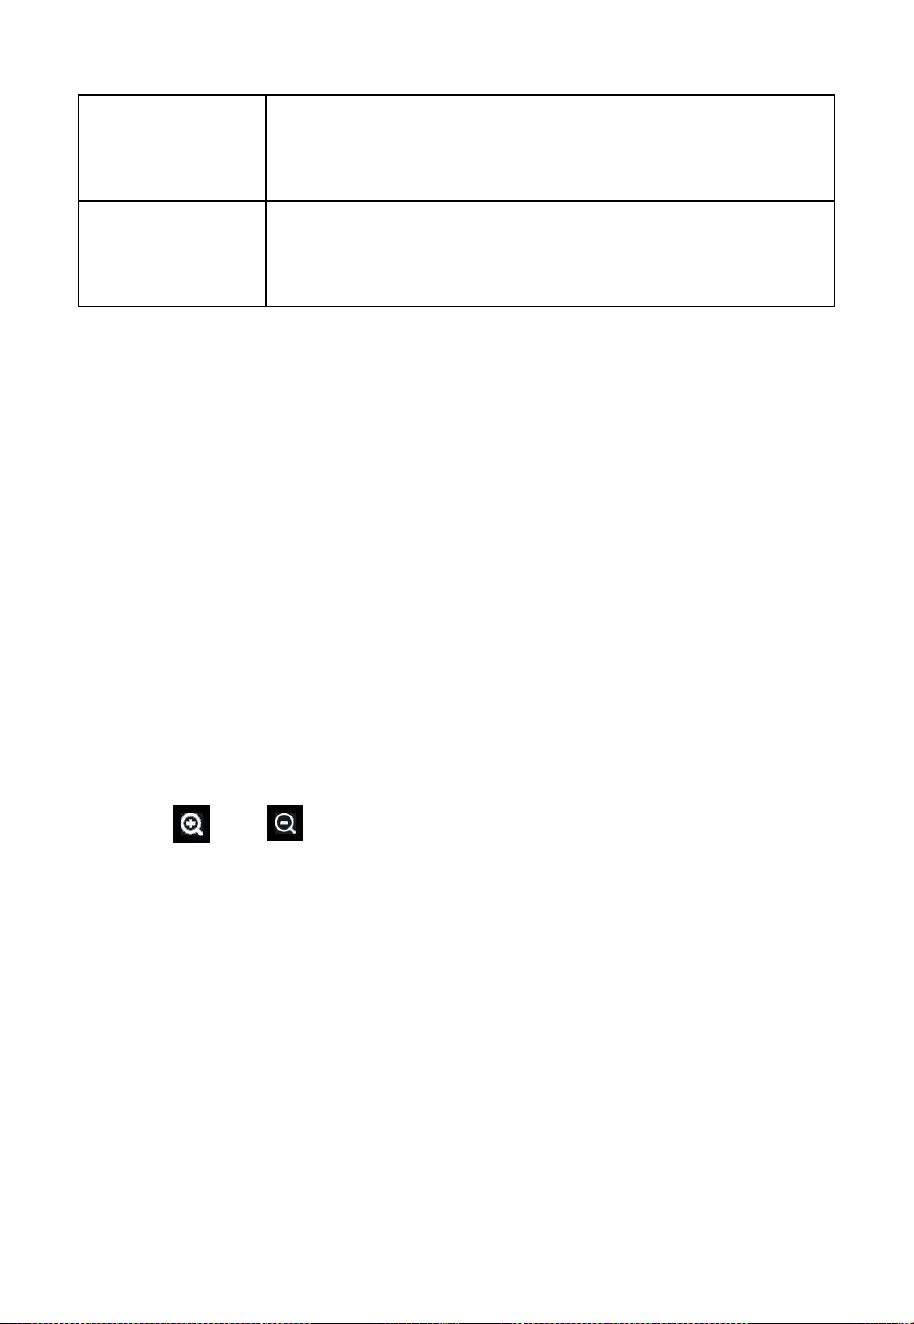
Touch or button to enter Weather Server setup mode. The
device can be configured to send real-time data to Wunderground.com.
Enter the Station ID and Key obtained from Wunderground.com.
73
Figure 44: Weather Server setup screen
Enter the Station ID and Key: Touch to highlight the Station
ID/Station Key. Enter your Station ID/Station Key.Touch or
74
button to display the keyboard. Touch to scroll to the
character and touch to select the character. Touch the “OK” button to
confirm. Touch to return to the setup page.
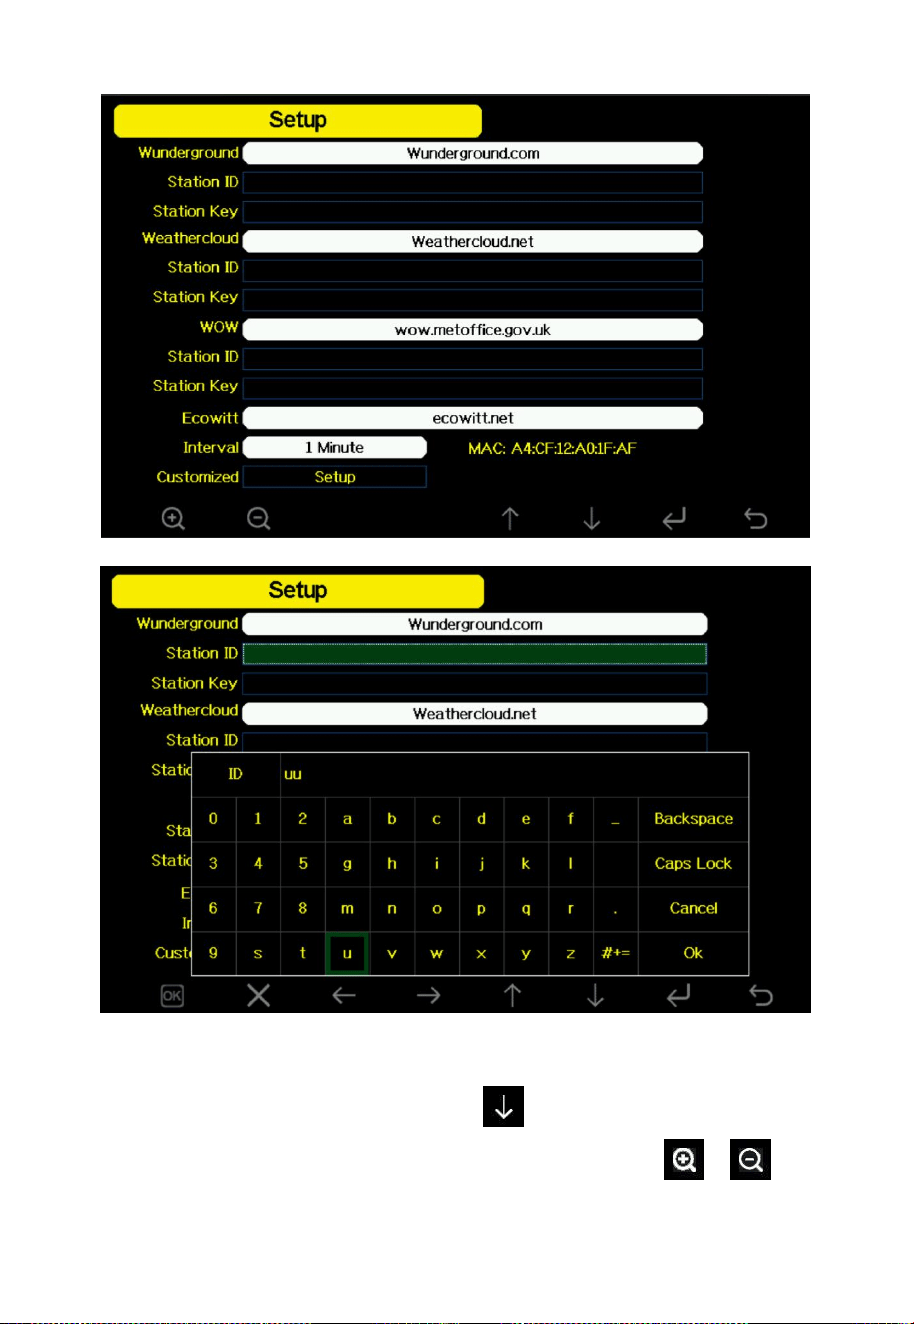
5.1 Registering with and using wunderground.com
Perform the following steps to get the Station ID and Password
on wunderground.com:
1) Visit Wunderground.com and select the “Log in” at the upper right
corner of the home page and sign up (if you don’t have an
account ,please register first.)
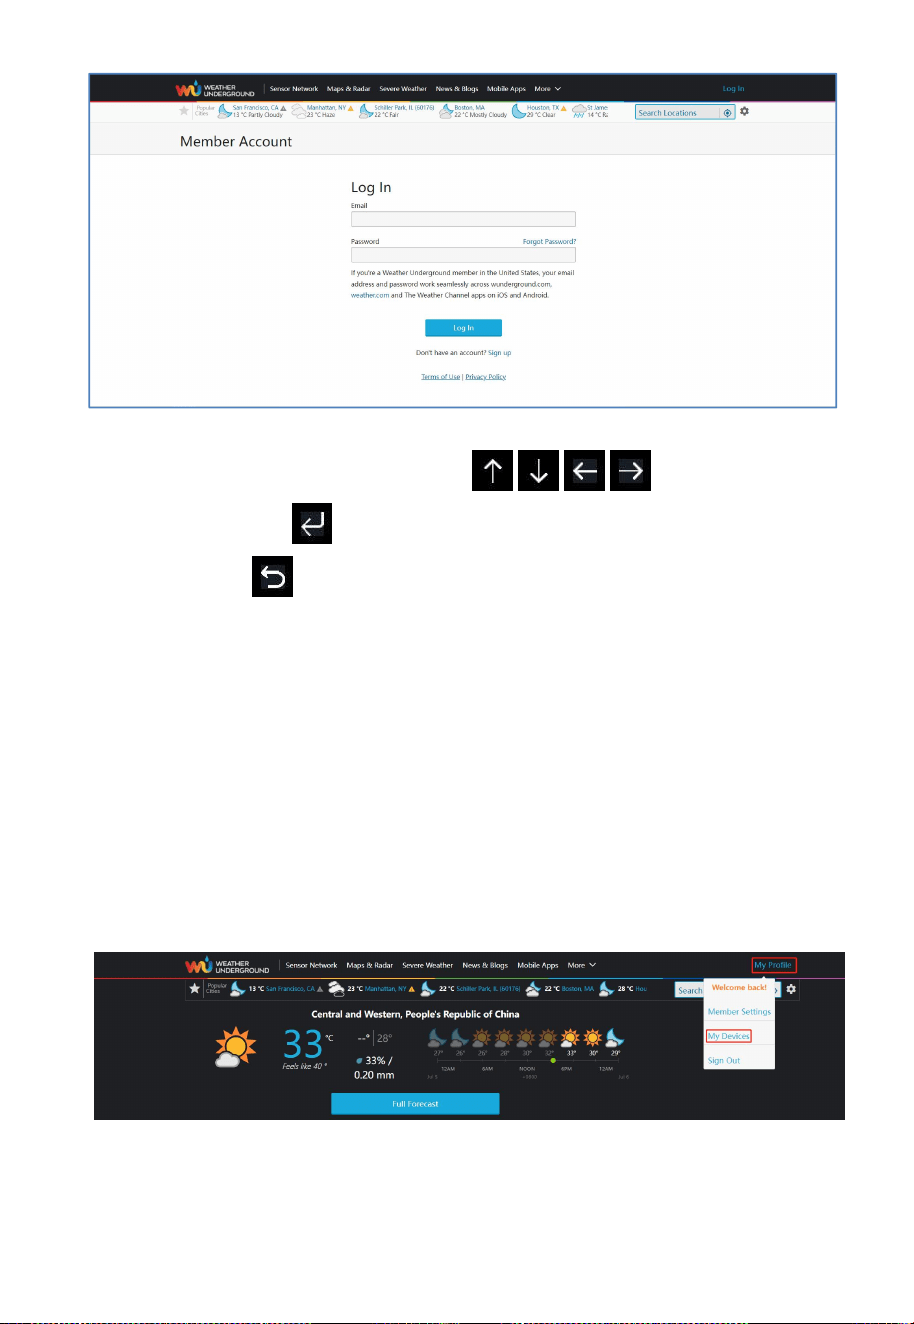
2) Click “My Profile” and select “My Devices” to register your station.
75
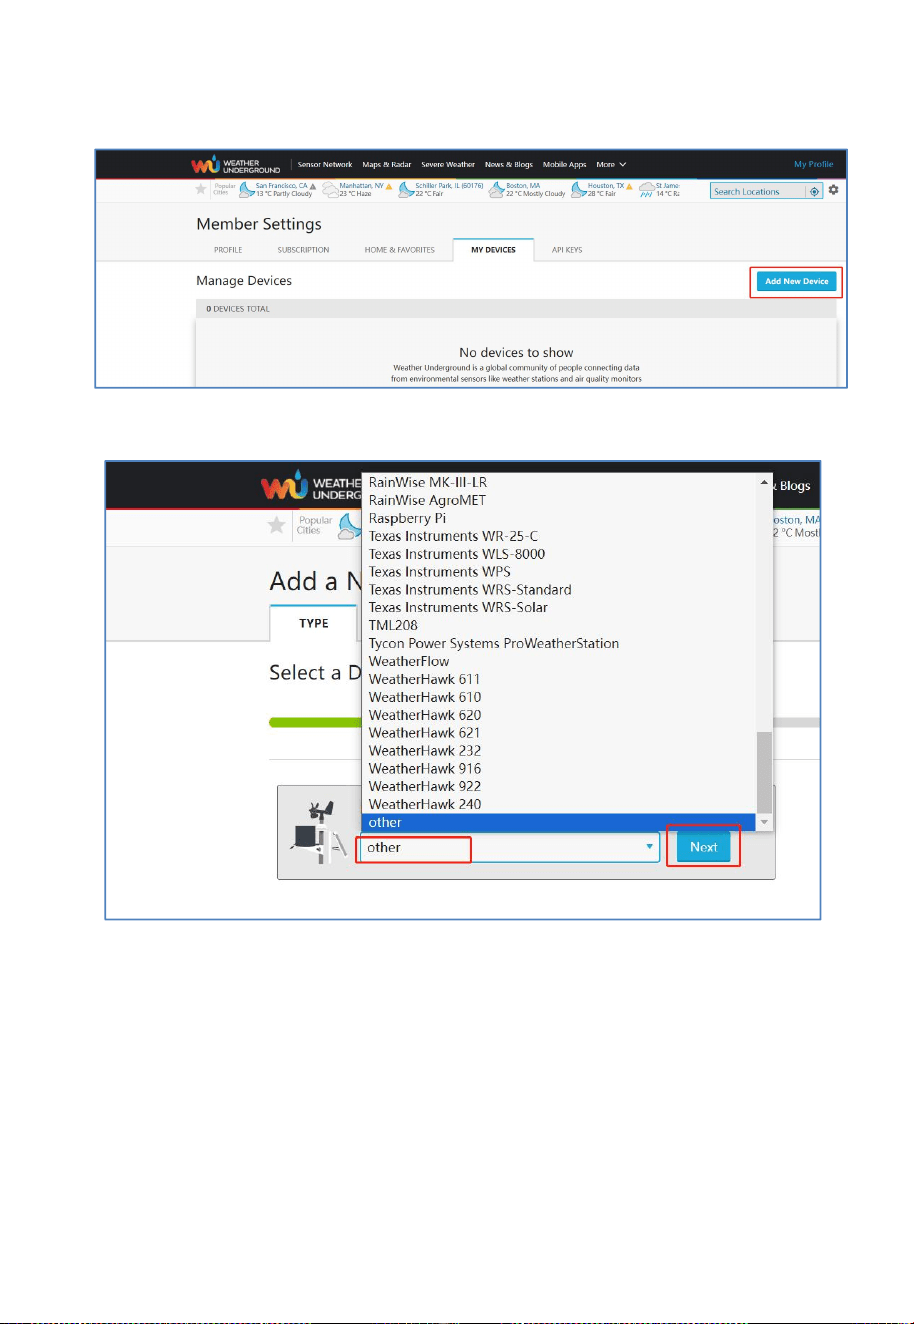
3) Select “Add New Device”.
4) Find the “TYPE”, select “other” ,then click “Next.
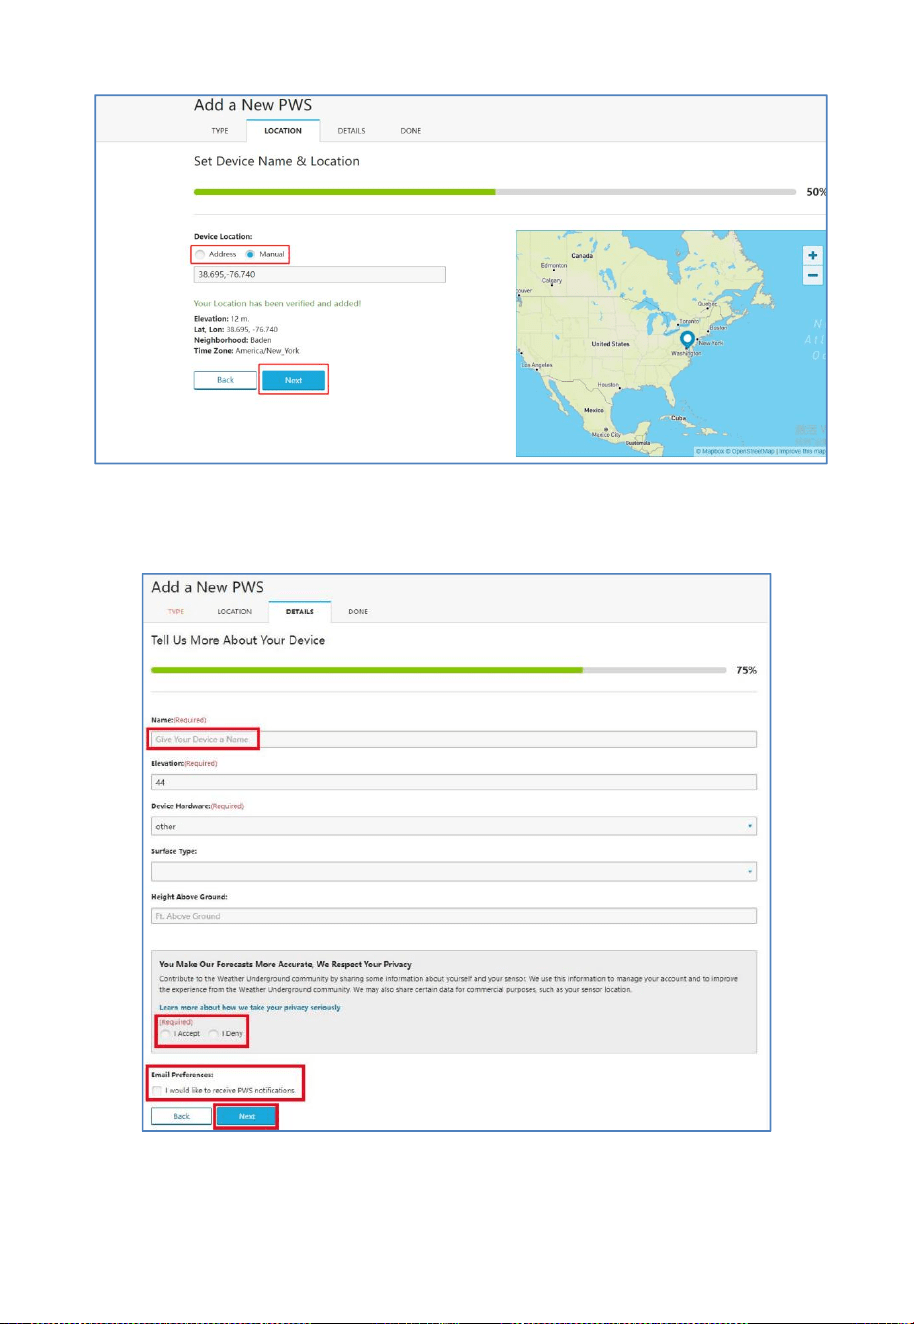
5) Select “Address”or“Manual”option, and find your local position.
Touch “Next”.
76
6) This time you will be asked the details about your weather station.
Go ahead and fill out the form.
77
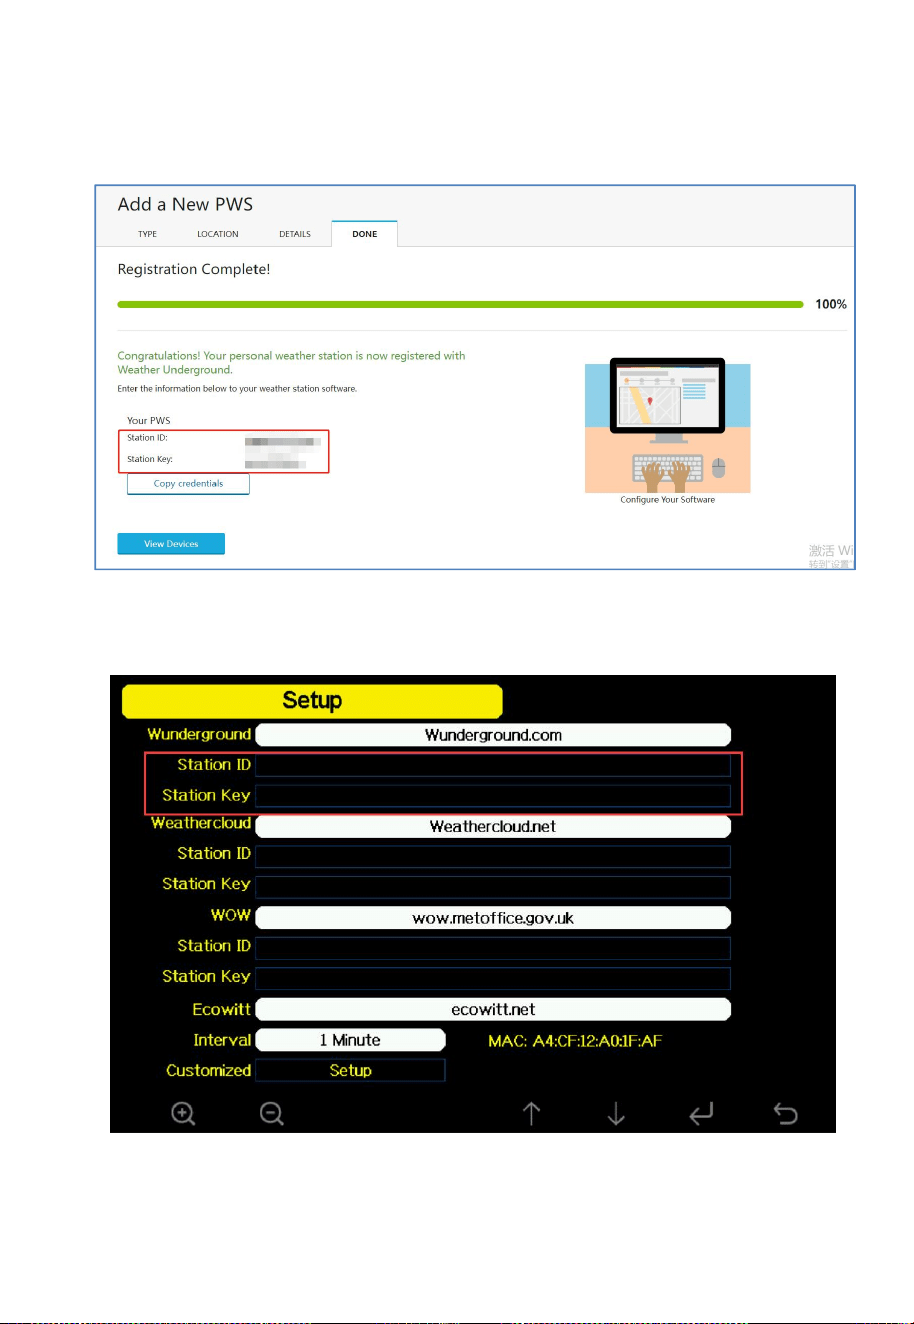
7) After completing the weather station, you will see Station ID and
Station Key.
8) Take note of the station ID and Key, then enter it in the Weather
Server.
78
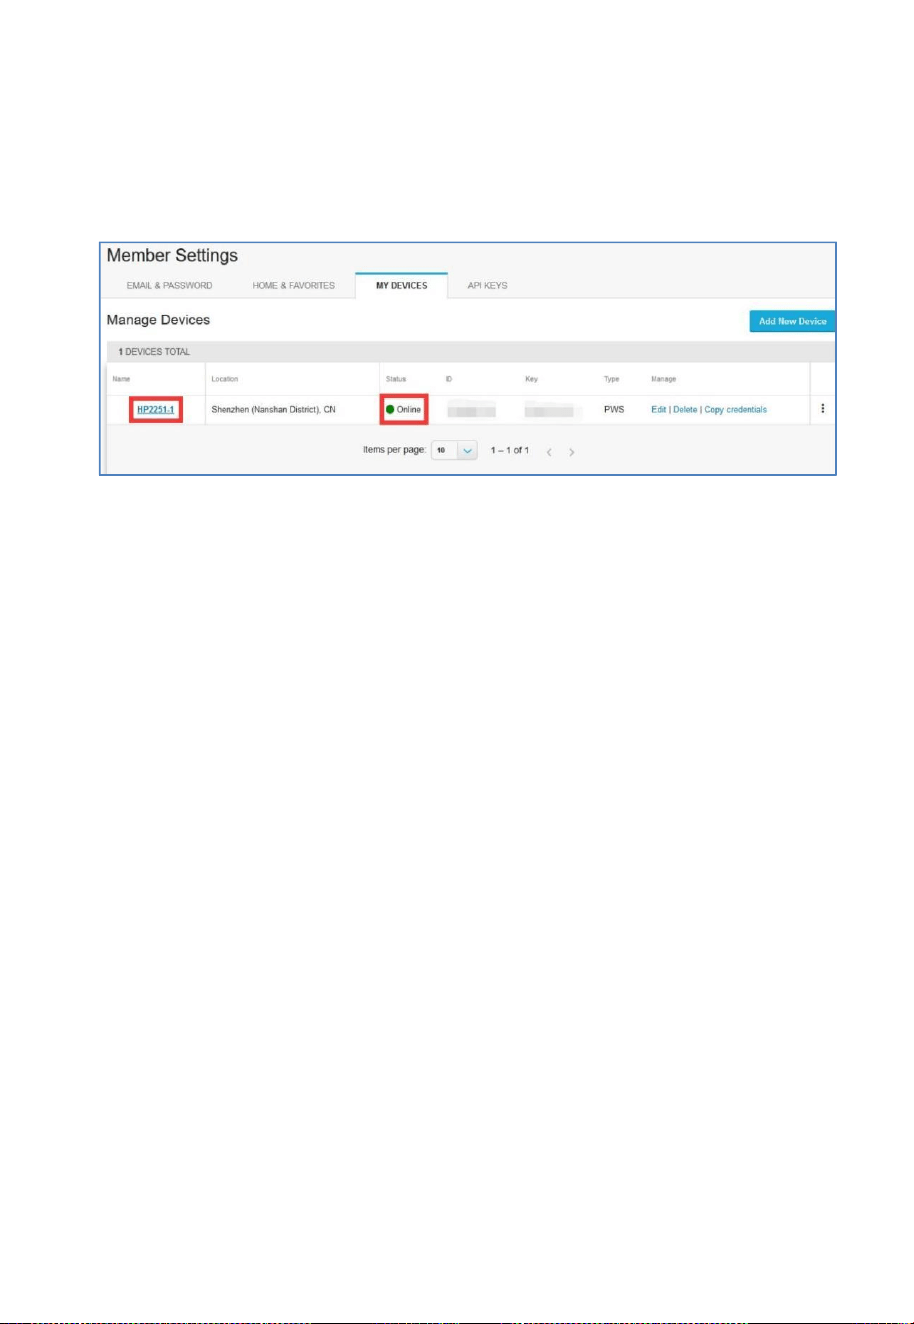
9) Refresh the page, you may have to wait about a few minutes until
the status becomes ‘Online’. Then you can click device name to
view data.
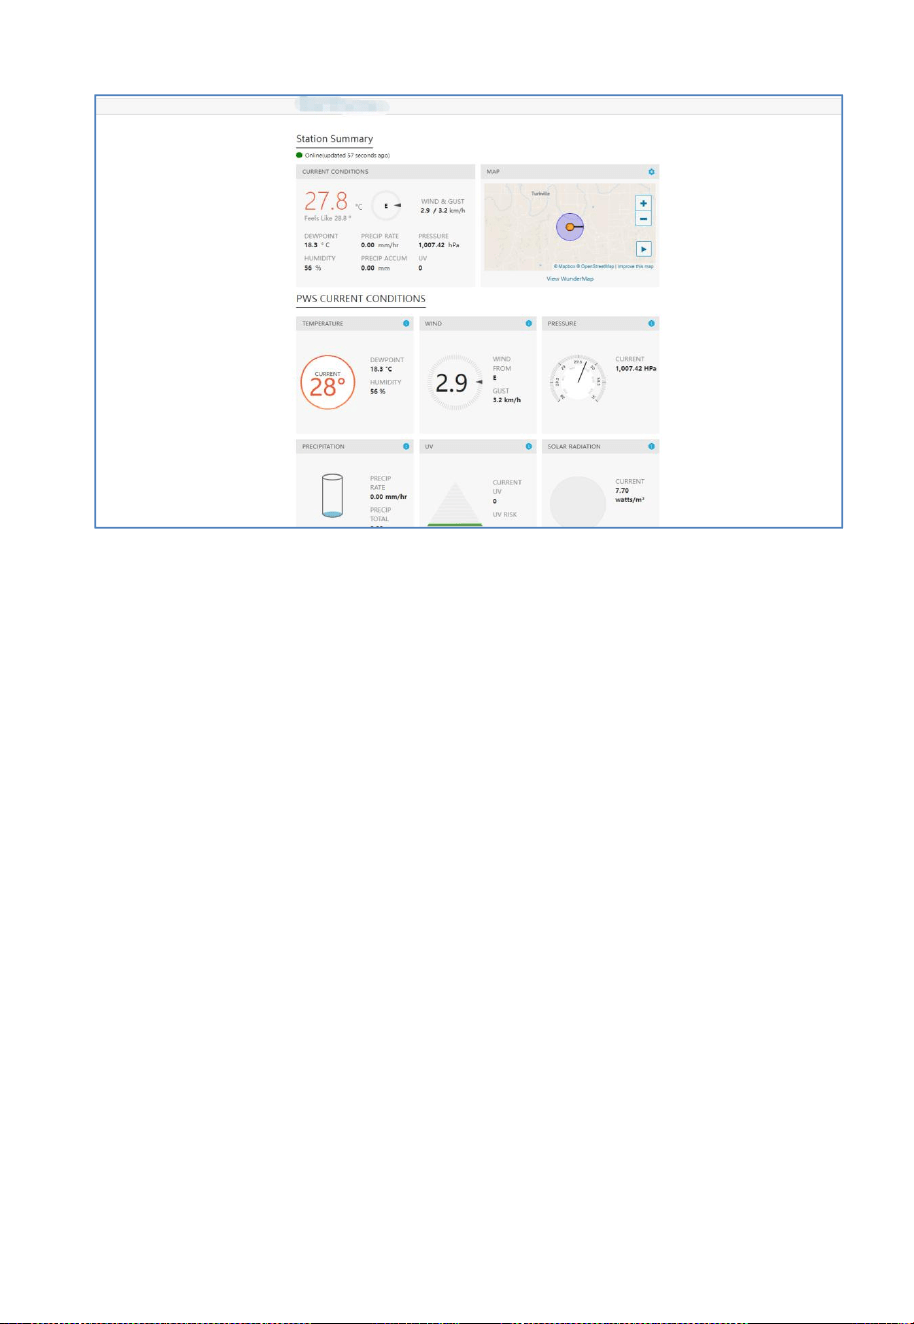
5.2 Viewing data on wunderground.com
The most basic way to observe your weather station’s data is by using the
wunderground.com web site. You will use a URL like this one, enter your
Station ID in the section “STATIONID”:
http://www.wunderground.com/personal-weather-station / dashboard ?
ID=ST ATIONID
It will show a page such this, where you can look at today’s data and
historical data as well:
79
5.3 Registering with and using Ecowitt Weather
Ensure the console is connected the Internet before registering.
Note: If you have already created an account for the Ecowitt App, you
can log in to ecowitt.net using that account.This server account and app
account are shared, and the data is the same.
80
In addition, if your app is already logged in and your device is online,
your data will automatically sync when you log in to ecowitt.net.
On the Weather Server page, set the reporting interval time (default:
1 minute).
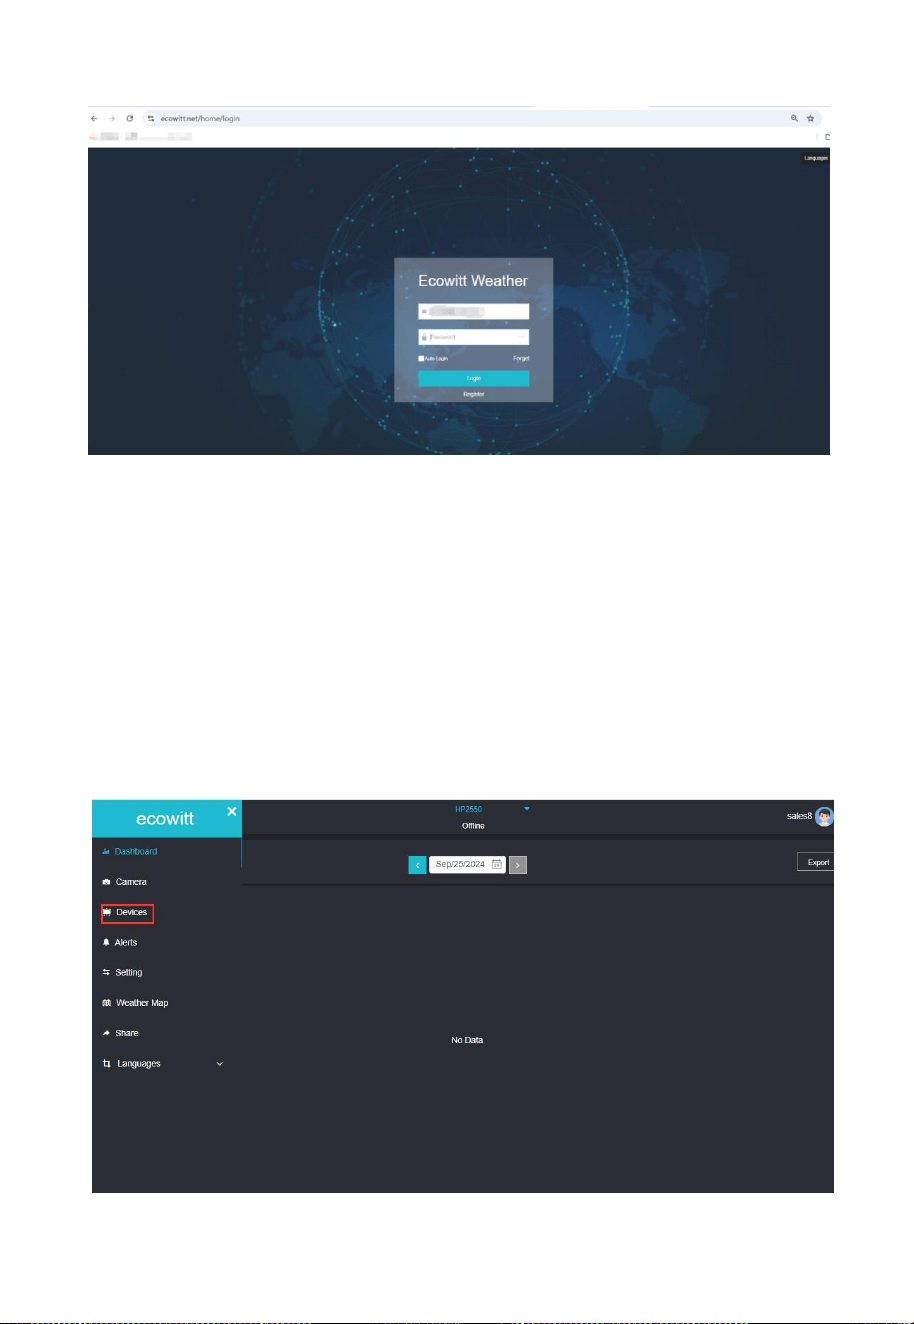
Visit the website: https://www.ecowitt.net on your computer and
login or finish the registration on the page.
Click the upper left menu button and select Devices.
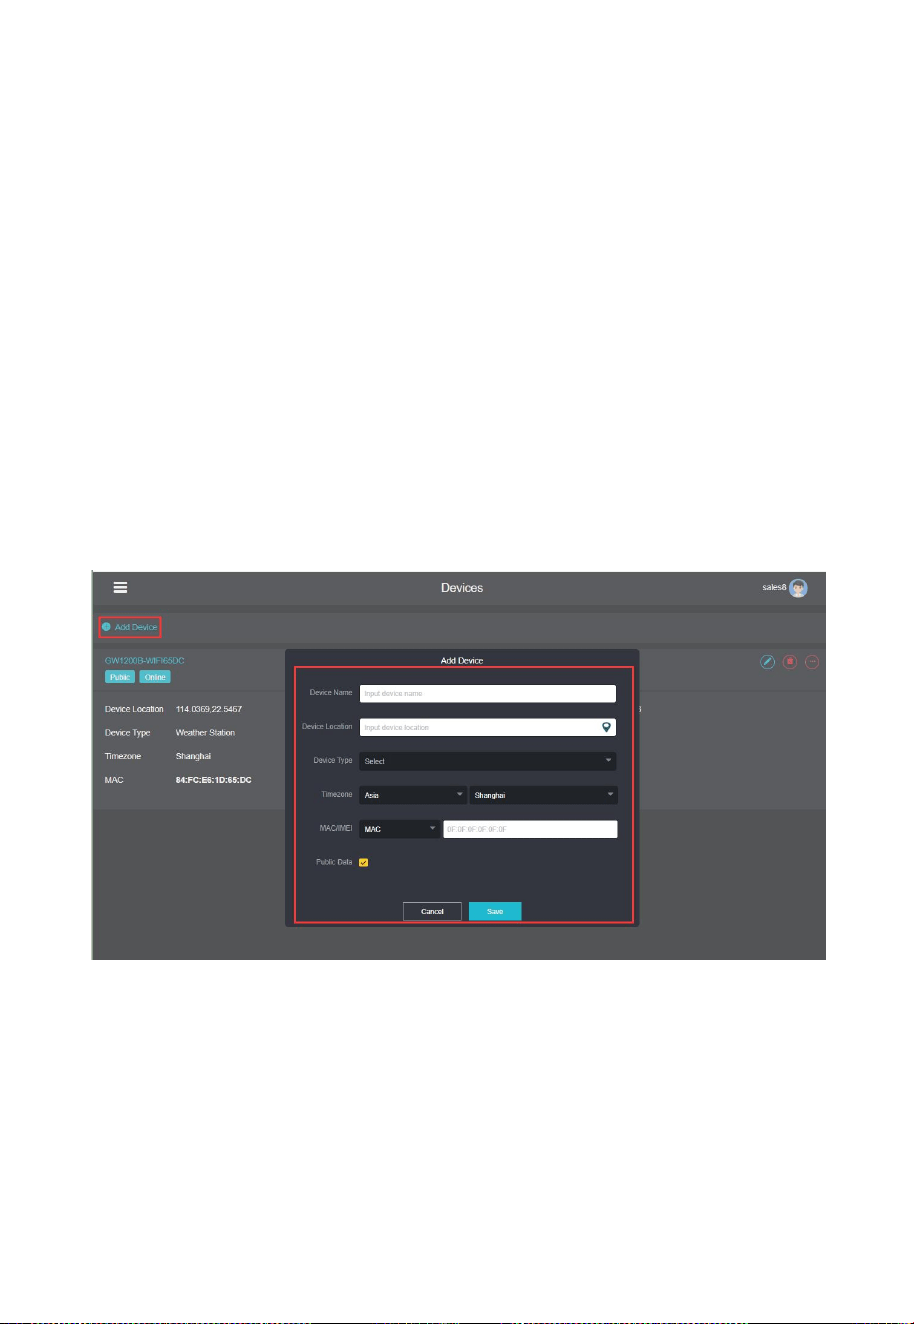
81
Click Add Device and input all the information needed (The MAC
address can be found on the console’s Weather Server page).Then
click
“
Save
”
.
Click Dashboard on the menu. Your sensor data would be available
on the dashboard within several minutes.
Note: When select device address on map, please wait until the map
displays before selecting your address.
You may add a shortcut to the ecowitt.net website on the home page of
your phone so that you can visit it just like opening an app.
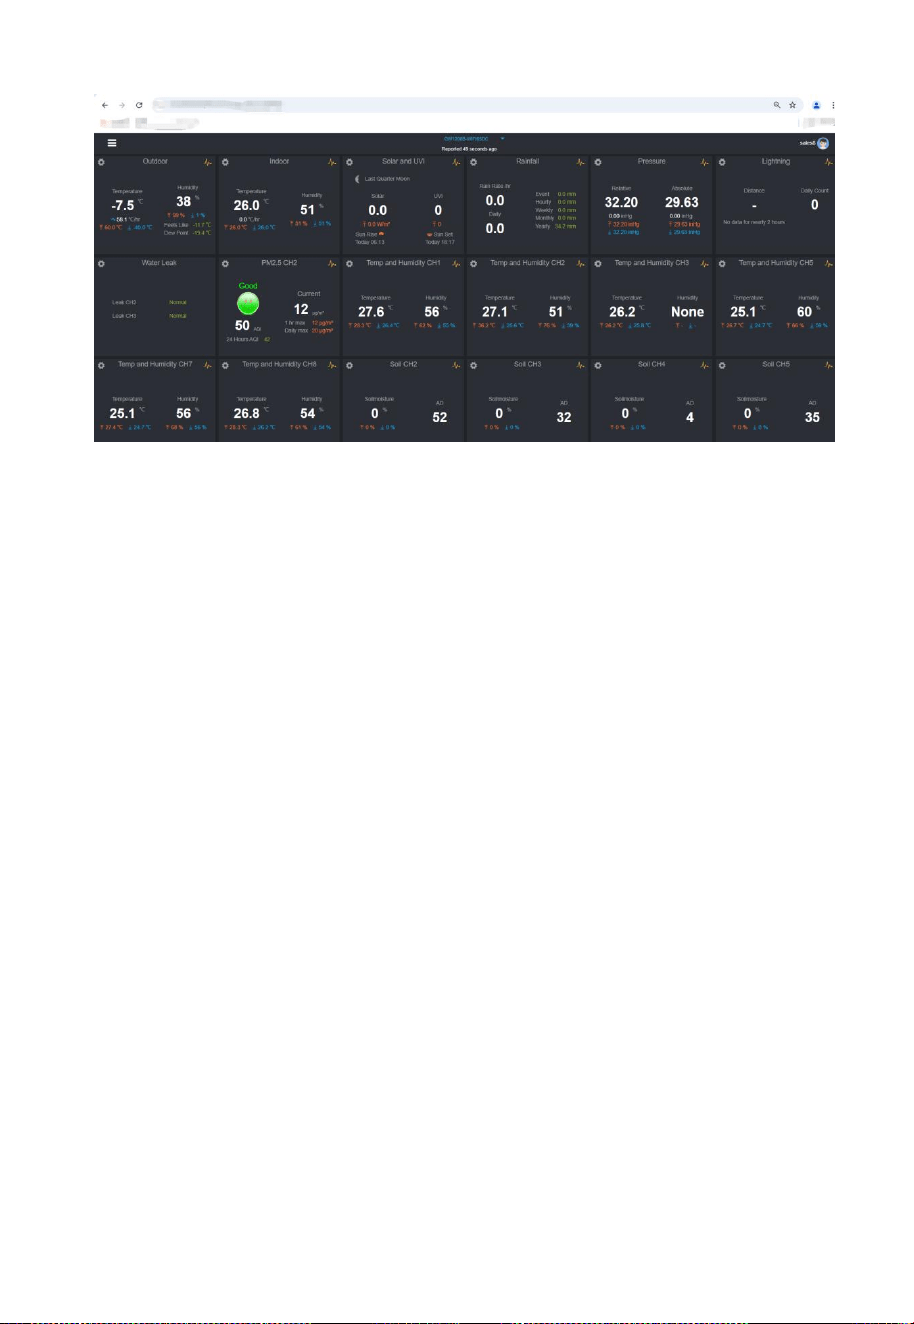
5.4 Viewing data on ecowitt.net
You can observe your sensor’s data by using the ecowitt.net website. Just
login the account.
82
Note: If you want to share your station data with other users, you may
use the Share option under the Menu to create a share link.
It will show the pages of dashboard, Graph display, List display, Weather
map and Email Alerts, where you can look at today’s data and historical
data as well.
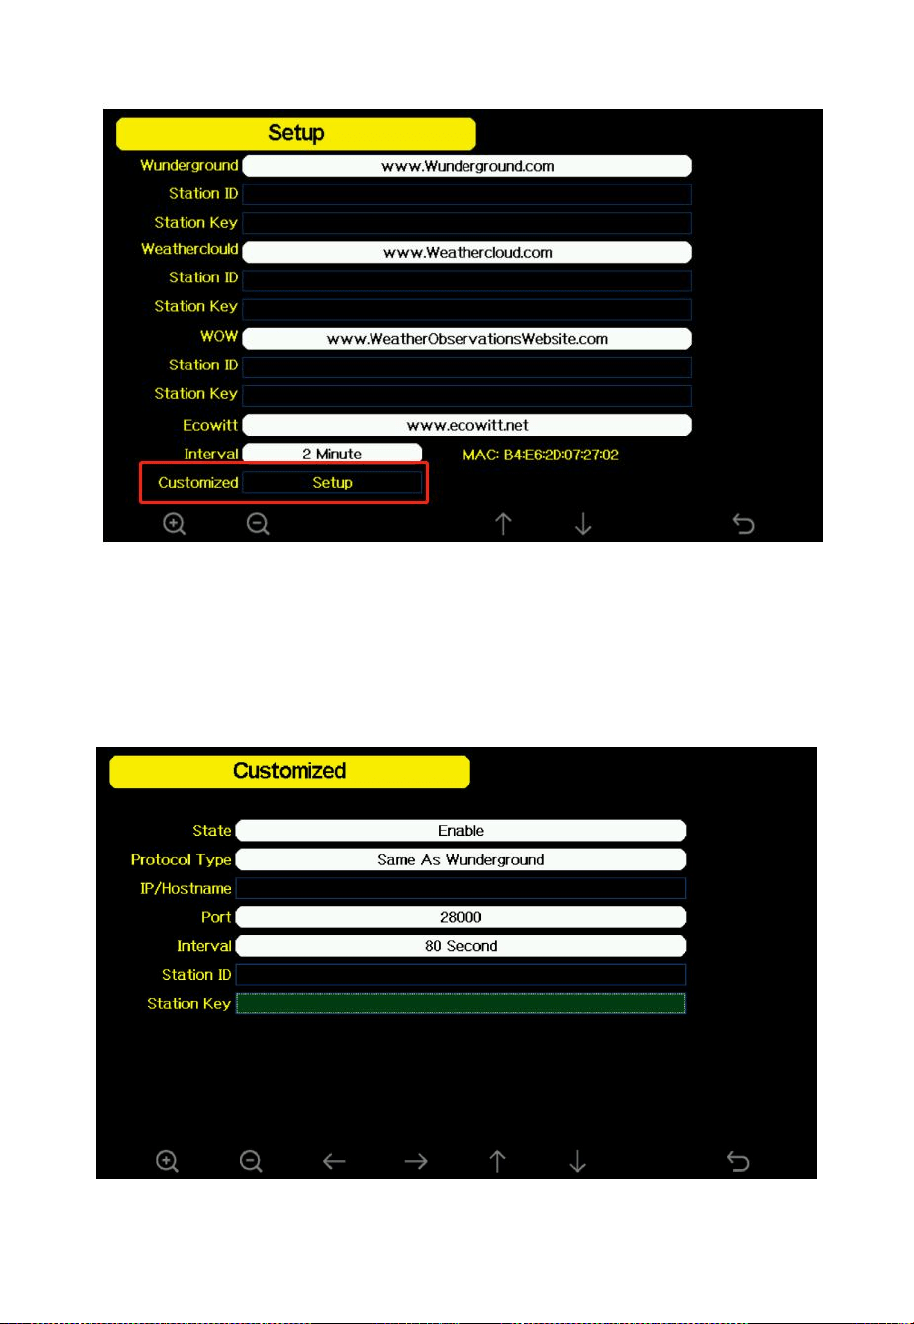
5.5 Customized server setup
For highly experienced users, it offers the option to send data to the
user’s own server. Click the “setup” button to enter Customized setup
screen.
83
Figure 43: Server setup screen
Select Enable button and select the protocol type. The website should be
able to process the same protocol (data content and format) which is
posted to Wunderground or to Ecowitt. Input all the information needed.
Figure 44: Customized server

84
Note: Touch the button to choose the Protocol Type. If it is Same As
Wunderground, the Station ID/Key are also same as Wunderground.
There is no need to input Station ID/Key when choosing Ecowitt.
6. Features
7" large TFT (high resolution) colored display console
Two background (dark/light) themes selectable
Indoor temperature, humidity
Absolute and Relative barometric pressure
Wind speed, wind direction, rainfall, outdoor temperature and
humidity, solar radiation and UV
Calculates dew point, wind chill, heat index, moon phase and
sunset/sunrise time, weather forecast & alarm
View historical records of sensors and graph directly on the console
Collects sensor data from various supported wireless sensors
Additional/optional sensors, please refer to Section 9.
Regional time: Date formats are DD-MM-YYYY, YYYY-MM-DD
and MM-DD-YYYY, time formats are h:mm:ss am,am
h:mm:ss,H:mm:ss, and 108 regional times are available;
Temperature unit: ℃, ℉ optional;
Air pressure unit: hpa, inHg, mmHg optional;
Wind speed unit: km/h, knot, mph, bft, ft/s, m/s optional;
Rainfall unit: mm, in optional;
Lighting unit: Lux, Fc, w/m² optional;

85
Longitude and latitude selection;
LCD screen backlight brightness adjustment;
Indoor temperature and humidity high and low alarm, outdoor
temperature and humidity high and low alarm, Feels Like high and
low alarm, dew point high and low alarm, absolute air pressure high
and low alarm, relative air pressure high and low alarm, time alarm,
average wind speed high alarm, gust high alarm, rainfall rate high
alarm and rainfall high alarm;
Indoor and outdoor temperature and humidity compensation, absolute
and relative air pressure compensation, wind direction compensation,
illumination correction coefficient, illumination unit conversion
compensation, ultraviolet correction coefficient, wind chill
correction coefficient, rainfall correction coefficient;
Indoor temperature and humidity, multi-channel temperature and
humidity, outdoor temperature and humidity, absolute air pressure,
relative air pressure, dew point, Feels Like, average wind speed,
wind gust, light intensity, UV index, hourly rainfall, daily rainfall,
weekly rainfall, monthly rainfall Amount, maximum and minimum
values of annual rainfall and timestamps, PM2.5, soil moisture;
Support WiFi networking;
Supports weather information upload server: WiFi firmware is Easy
weather x.x.x, supports uploading wunderground, weather cloud,
Weather Observations Website, Ecowitt, and custom websites;
Time synchronization: Support time synchronization with time server
time.nist.gov;
Low battery prompt for indoor, multi-channel and outdoor
transmitters;
Record meteorological information;

86
Supports SD card to upgrade firmware, supports SD card to record
weather information, supports SD card to back up historical data,
supports SD card to back up data in real time, and supports SD card
to change default configuration;
8 physical buttons;
When the backlight setting is turned on and off by default, when the
screen is turned off or on manually, it will not turn off or on until the
time set to turn off or turn on the screen.
Pushes sensor data to cloud weather services,
Custom own server data hosting possible when server data exchange
is compatible with either Wunderground or Ecowitt protocol
Manage sensor calibration setup
Manage sensor via sensor ID
Data storage service on Ecowitt server: https://ecowitt.net
Data storing interval:
1) by day: 5 minutes
2) by week: 30 minutes
3) by month: 4 hours
4) by year: 1 day
Stores data for past three months at 5-minute intervals
Stores data for past one year at 30-minute intervals
Stores data for past two year at 4-hour intervals
87
7. Specifications
Note: Out of range values will be displayed using “---”:
Temperature range
-60℃— 150℃ (-76℉ - 302℉)
Temperature resolution
0.1°C, or 0.1°F
Humidity range
1% ~ 99%
Humidity resolution:
1%
Barometric pressure range
300 – 1,200 hPa (8.85 – 35.4 inHg)
Barometric pressure accuracy
± 3 hPa (700 – 1,100 hPa)
Barometric pressure
resolution
0.1 hPa (0.01 inHg)
Sensor reporting interval:
60 seconds
Alarm Duration
120 seconds
Table 16 : Indoor sensor specification
Model
HP2560
Name
Weather Station(Receiver)
Dimensions(L*W*H)
196 x 188 x 50(mm)
Screen Size
155 x 87 (mm)
Weight
361.4(g)
Material of Plastic Casing
ABS
Material of Screen
TFT LCD
WLAN
802.11b/g/n 2.4GHz (802.11n, Max 150
Mbps)
WLAN Range
Over 30 meters (in open areas)
Console Operating
Temperature
0°C to 50°C (32℉ to 122℉)
Reading Update Interval
About 1 minute
Power Supply
3.5mm 5V DC to USB cable (included)
Battery Life
24 Hours (Back-up only)
Table 17: Console specification

88
8. Troubleshooting Guide
Look through the following and locate an issue or problem you are
experiencing in the left column and read possible solutions in the right
column. Table 17 is for troubleshooting related to the console, and Table
18 is for troubleshooting related to the transmitter (sensor).
Problem
Solution
After the console is
powered on, why does
the screen light up and
show "Starting" and then
quickly go black?
This is most likely a problem with the power
plug. Please connect the power cord to your
computer or mobile phone charger, then the
console will power on and work properly. If it
still doesn't work, there is something wrong with
the console, not the power supply.
Absolute pressure does
not agree with official
reporting station
You may be viewing the relative pressure, not
the absolute pressure.
Select the absolute pressure. Make sure you
properly calibrate the sensor to an official local
weather station.
Would I check the block
of “Automatic Host Firm
ware Upgrade?What are
the consequences?”
If an upgrade is available in the future, you can
check the About page for firmware updates. If
you set the “automatic upgrade” option, the
firmware will be updated once an update is
available.
Can I add an additional
screen for a different
room that takes data
from the same sensor
array?
Yes, you can add an additional console, one
transmitter can be connected to two or more
consoles at the same time.
89
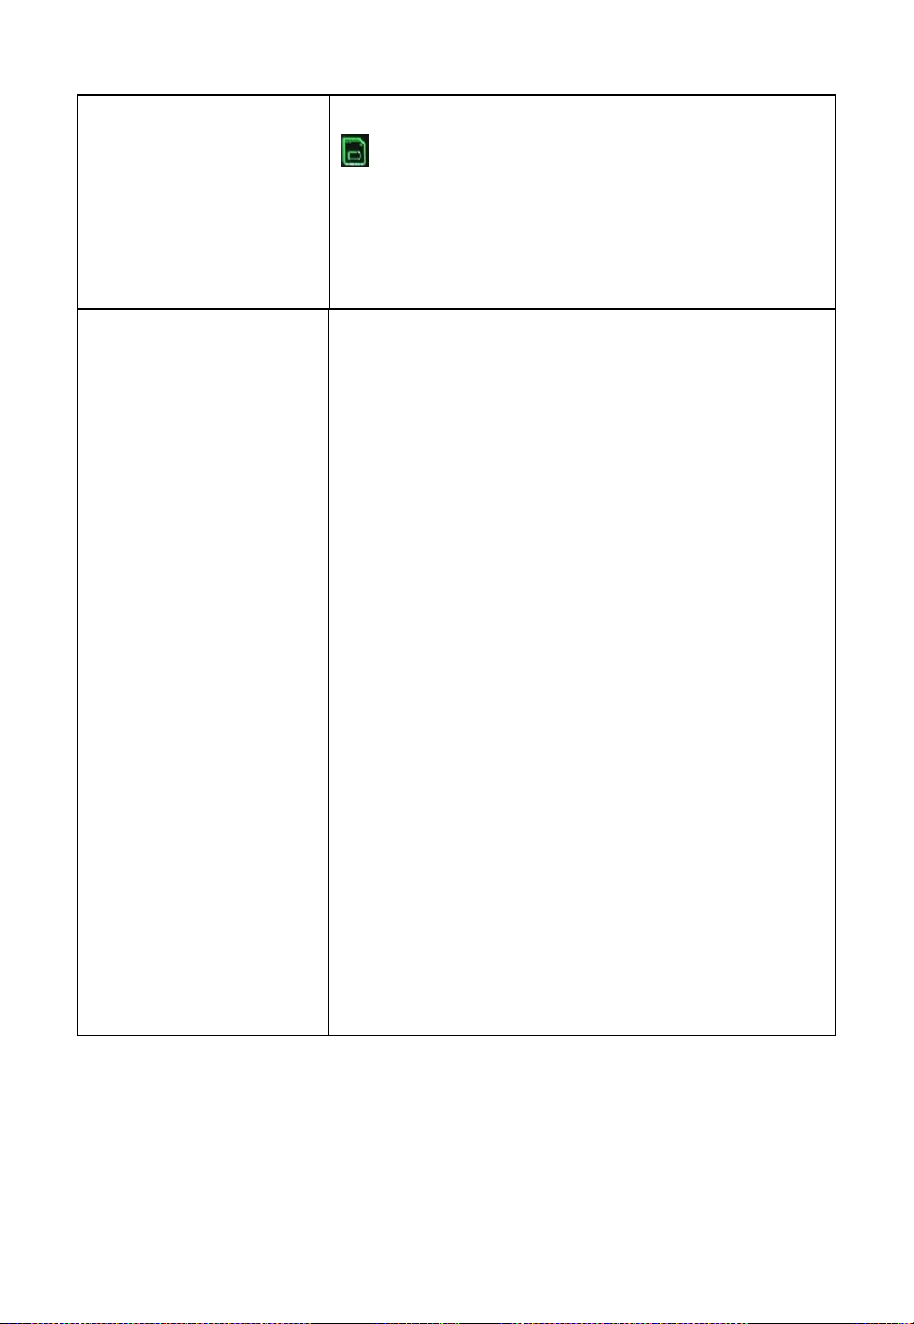
After inserting the SD
card, data backup failed.
Please first confirm whether the SD card
icon is displayed in the upper left corner of
the screen. If not, please remove the SD card and
reinsert it. If the backup is successful, it will
show Successful completion of the backup
100% (progress bar)
Data not reporting to
Wunderground.com
1.Confirm your password is correct. It is the
password you registered on Wunderground.com.
Your Wunderground.com password cannot
begin with a non-alphanumeric character (a
limitation of Wundeground.com, not the station).
Example,$oewkrf is not a valid password, but
oewkrf$ is valid.
2.Confirm your station ID is correct. The
station ID is all capital letters, and the most
common issue is substituting an O for a 0 (or
vice versa). Example,KAZPHOEN11, not
KAZPH0EN11.
3.The number "1" can be easily confused with
the lower case of letter "L".
4.Make sure the date and time are correct on
the console. If incorrect, you data may be
considered old data, not real time data, and will
be rejected.
5.Make sure your time zone is set properly. If
incorrect, you may be reporting old data, not real
time data( see 4 ).
6.Check your router firewall settings. The
console sends data via Port 80.
Table 18

90
Problem
Solution
The outdoor data
displayed on the
console
(temperature/humidity/
Feels Like/Dew Point)
is showing as "--°
" ,while other data is
displaying normally.
It's possible that the temperature and humidity
sensor module is malfunctioning. Please confirm
the issue by following these steps to operate the
outdoor sensor array:
1. Unscrew the screws at the bottom of the
radiation shield and open it, then remove the
module, check if there are any other data. If not,
press the reset button (the transmitter manual
describes the location of the reset button). If
other data are normal,plug in the module again.
If it still displays --°, it means the module is
broken.
2. Please take a photo of the sensor module, send
it and your order number to us. We will send you
a replacement based on the original module if
your order is under the warranty. Please replace
it upon receipt.
Outdoor sensor array
does not communicate
to the display console. –
i.e you don’t see the
weather data of either
one or all outdoor
sensors.
1. Power-cycle the console and see if there are
any changes – leave one minute time in
between.
2. If power-cycling the console doesn’t help, we
have to reset the outdoor array
A: software reset:
inserting the end of an opened paper-clip into the
reset hole (see manual for WS68 and WS69
array) or pressing the reset button (WS80, WS85
and WS90 array) for about five seconds will
restart the array firmware and the LED will start
blinking again (WS68/69 every 16 seconds,
WS80 every 5 seconds, WS85/90 every 9
seconds).
If A doesn’t provide the desired result, we have
to perform a hardware rest.

91
B: hardware reset
- take out the backup batteries
- cover the solar panel of the array tightly with
black tape or take it into a dark room and wait
until the LED stops burning or blinking. The
internal battery has to be discharged completely.
This may take up to 48 hours.
- once the LED has stopped blinking, re-insert
the batteries.
- the array should power-up and start blinking
again every 5-16 seconds depending on the array
model.
Rain gauge reports rain
when it is not raining
An unstable mounting solution (sway and
vibrations in the mounting pole) may result in
the tipping bucket incorrectly incrementing
rainfall. Make sure you have a stable, level
mounting solution.
Wireless remote
(thermo-hygrometer)
not reporting in to
console.
There are dashes on the
display console.
The maximum line of sight communication
range is about 300’. Move the sensor assembly
closer to the display console.
Re-synchronize the remote sensor(s).
Install a fresh set of batteries in the remote
sensor(s).
Make sure the remote sensors are not
transmitting through solid metal (acts as an RF
shield), or earth barrier (down a hill).
Radio Frequency (RF) Sensors cannot transmit
through metal barriers (example, aluminum
siding) or multiple, thick walls.
Move the display console around electrical
noise generating devices, such as computers,
TVs and other wireless transmitters or
receivers.
Table 19
92
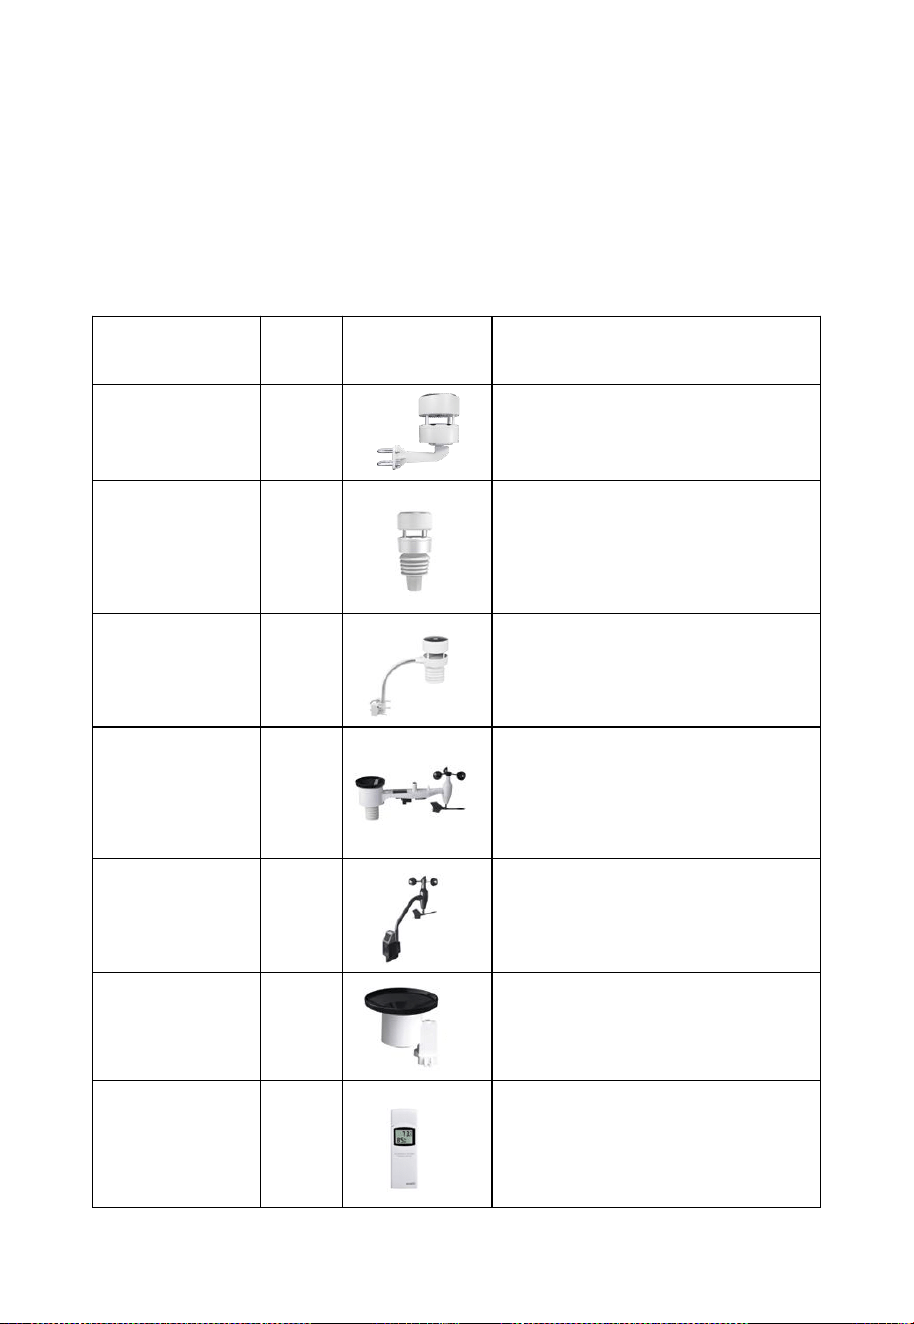
9. Optional Sensors
The RF reception function will always be turned on to receive data from
multiple sensors at any time.
Note: Max QTY of the following table 18 means the maximum number
of different sensors that can be connected to the HP2560.
Sensor Model
Max
QTY
Picture
Functions
WS85
1
Wind speed/direction, rainfall
WS90
1
Outdoor,temperature&humidit
y, light, UV, wind
speed/direction, rainfall
WS80
1
Outdoor
temperature&humidity, light,
UV, wind speed/direction
WS69
1
Outdoor
temperature&humidity, light,
UV, wind speed/direction,
rainfall
WS68
1
Light, UV, wind
speed/direction
WH40
1
Rainfall
WN32P
1
Indoor temperature, humidity
and pressure
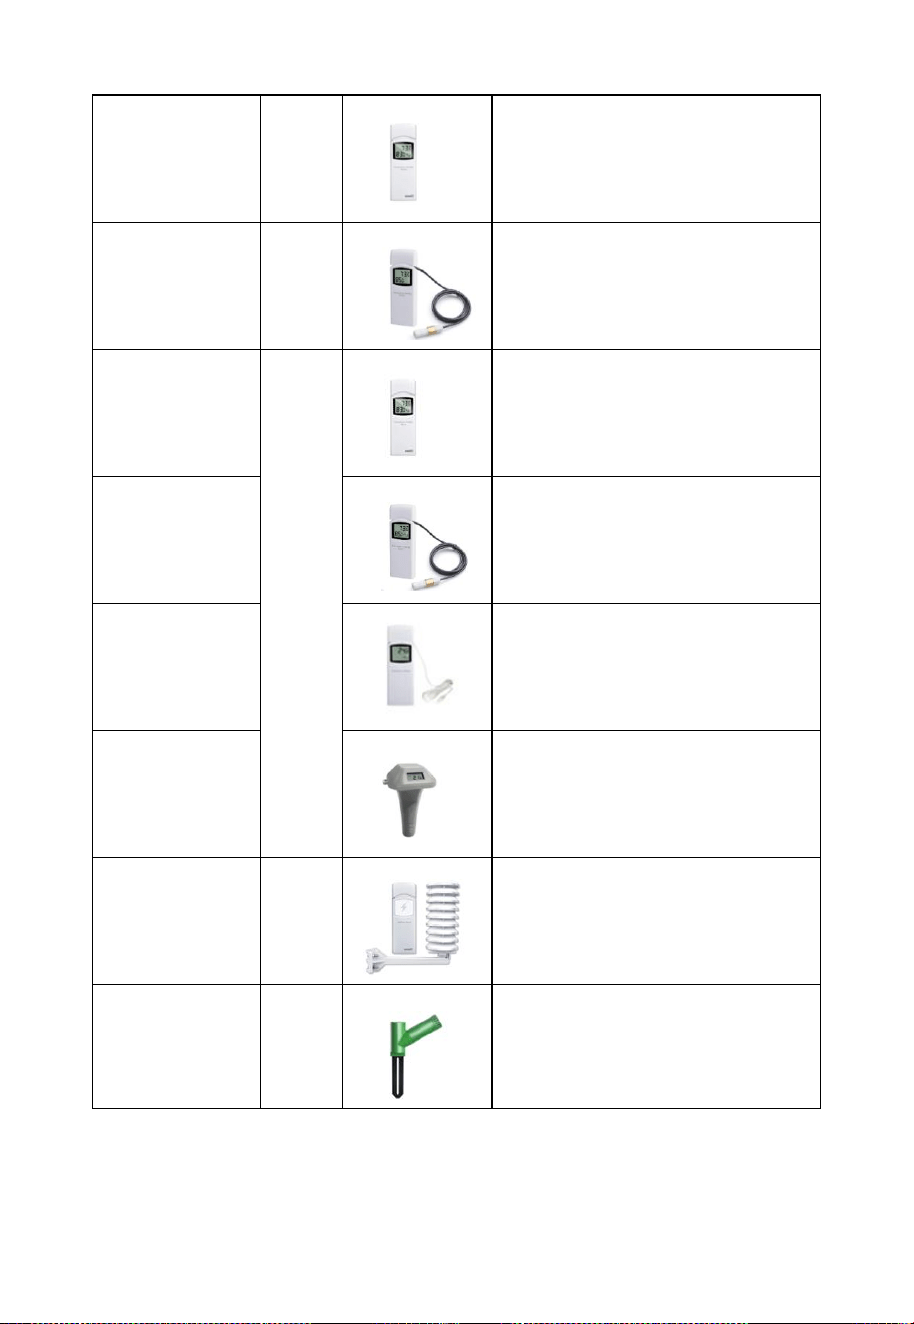
93
WN32
1
Outdoor temperature and
humidity
WN32_EP
1
Temperature and Humidity
WN31
8
Temperature and humidity
WN31_EP
Temperature and Humidity
WN30
Temperature
WN36
Pool temperature
WH57
1
Lightning detection
WH51
16
Soil moisture
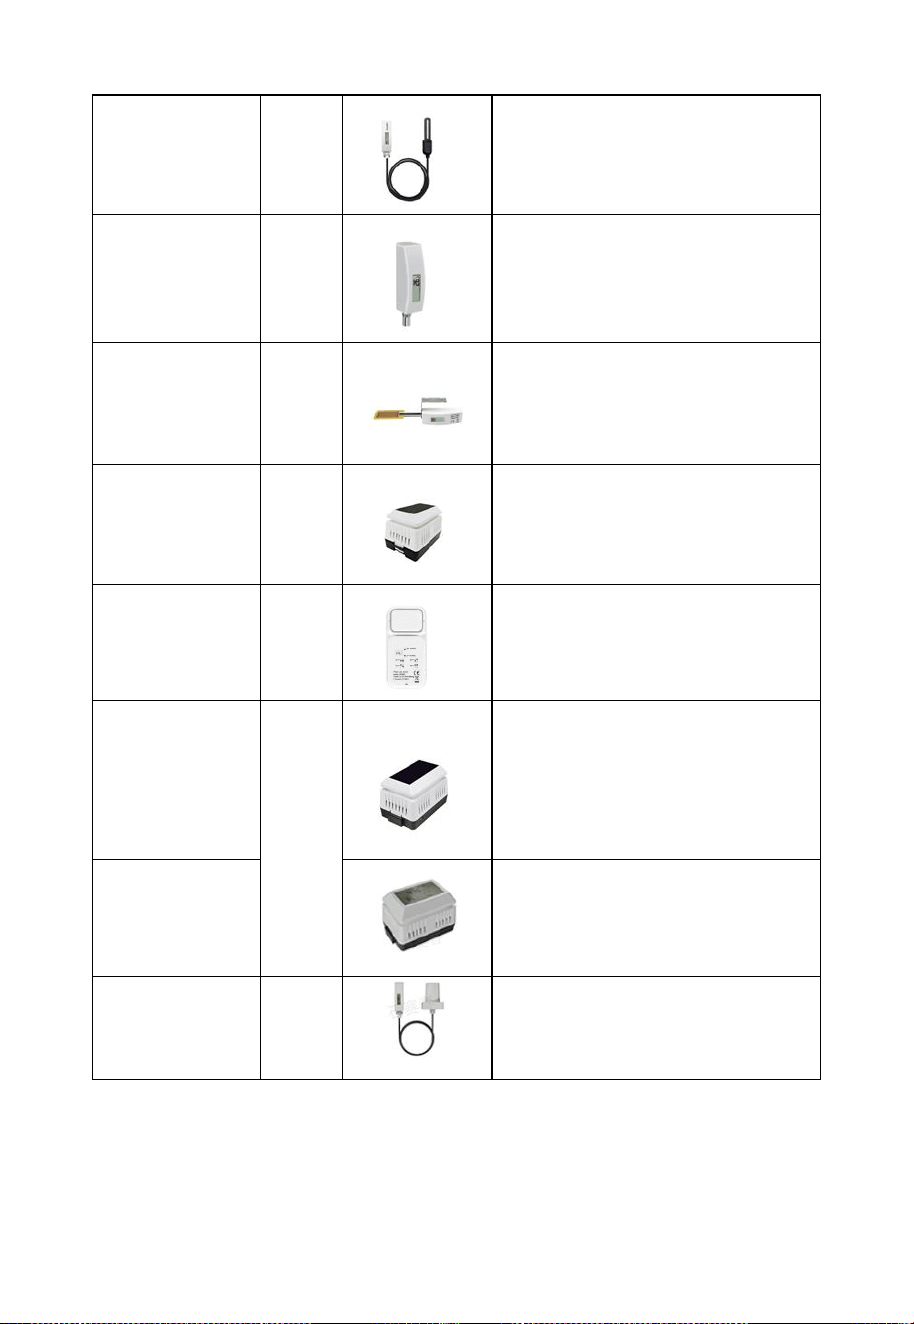
94
WH51L
Soil moisture
WN34L/S/D
8
Temperature
WN35
8
Leaf wetness
WH41/WH43
4
PM2.5
WH55
4
Water leak detection
WH45/WH46
1
WH45:CO₂,PM2.5,PM10,
temperature and humidity
WH46:CO₂,PM1.0,PM2.5,
PM4.0,PM10,temperature and
humidity
WH46D
CO₂ (Carbon Dioxide),
PM(Particulate Matter),
temperature and humidity
LDS01
4
Laser distance sensor
Table 20

95
10. Warranty Information
We disclaim responsibility for any technical error or printing error or the
consequences thereof.
All trademarks and patents are recognized.
We provide a 2 years limited warranty on this product against
manufacturing defects or defects in materials and workmanship.
This limited warranty begins on the original date of purchase, is valid
only on products purchased, and only to the original purchaser of this
product. To receive warranty service, the purchaser must contact us for
problem determination and service procedures.
This limited warranty covers only actual defects within the product itself
and does not cover the cost of installation or removal from a fixed
installation, normal set-up or adjustments, or claims based on
misrepresentation by the seller, or performance variations resulting from
installation-related circumstances.
Manufacture: Shenzhen Fine Offset Electronics Co., Ltd. Address: 4/F,
Block C, JiuJiu Industrial City, Shajing Town, Baoan District, Shenzhen
City, China

96
11. FCC
This device complies with part 15 of the FCC Rules. Operation is subject
to the condition that this device does not cause harmful interference (1)
this device may not cause harmful interference, and (2) this device must
accept any interference received, including interference that may cause
undesired operation.
Changes or modifications not expressly approved by the party responsible
for compliance
could void the user's authority to operate the equipment.
NOTE: This equipment has been tested and found to comply with the
limits for a Class B digital device, pursuant to Part 15 of the FCC Rules.
These limits are designed to provide reasonable protection against
harmful interference in a residential installation. This equipment
generates, uses and can radiate radio frequency energy and, if not
installed and used in accordance with the instructions, may cause harmful
interference to radio communications. However, there is no guarantee
that interference will not occur in a particular installation.
If this equipment does cause harmful interference to radio or television
reception,
which can be determined by turning the equipment off and on, the user is
encouraged to try to correct the interference by one or more of the
following measures:
-- Reorient or relocate the receiving antenna.
-- Increase the separation between the equipment and receiver.
-- Connect the equipment into an outlet on a circuit different
from that to which the receiver is connected.

97
-- Consult the dealer or an experienced radio/TV technician for help.
To maintain compliance with RF Exposure guidelines, This equipment
should be installed and operated with minimum distance between 20cm
the radiator your body: Use only the supplied antenna.
IC Caution:
English:
This device contains licence-exempt transmitter(s)/receiver(s) that
comply with Innovation, Science and Economic Development Canada’s
licence-exempt RSS(s). Operation is subject to the following two
conditions:
1. This device may not cause interference.
2. This device must accept any interference, including interference that
may cause undesired operation of the device.
French:
L’émetteur/récepteur exempt de licence contenu dans le présent appareil
est conforme aux CNR d’Innovation, Sciences et Développement
économique Canada applicables aux appareils radio exempts de licence.
L’exploitation est autorisée aux deux conditions suivantes :
1. L’appareil ne doit pas produire de brouillage;
2. L’appareil doit accepter tout brouillage radioélectrique subi, même si
le brouillage est susceptible d’en compromettre le fonctionnement.

98
12. Contact Us
12.1 After-sales Service
Order Issues:
If you encounter any missing or incorrect shipments of Ecowitt products
purchased, please reach out to the respective platform's customer service
from the store where you bought the product for assistance.
Usage Inquiries:
Our product is continuously changing and improving, particularly online
services and associated applications. To download the latest manual, and
additional help, and for any issues related to product usage feel free to
contact our customer support team at support@ecowitt.com.We are
committed to providing assistance and resolving any concerns you may
have.
12.2 Stay in Touch
Ask questions, watch setup videos, and provide feedback on our social
media outlets. Follow Ecowitt on Discord,Facebook,YouTube and
Twitter.
Copyright © 2025 ecowitt All Rights Reserved. DC040925