Loading ...
Loading ...
Loading ...

1773/1775/1777
Users Manual
36
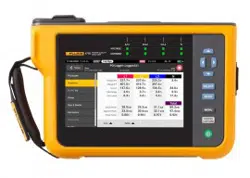
Power
The Power screen shows the details of phase by phase active power, apparent power, non-
active power, power factor, and harmonics power. These values are derived in accordance
with standard IEEE1459.
Dips and Swells
The Dips and Swells screen shows voltage and trend graph with phase voltage in the upper half
and neutral voltage in the lower half. Tap on Voltage or Current at the bottom of the screen to
toggle the trend between voltage and current. This provides information for each phase or all
phases.
The data on screen is either Live or Session data. Tap on the button to select the view. The
Session data screen shows any events in a list with the date and time of the event, the
duration, the event type, the value, severity, and the applicable phase. Tap an item on the list to
see more details. The waveshape shows several cycles of the waveform and the trigger point.
Often, the waveshape data does not show a strong indication of the event as the trigger is
based on an RMS value that occurs over many cycles. The RMS profile is chosen in the same
screen to show the limits for dips and swells. The profile indicates where the voltage was
outside of the limit. Colored markers indicate the minimum and maximum voltages from the list
that shows on the right of the screen. The display can be customized to show different
combinations of voltage and current by individual phase or multiple phases.
Harmonics
Voltage, current, and power harmonics show as either a percentage of the fundamental or
RMS values by phase. Harmonics are available as three types Integer harmonic from 0 to 50,
Inter-harmonics, and harmonics from 2 kHz to 30 kHz. Harmonics show as either bargraphs
with the % or RMS scale or in a live trend. This option shows the available bargraph form in the
top half of the screen. The lower half of the screen shows a graph of the chosen harmonic. Tap
on the corresponding harmonic or use the cursor keys to select each harmonic.
Transients
The Transients screen shows the displayed values and access to data is identical to dips and
swells with one exception when in the Session screen, transients are listed in the same way as
dips and swells with description by the date and time of the vent, the duration, the event type,
the value, severity, and the applicable phase. Select any item from the list to see the waveform
on the screen.
Any data that is considered to be a transient will have a frequency >1.5 kHz as the
measurements to the transient recording session are filtered to reject signal frequencies
below the filter pass frequency. All 1 MHz sampled transients have a time resolution of 1 μs and
20 MHz sampled transients have a 50 ns resolution.
1.888.610.7664 sales@GlobalTestSupply.com
Fluke-Direct.com
Loading ...
Loading ...
Loading ...