Loading ...
Loading ...
Loading ...

3 Phase Power Quality Analyzer
Measurement Data Review
35
Measurement Data Review
The Analyzer has features for measurement data review in both the PQ Meter mode and the
PQ Logger mode. The PQ Logger mode also includes the PQ Health feature.
PQ Health
The PQ Health feature is available only in PQ Logger Mode.
When the PQ Logger Mode session starts, the Analyzer shows the overall PQ Health of the
electrical system as a summary of these parameters:
Frequency
Voltage
Harmonics
Unbalance
Flicker
Mains Signaling
Events (dips, swells and interruptions)
Rapid Voltage Changes
Waveform Deviations
The frequency, unbalance, and events have a single bar.
Voltage variations and voltage harmonics show as three bars that depend on the configured
topology. The length of a bar increases if the related parameter is further away from its nominal
value. The bar turns from green to red if a maximum allowed tolerance requirement is
surpassed. When the standard defines two limits for a parameter (for example, voltage
variations have a limit for 95 % of the time and a limit for 100 % of the time) the bar changes
from green to orange when the parameter surpasses the 95 % limit but does not exceed the
100 % limit.
The exact representation shown on this screen depends up on the Power Quality standard
chosen in the setup. See Power Quality Standard. As the measurement proceeds, the green
bars typically grow as they get to the allowable limit indicated with a dotted bar. If the values
start to exceed the 95 % or 100 % limits, the bars turn to yellow or red. This is an immediate
insight that there is a problem.
Overview
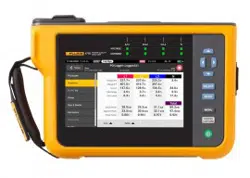
The Overview screen is a summary of the voltage current and power variables and THD (Total
Harmonic Distortion).
V/A/Hz
The V/A/Hz screen is a more detailed view of voltage, current, and frequency. Voltage values
include phase-to-neutral, peak-to-peak, peak, and crest factor. Current values includes peak
current and crest factor. Any analog variables show at the bottom of the screen.
1.888.610.7664 sales@GlobalTestSupply.com
Fluke-Direct.com
Loading ...
Loading ...
Loading ...