Loading ...
Loading ...
Loading ...
1586A
Users Manual
4-14
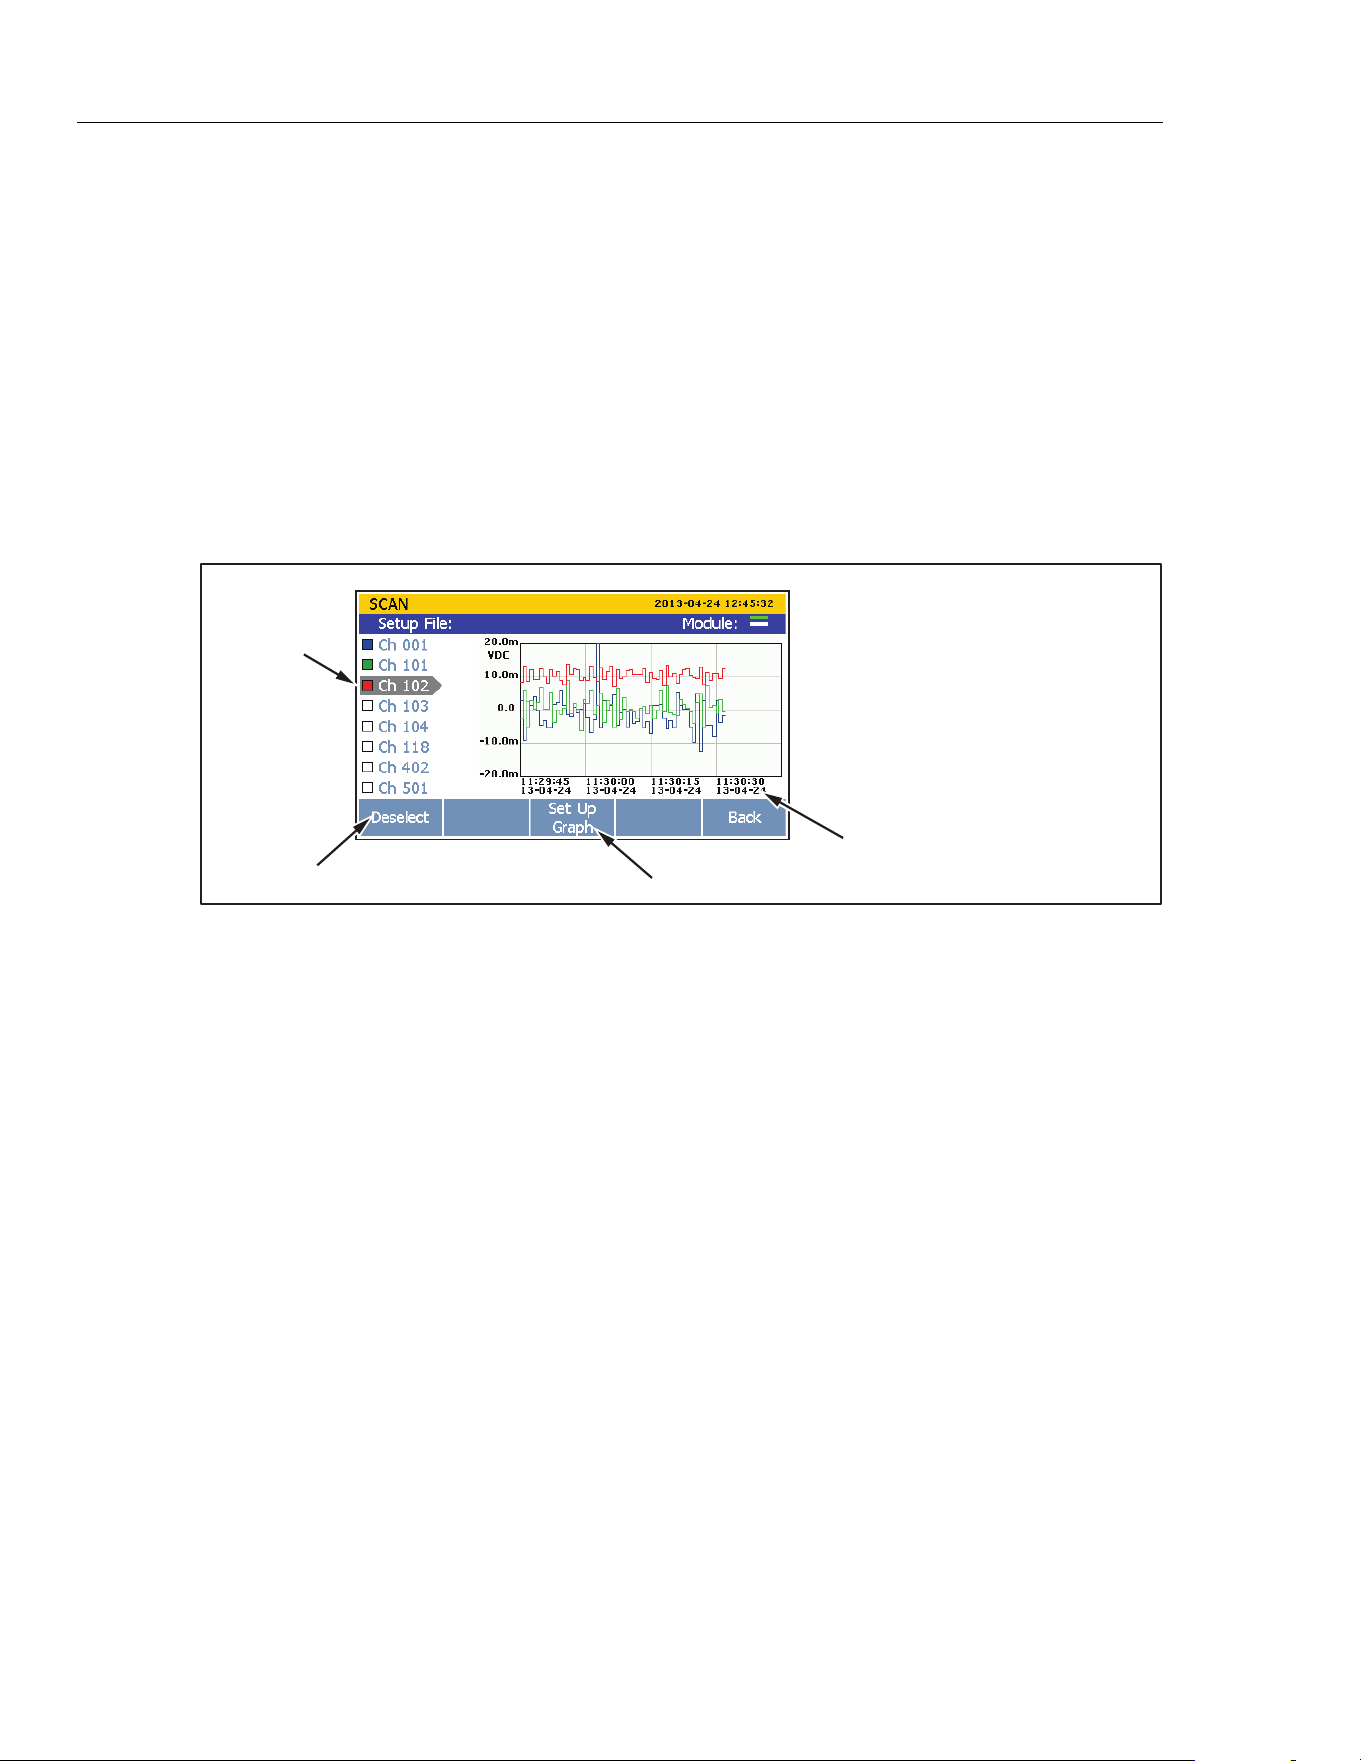
Graph the Measurements
The Scan function has a graph feature that lets the user display the measurement data in a
graph. This feature is located in the Scan menu (push then push ).The graph
automatically scales to fit all the information on the display when opened. To refine the
data, the graph can be manipulated with the front-panel arrow keys as shown in
Figure 4-5.
Notes
The maximum number of channels that can be graphed at once is four.
Selection of two or more channels with different input types (such as
temperature and milliamps) can make the graph difficult to read because
they do not share the same unit. To prevent this, only select channels of the
same input type or view the channels one at a time.
Selected
Channels
and Key
Time Stamps
Select or Deselect
Additional Setup Options
Graph Controls
(Front-Panel Keys)
H
J
I
K
Zoom Out
Zoom In
Move Right (in History Mode)
Move Left (in History Mode)
hcn062.eps
Figure 4-5. Graph Feature
To see the measurement data in a graph:
1. Push
.
2. Push to show the graph. To show a channel on the graph, use and to
select a channel, then push to select or deselect. To view additional graph
options, push .
1.888.610.7664 sales@GlobalTestSupply.com
Fluke-Direct.com
Loading ...
Loading ...
Loading ...