Loading ...
Loading ...
Loading ...
Monitor - Power Quality Monitoring
Bar Graph Screen16
16-7
Measurement specific features:
• Vrms events: an event is recorded each time that a 10 minute aggregated rms value
violates its limits.
• Harmonics events: an event is recorded each time a 10 minute aggregated harmonic
or THD violates its limit.
• Flicker events: an event is recorded each time Plt (long term severity) violates its
limit.
• Dips/Interruptions/Rapid Voltage Changes/Swells events: an event is recorded each
time one of the items violates its limits.
• Unbalance, Frequency events: an event is recorded each time that a 10 minute
aggregated rms value violates its limits.
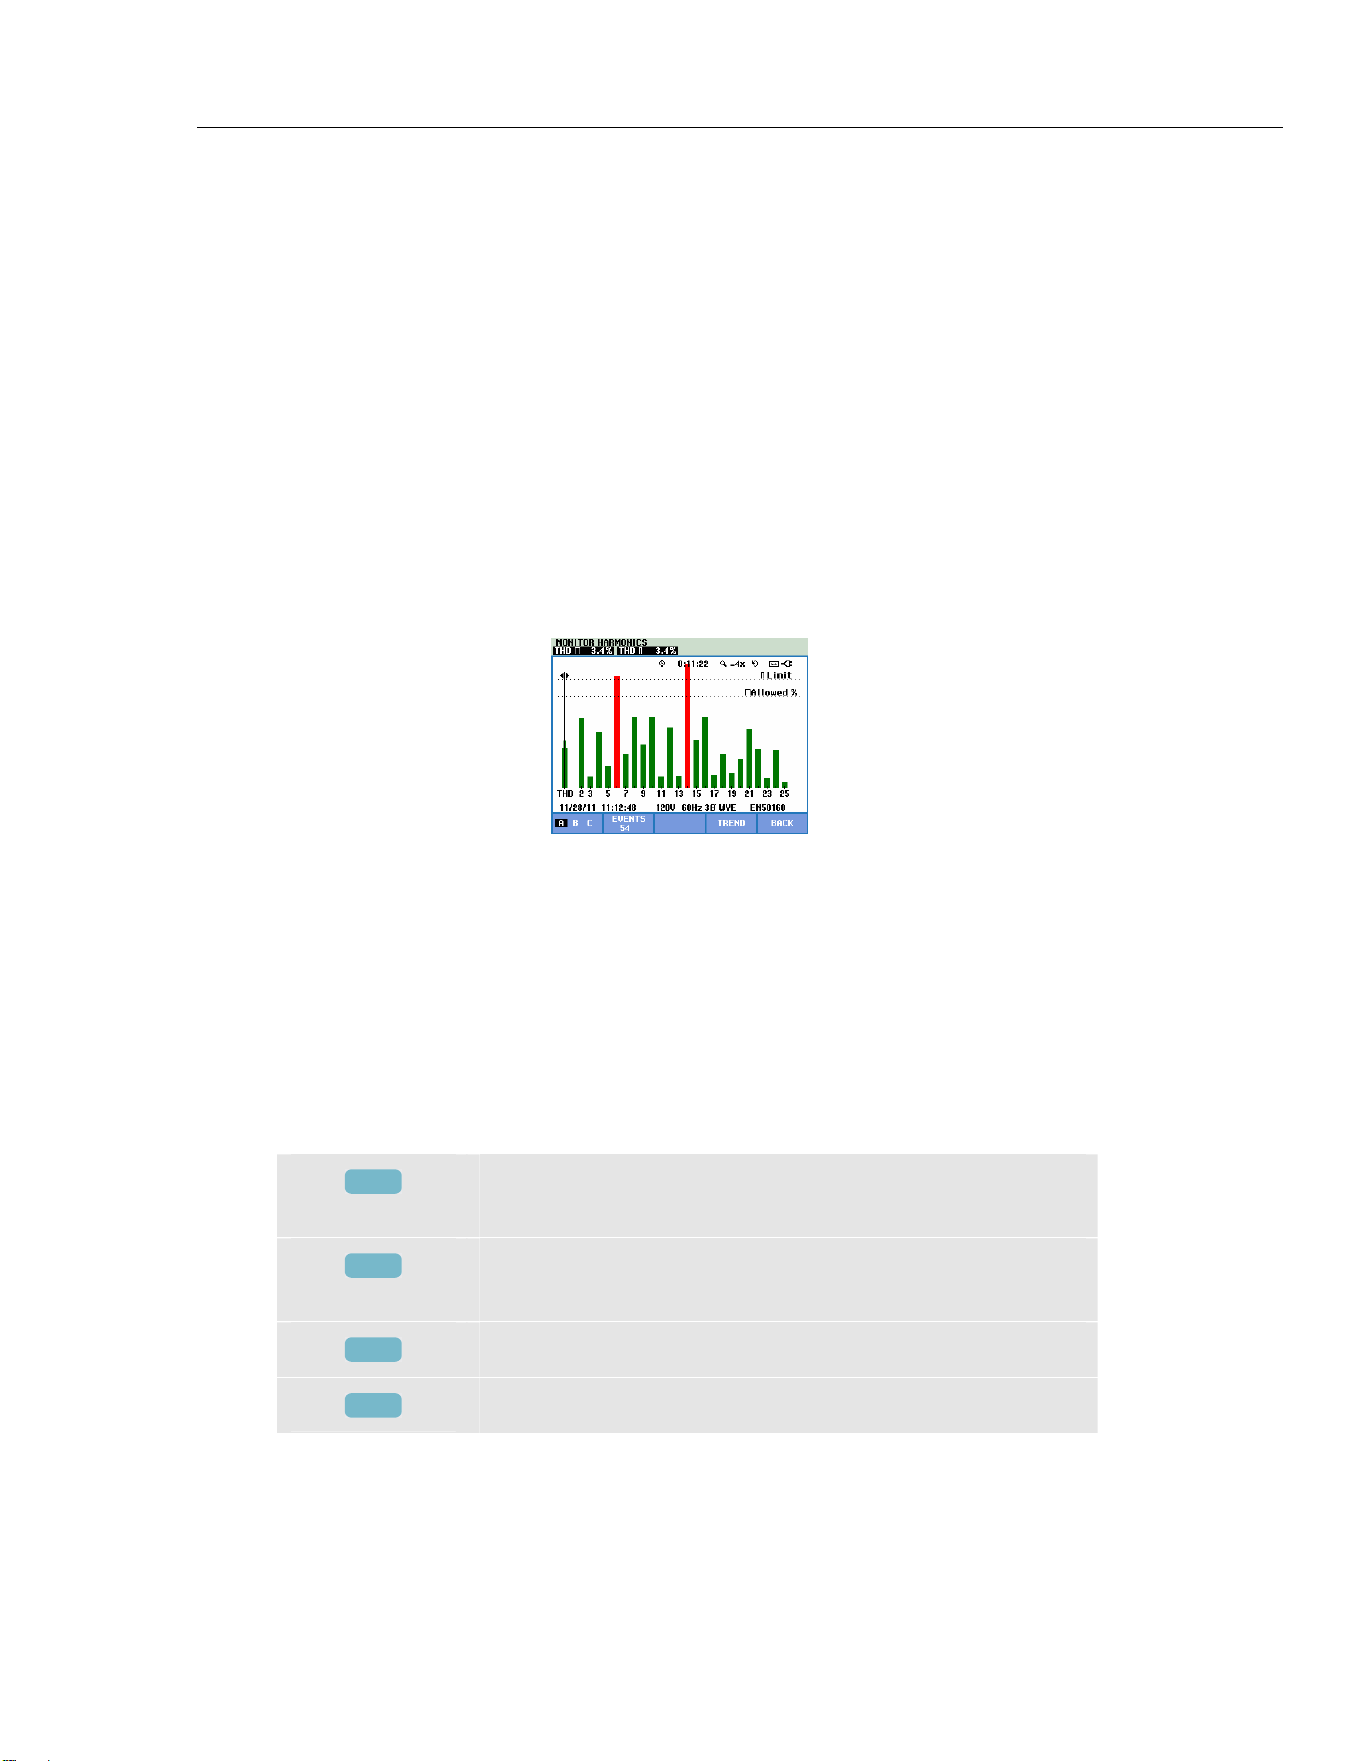
Bar Graph Screen
Figure 16-4. Bar Graph Screen
The main system monitor display shows the strongest harmonic for each of the three
phases. Function key F2 brings up a screen with Bar Graphs showing the percentage of
time each phase spent within limits for 25 harmonics and Total Harmonic Distortion
(THD). Each Bar Graph has a wide base (representing an adjustable limit of e.g. 95 %)
and a narrow top (representing the limit of 100 %). A Bar Graph changes from green to
red if the limits for that harmonic are violated.
Cursor: with the left/right arrow keys you can position the Cursor on a particular Bar
Graph and measuring data belonging to that bar is shown in the screen header.
Available function keys:
F1
Selection of Bar Graphs belonging to phase A (L1), B (L2),
or C (L3).
F2
Access to events table. The number of events that occurred
is shown.
F4
Access to Trend screen.
F5
Return to main menu.
1.888.610.7664 sales@GlobalTestSupply.com
Fluke-Direct.com
Loading ...
Loading ...
Loading ...