Loading ...
Loading ...
Loading ...
NORMA 4000/5000
Operators Manual
8-16
Numerical Display
For details regarding the numerical display of measured values, refer to the section,
“Measure Voltage, Current and Power,” in Chapter 8.
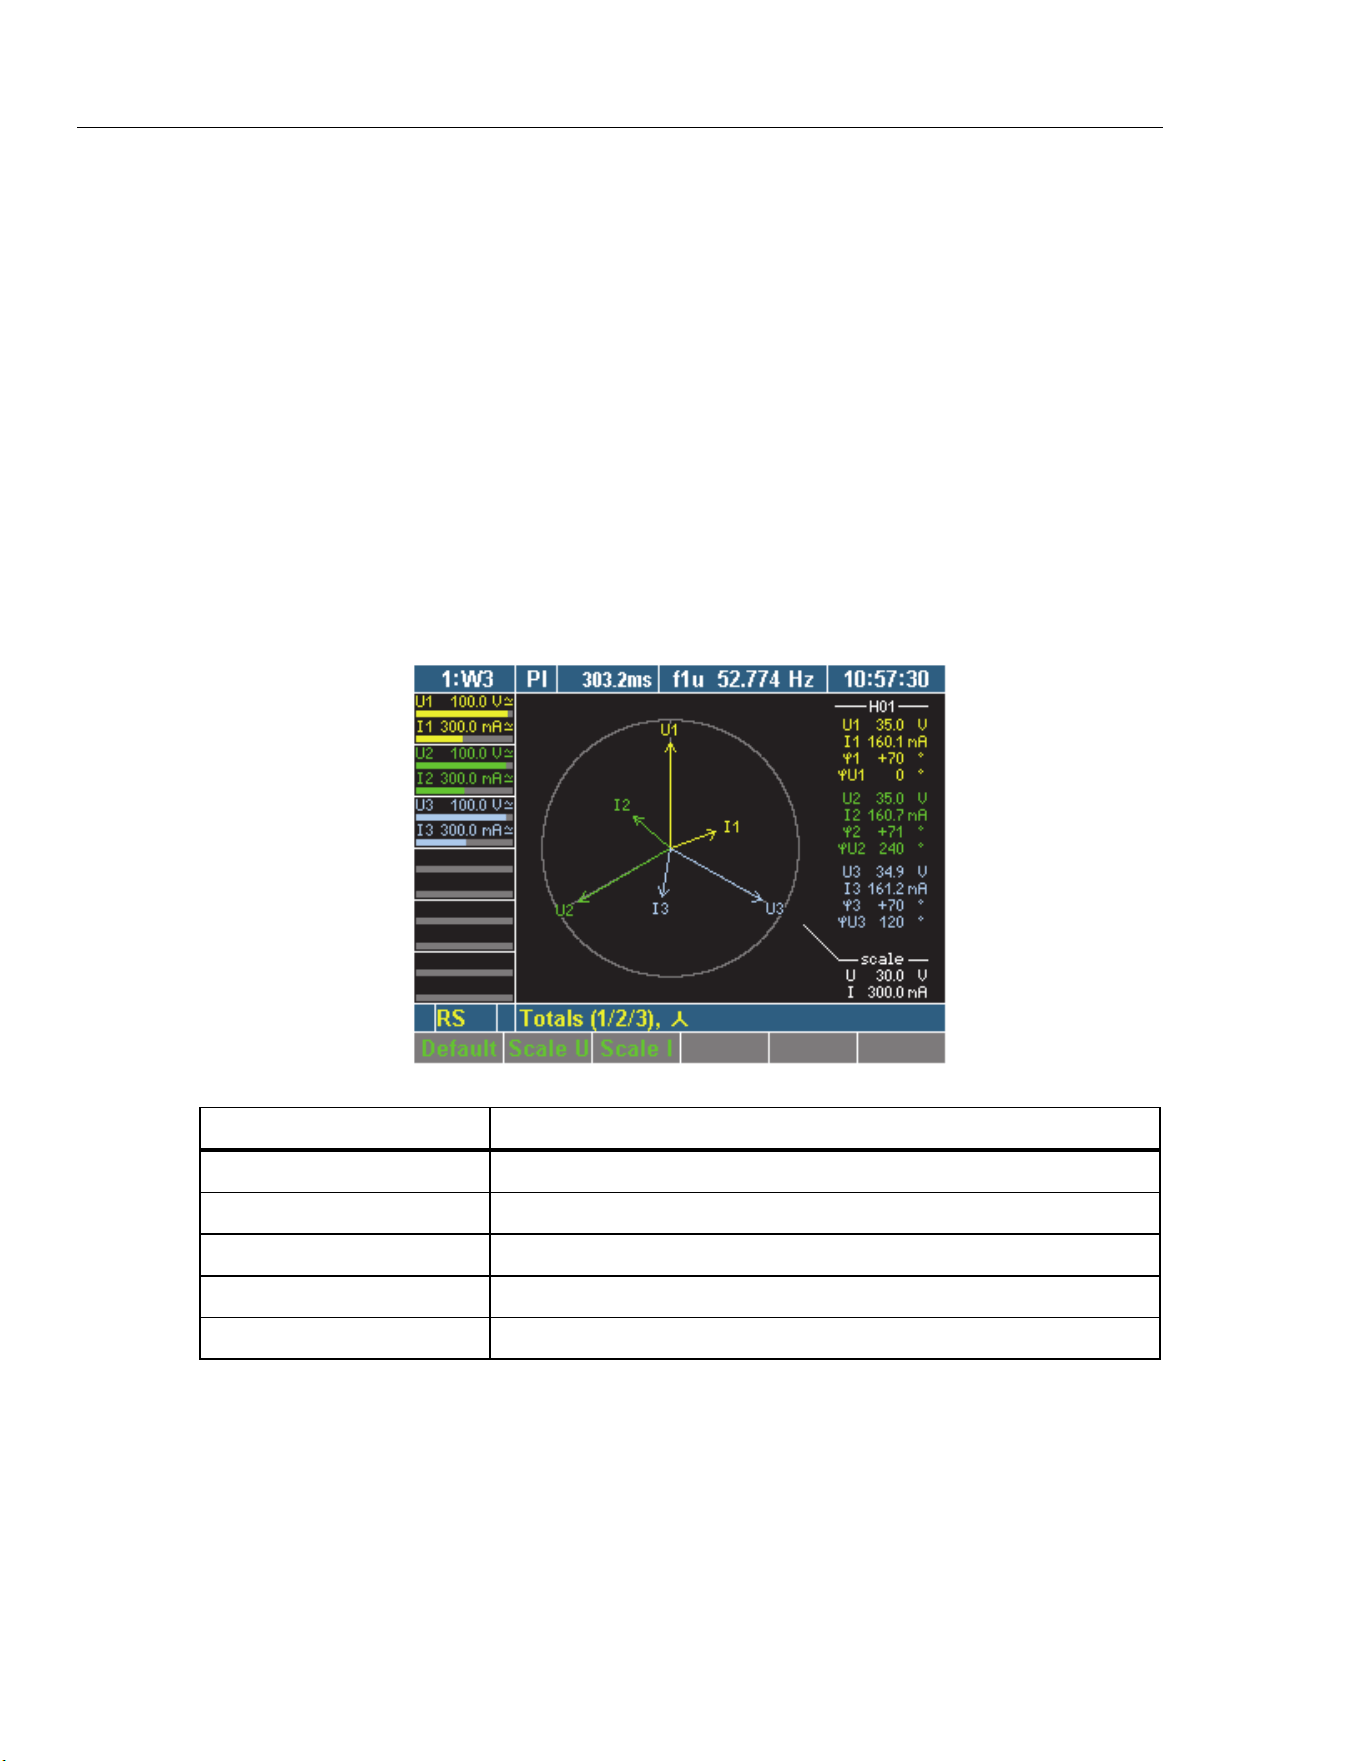
Vector Graphs
Up to six signals of the H01 fundamentals can be viewed as vector graphs.
The vector graphs show voltage and current with amplitude and phase shift, and allow for
the fast assessment of signals and detection of errors in the connections.
View Vector Graphs
1. Press measuring keys Σ or 1...n and WAV to call up the desired values, that is,
values measured at WAV power.
2. Press measuring key Vector graphs.
The measured values are shown in the form of vector graphs.
esn046.gif
Display Description
φ1 ... φ3 Phase angle between U and I
φU1 ... reference point (always = 0)
φU2 Angle between U2 and U1
φU3 Angle between U3 and U1
scale Range (reference value for the diameter of the outer circle)
3. To view a different channel or different measured values in vector graph form,
press measuring keys Σ or 1...n and WAV.
Adjust Scale
The scale of the vector in the vector diagram is adjustable.
1. To automatically optimize the scale of the graph, press function key Default.
The scale is set to the measurement range.
1.888.610.7664 sales@GlobalTestSupply.com
Fluke-Direct.com
Loading ...
Loading ...
Loading ...