DAC-501
weiss.ch
USER MANUAL
DAC-502

Weiss Enginering Ltd. DAC501/DAC502
Contents
1 The DAC501/DAC502 Overview 1
2 The three interfaces 2
2.1 The LCD . . . . . . . . . . . . . . . . . . . . . . . . . . . . . . . . . . . . . . . . . . . . . . . 2
2.2 The IR Remote Control . . . . . . . . . . . . . . . . . . . . . . . . . . . . . . . . . . . . . . . 3
2.3 The Web Interface . . . . . . . . . . . . . . . . . . . . . . . . . . . . . . . . . . . . . . . . . . 3
2.3.1 Basic Introduction . . . . . . . . . . . . . . . . . . . . . . . . . . . . . . . . . . . . . . 3
2.3.2 Active Output . . . . . . . . . . . . . . . . . . . . . . . . . . . . . . . . . . . . . . . . . 5
2.3.3 De-Essing . . . . . . . . . . . . . . . . . . . . . . . . . . . . . . . . . . . . . . . . . . . 5
2.3.4 The Vinyl Emulator . . . . . . . . . . . . . . . . . . . . . . . . . . . . . . . . . . . . . . 6
2.3.5 The Equalizer (EQ) . . . . . . . . . . . . . . . . . . . . . . . . . . . . . . . . . . . . . 7
2.3.6 The Room Equalizer . . . . . . . . . . . . . . . . . . . . . . . . . . . . . . . . . . . . . 8
2.3.7 Headphone EQ . . . . . . . . . . . . . . . . . . . . . . . . . . . . . . . . . . . . . . . . 12
2.3.8 Loudness EQ . . . . . . . . . . . . . . . . . . . . . . . . . . . . . . . . . . . . . . . . . 12
2.3.9 Dynamics Adaption . . . . . . . . . . . . . . . . . . . . . . . . . . . . . . . . . . . . . 13
2.3.10 The Crosstalk Cancellation (XTC) . . . . . . . . . . . . . . . . . . . . . . . . . . . . . 14
2.3.11 Crossfeed Headphone . . . . . . . . . . . . . . . . . . . . . . . . . . . . . . . . . . . . 14
2.3.12 Snapshot Storage . . . . . . . . . . . . . . . . . . . . . . . . . . . . . . . . . . . . . . 16
2.3.13 Global Presets . . . . . . . . . . . . . . . . . . . . . . . . . . . . . . . . . . . . . . . . 17
2.3.14 Firmware Update/ Download . . . . . . . . . . . . . . . . . . . . . . . . . . . . . . . . 18
2.3.15 M/S Control . . . . . . . . . . . . . . . . . . . . . . . . . . . . . . . . . . . . . . . . . . 18
3 Technical Specification 19
4 Signal Processing Algorithms 24
4.1 The Weiss parametric Equalizer (EQ) . . . . . . . . . . . . . . . . . . . . . . . . . . . . . . . 24
4.2 The Weiss Room Equalizer . . . . . . . . . . . . . . . . . . . . . . . . . . . . . . . . . . . . . 26
4.3 The Weiss Crosstalk Cancellation (XTC) . . . . . . . . . . . . . . . . . . . . . . . . . . . . . . 26
4.4 The Weiss Vinyl Emulator . . . . . . . . . . . . . . . . . . . . . . . . . . . . . . . . . . . . . . 27
4.5 Digital level control and Dithering . . . . . . . . . . . . . . . . . . . . . . . . . . . . . . . . . . 29
4.6 The Weiss Dynamics Adaption . . . . . . . . . . . . . . . . . . . . . . . . . . . . . . . . . . . 30
4.7 The Weiss De-Esser . . . . . . . . . . . . . . . . . . . . . . . . . . . . . . . . . . . . . . . . . 32
4.8 The Weiss Crossfeed Headphone Algorithm . . . . . . . . . . . . . . . . . . . . . . . . . . . . 35
4.9 The Weiss Headphone Equalizer . . . . . . . . . . . . . . . . . . . . . . . . . . . . . . . . . . 36
4.10 The Schwede Loudness EQ . . . . . . . . . . . . . . . . . . . . . . . . . . . . . . . . . . . . . 37
4.11 The Weiss M/S Control . . . . . . . . . . . . . . . . . . . . . . . . . . . . . . . . . . . . . . . 37
5 Contact Information 38
User Manual and i White Papers
Weiss Enginering Ltd. DAC501/DAC502
1 The DAC501/DAC502 Overview
Congratulations on purchasing
the DAC501/DAC502 D/A converter!
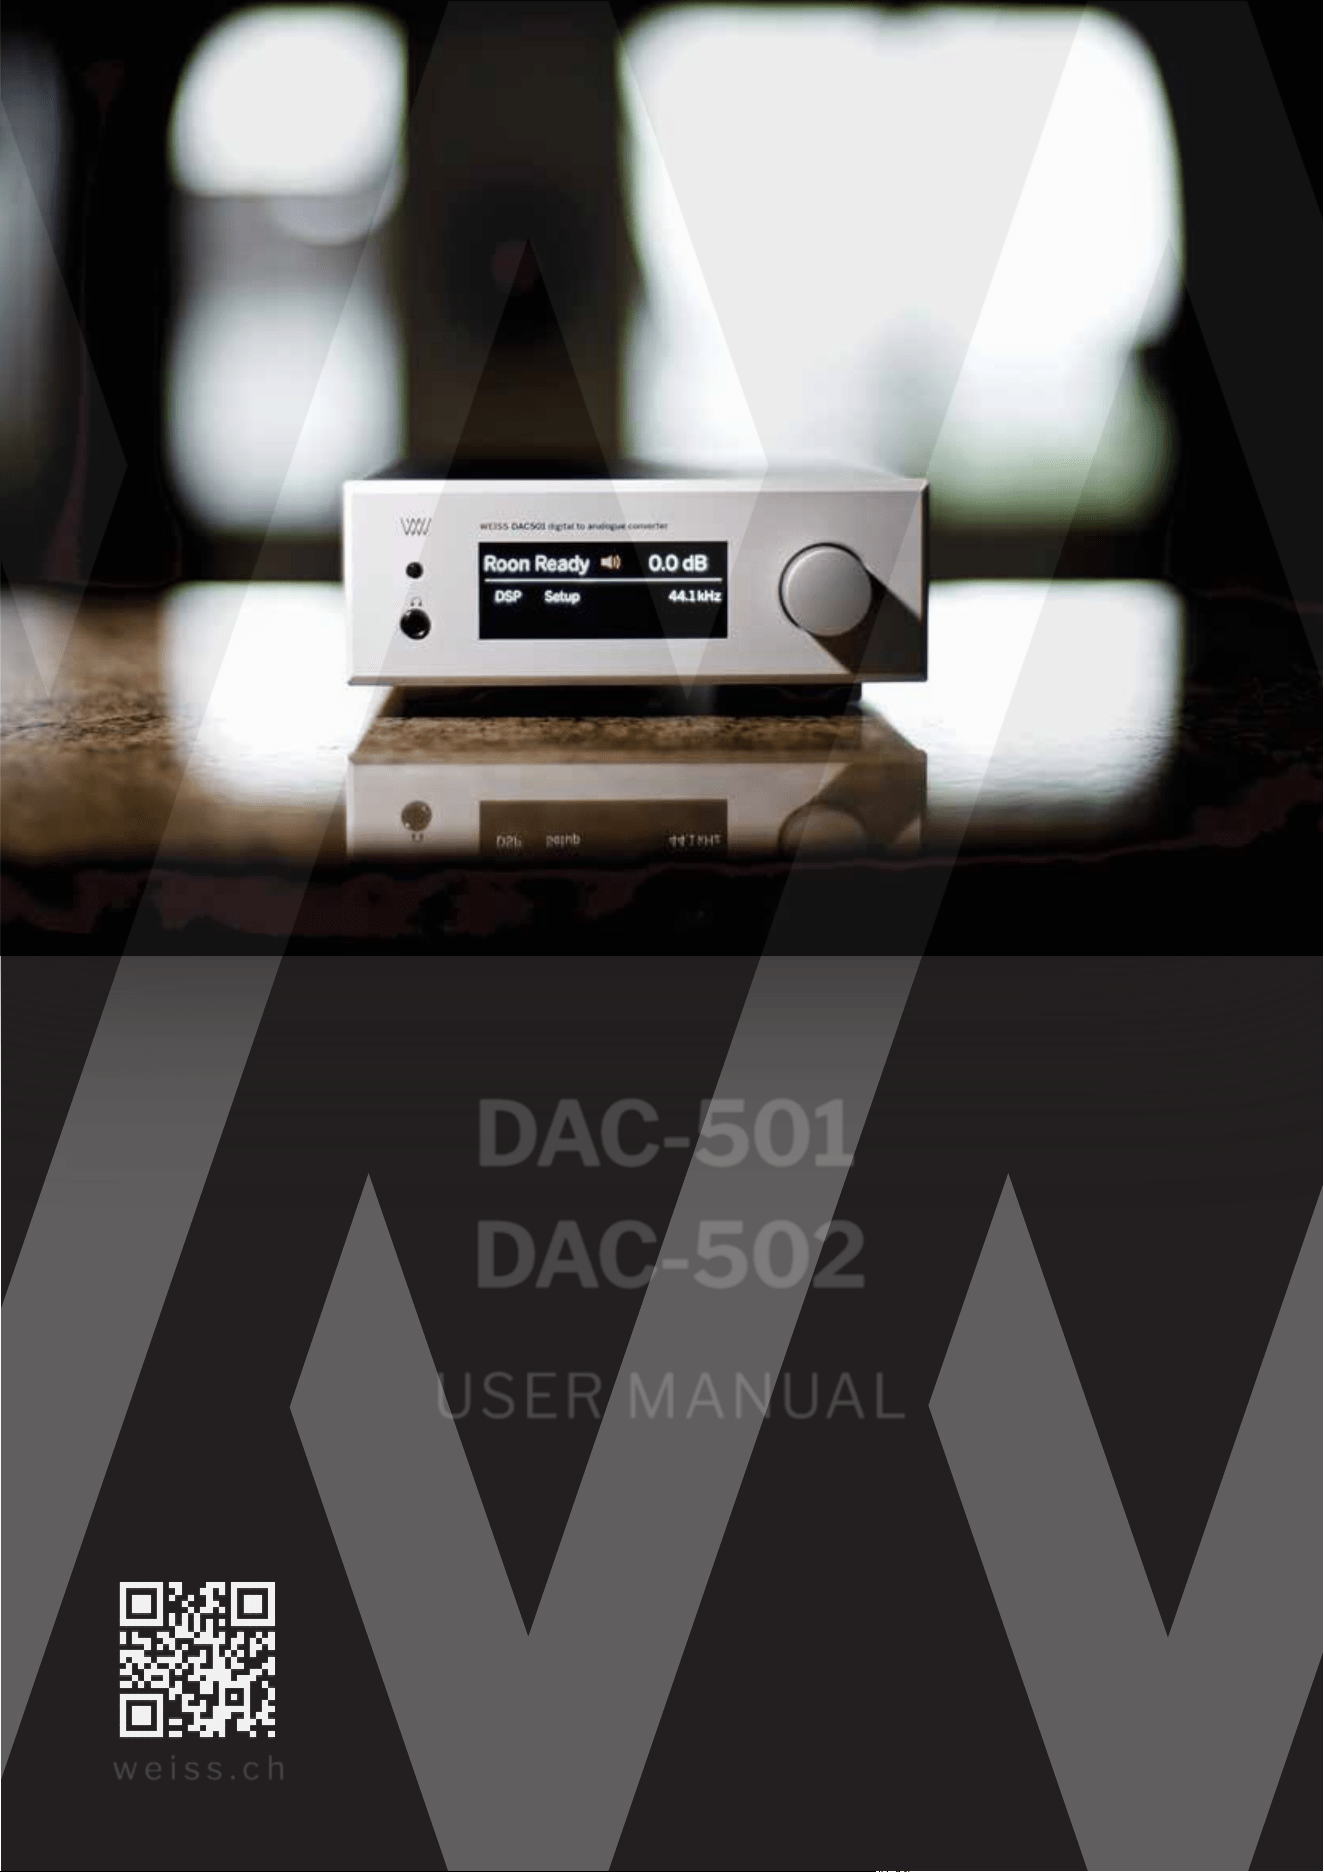
Figure 1: The DAC502
The DAC501/DAC502 are our new state of the art D/A Converters with an unprecedented level of sophisti-
cation and versatility.
With the DAC50x we are creating a new paradigm for what used to be a black box device. A typical D/A
Converter is a ”set and forget” device. Not so with the DAC50x. It adds a number of interesting signal
processing features and sports a variety of digital inputs. Balanced, unbalanced and headphone outputs
are provided.
Weiss Engineering has a 30 year history in D/A Converter design. In that time span we have learned a thing
or two about converter design. The DAC50x is the essence of our experiences.
Figure 2: The DAC501
The DAC502 (fig. 1) uses a larger frame but else sports the same features as the DAC501 (fig. 2). Except
for an an additional 4 pin headphone socket at the back of the unit. Henceforth the term DAC50x refers to
both models.
The basic operation of the DAC50x is outlined in the documentation Quick Start Guide - the first steps with
your DAC50x .
For all the powerful features and concepts employed in the DAC50x refer to the detailed overview and
White Papers mentioned in the following document. This manual will be updated on a regular basis as new
firmware features become available.
User Manual and 1 White Papers

Weiss Enginering Ltd. DAC501/DAC502
2 The three interfaces
We offer you three possibilities to control the DAC50x - so you can adjust the use and interaction of the
DAC50x to your own special needs. In the following these three user interfaces are explained in more
detail:
• The LCD touch screen and rotary knob on the faceplate
• The IR remote control
• The web interface built into the DAC50x
2.1 The LCD
On the faceplate of the DAC50x you can use the LCD which is a touch screen and the rotary knob to operate
with the DAC50x. Tap on the LCD at the:
•
Upper left: input selection. The UPnP selection selects the Ethernet interface as the input.
•
Upper middle: output select. Only the selected output is active, i.e. XLR/RCA or JACK. The output
which is not selected will be muted.
The displayed red icon also shows the output’s selected Output Termination.
•
Upper right: volume. If red then the output is muted. By tapping the output is toggled between muted
and unmuted. The volume can be changed with the rotary knob.
If the value shown is yellow then the absolute polarity of the output is inverted (see below). All param-
eters can be different between XLR/RCA output and JACK output.
•
Lower left: DSP settings. This opens a menu which allows to select one of the DSP algorithms to be
changed. (Note, the rotary knob allows to scroll through the menus).
The algorithms can be operated via the touch screen, but we recommend to use the web interface (sec-
tion 2.3) for simpler operation of the DSP features. All parameters can be different between XLR/RCA
output and JACK output. Thus select the appropriate output first (XLR/RCA or JACK) and then adjust
the DSP parameters.
•
Lower middle: Setup menu. Allows to set the left/right balance, the absolute output polarity, the basic
output level in four coarse steps (analog domain) and the LCD back light brightness (the LCD Dim
setting is activated after some delay if no parameter is changed any more).
(Note, the rotary knob allows to scroll through the menus). The Balance, Polarity and Output Level
parameters are stored separately for XLR/RCA output and JACK output and thus may vary. At the
bottom of the setup page a few technical specifications are listed:
– The hostname which looks similar to this: dac50x-0010, meaning that the DAC50x can be ac-
cessed via an internet browser as described in the quick start guide.
– The IP address of the unit in your network.
– The MAC address, which is a specific address of your unit.
•
Lower right: Sampling rate of the input signal.
•
Bottom: Displays the currently played track when in Roon Ready or UPnP input mode (does not
necessarily work with WAV or AIFF files).
User Manual and 2 White Papers
Weiss Enginering Ltd. DAC501/DAC502
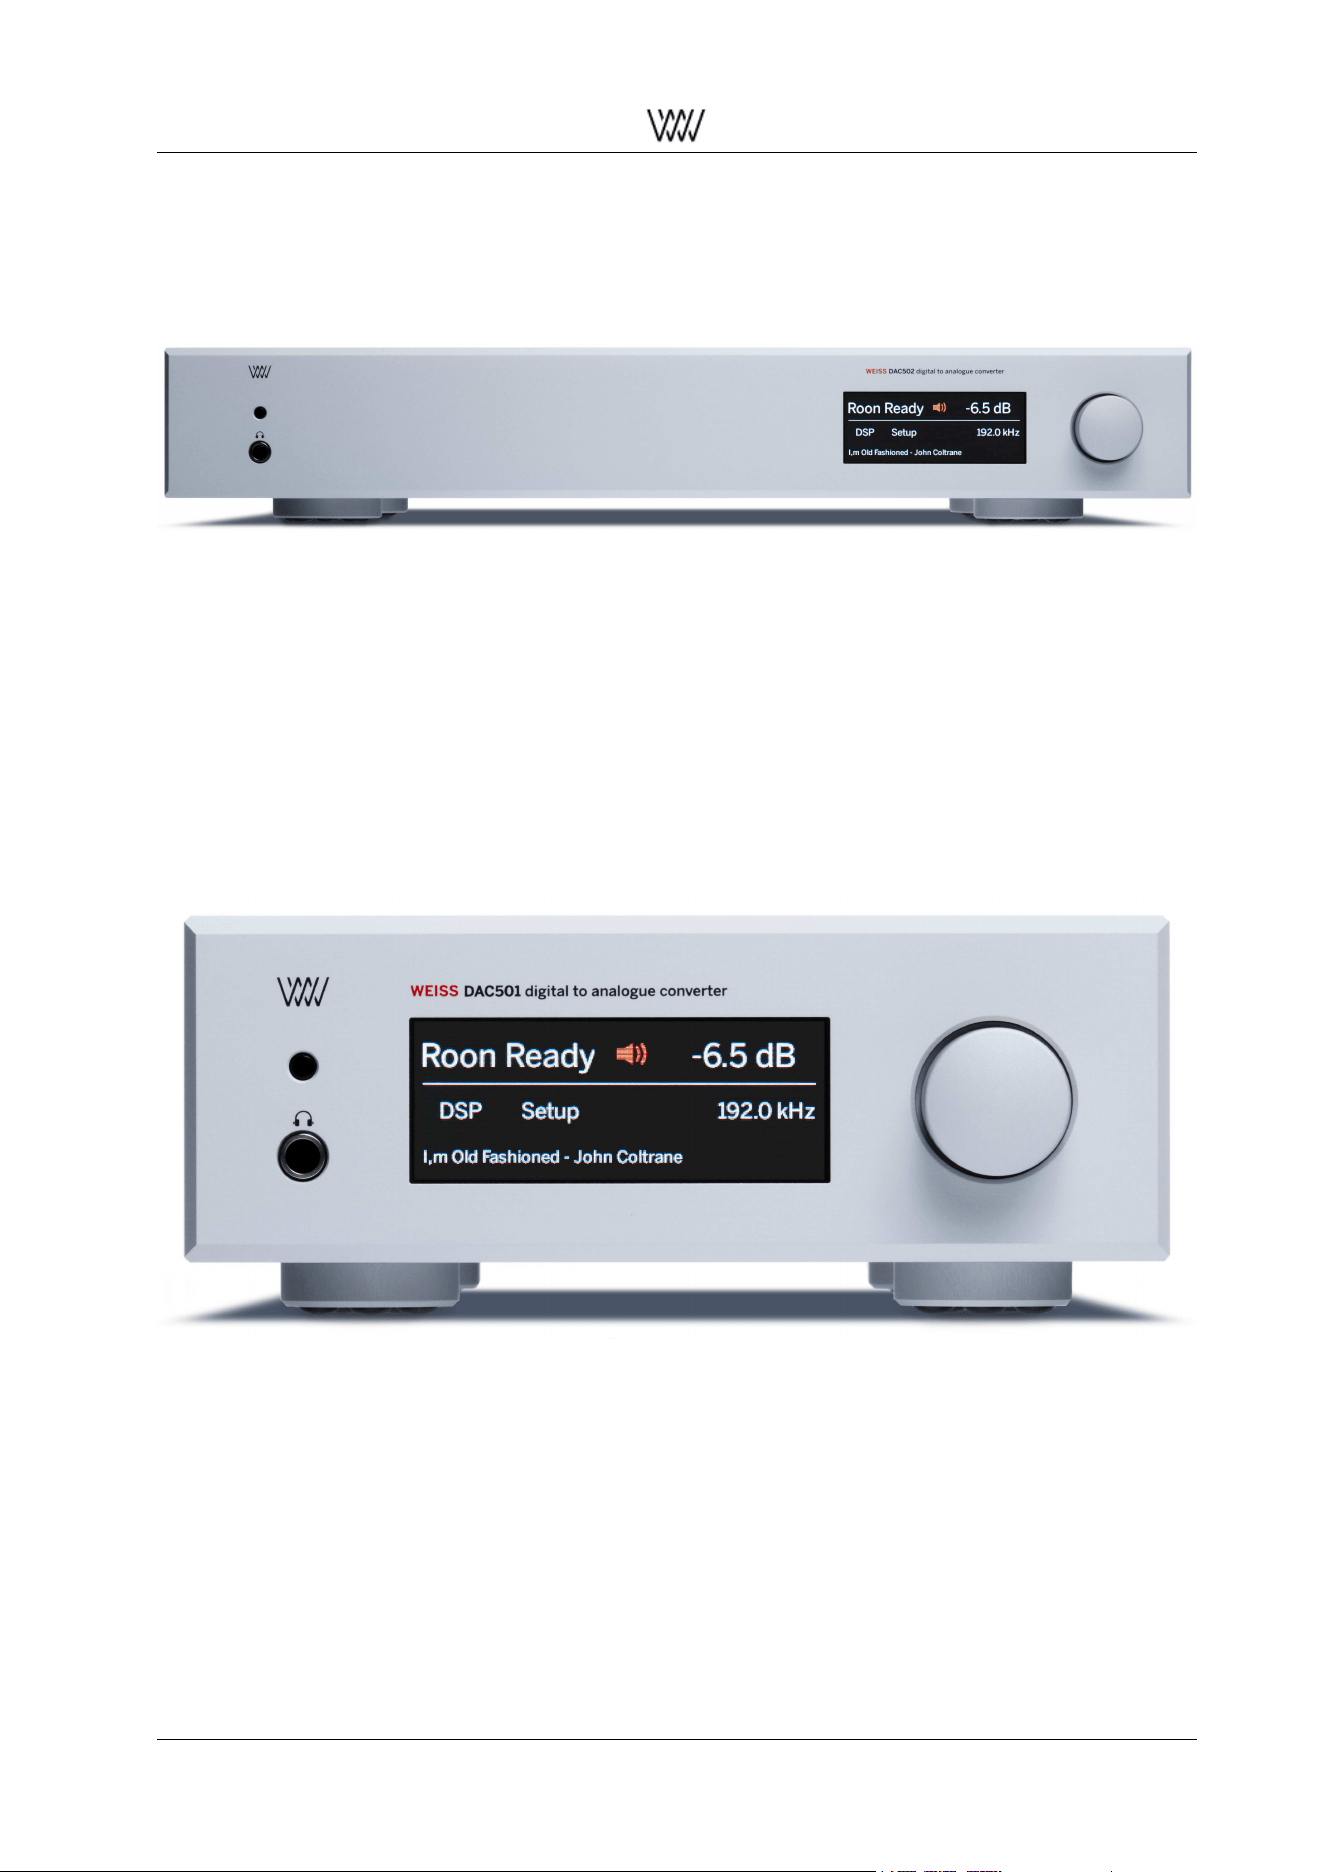
2.2 The IR Remote Control
Most of the keys on the IR remote control are self-explanatory. Here
are some additional remarks:
IR remote control buttons:
power on/off select XLR/RCA out UPnP input
select JACK out USB input
volume up XLR input
volume down RCA input
mute polarity TOS (optical) input
DSP Presets 1 2 3
...
• The two top/middle keys select the active Output. Long press (>
2s) of either keys toggles the active Output’s Termination.
• The polarity key changes the absolute polarity of the output sig-
nal. If this is engaged (i.e. signal is inverted), the level figure on
the LCD display turns yellow.
• The mute key when engaged mutes the output signal completely
and the level figure on the LCD turns red.
• The DSP Presets keys select one of the Presets stored in the
DSP. More information on the DSP Presets is given in the web
interface description below.
Figure 3: IR remote control
2.3 The Web Interface
As last but not least possibility to operate with your DAC50x we offer you the Web Interface. This Interface
provides you a lot of flexibility and freedom when using the DAC50x. For example you are free to access
the web interface via your tablet or your computer.
The web interface will be updated according to new or changed DSP algorithms, which we will supply over
time. In order to access this interface your DAC50x must to be connected to your local area network where
your web-browser is also connected to.
The following sections explain the functionality of the Web Interface.
2.3.1 Basic Introduction
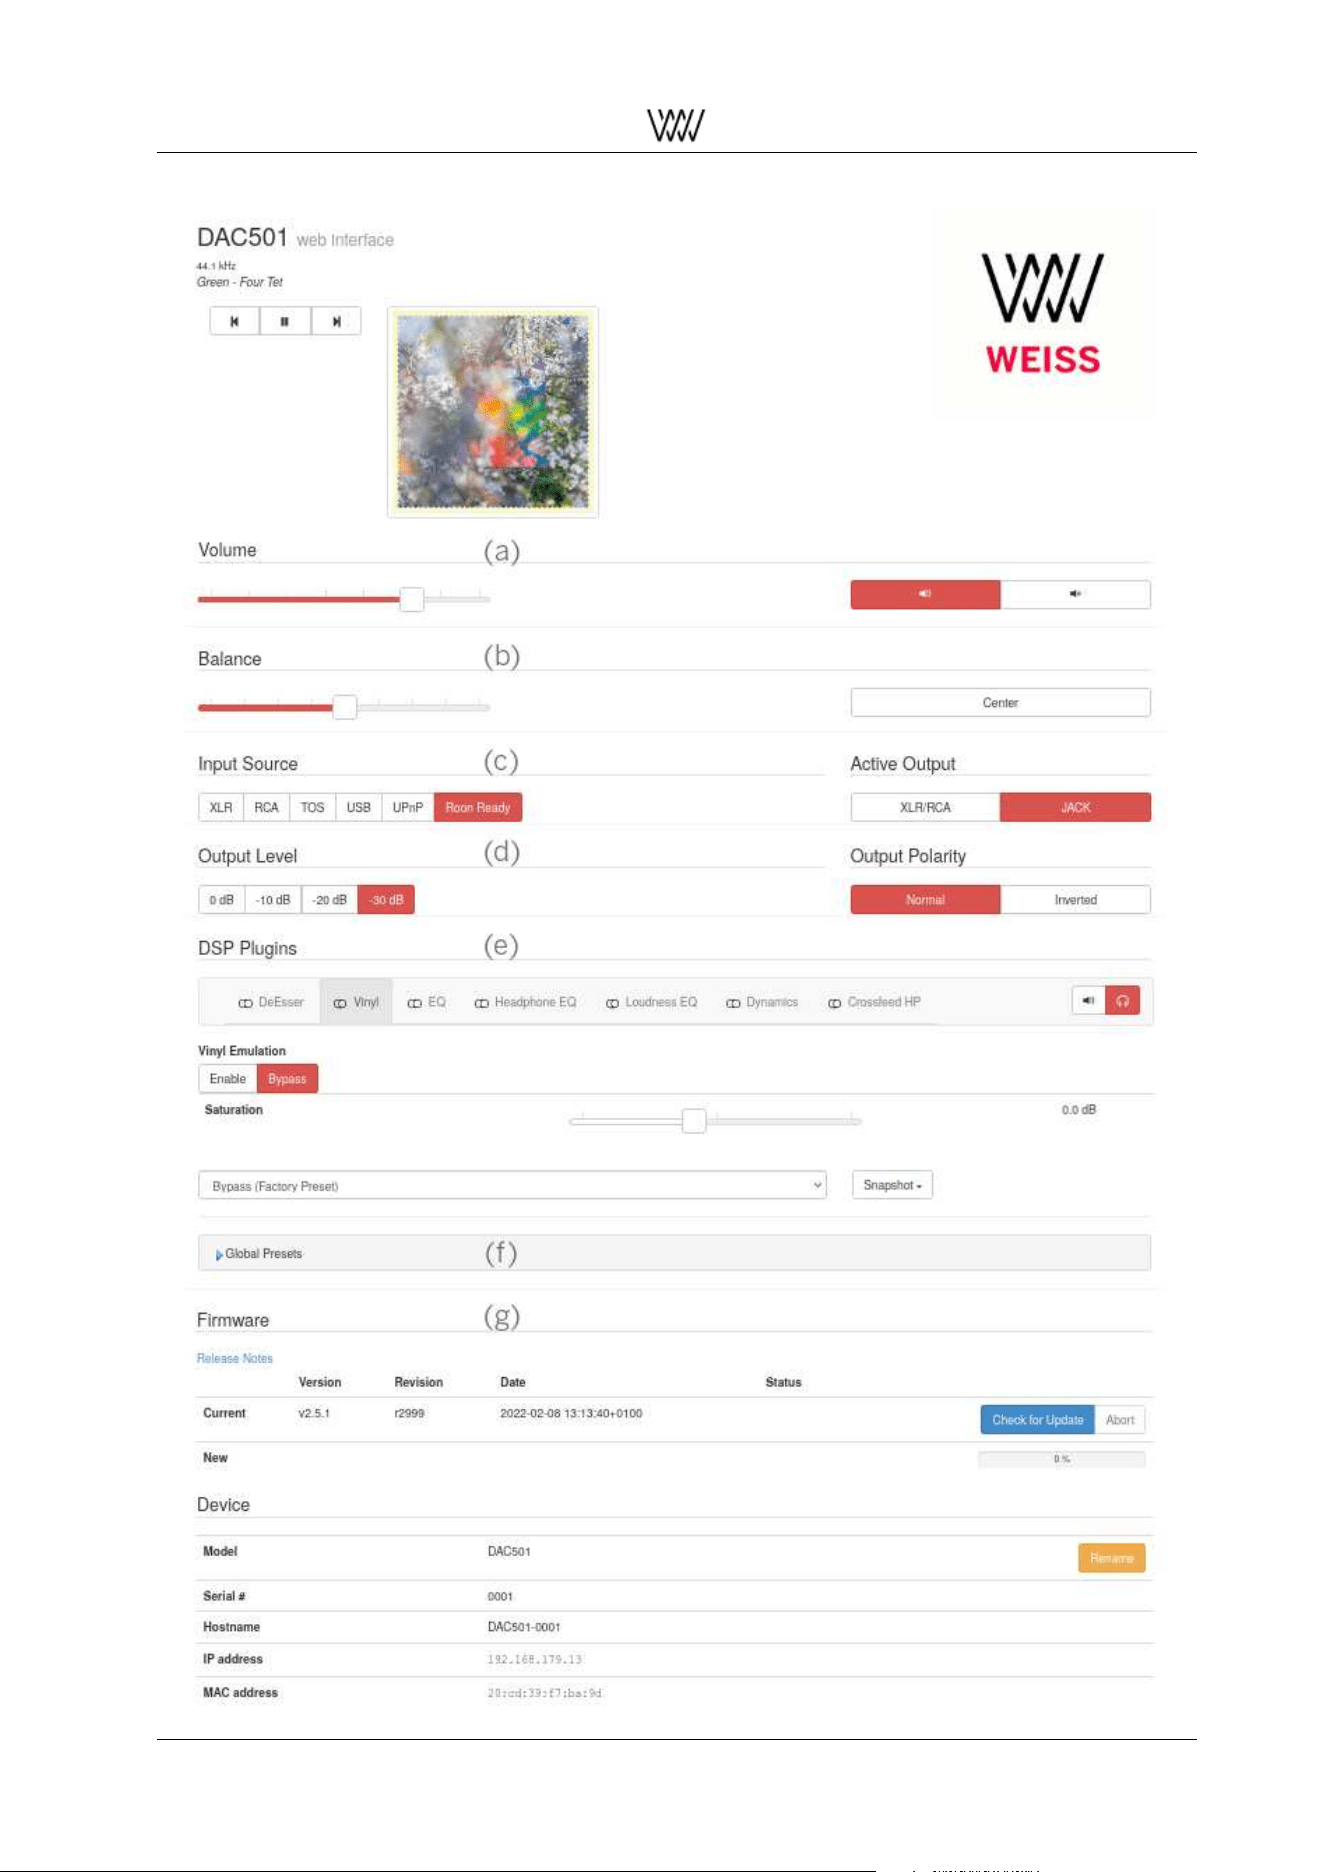
The basic functions and sections of the web interface are marked in fig. 4:
a : volume control, muting
b : L/R balance
c : input selection
d : coarse output level and polarity tied to the output type
e : DSP plugin selection
f : Snapshot and Preset storage
g : Firmware updating
User Manual and 3 White Papers
Weiss Enginering Ltd. DAC501/DAC502
Figure 4: Web interface overview
User Manual and 4 White Papers
Weiss Enginering Ltd. DAC501/DAC502
2.3.2 Active Output
Select either XLR/RCA or JACK with the Active Output switch (d). Furthermore the Output Termination
switch (right hand on DSP plugin bar (e)) allows you to specify for each of these two outputs whether it is
associated with a speaker or headphone setup.
Most DSP plugins are available on either Output Termination setting. Certain plugins are exclusive to the
respective termination setting and are shown/disabled on the DSP plugin bar depending on the Output Ter-
mination selection.
The Crossfeed HP and Headphone EQ algorithms are exclusively available for headphone termination set-
tings. Room EQ and XTC are only provided for speaker termination settings.
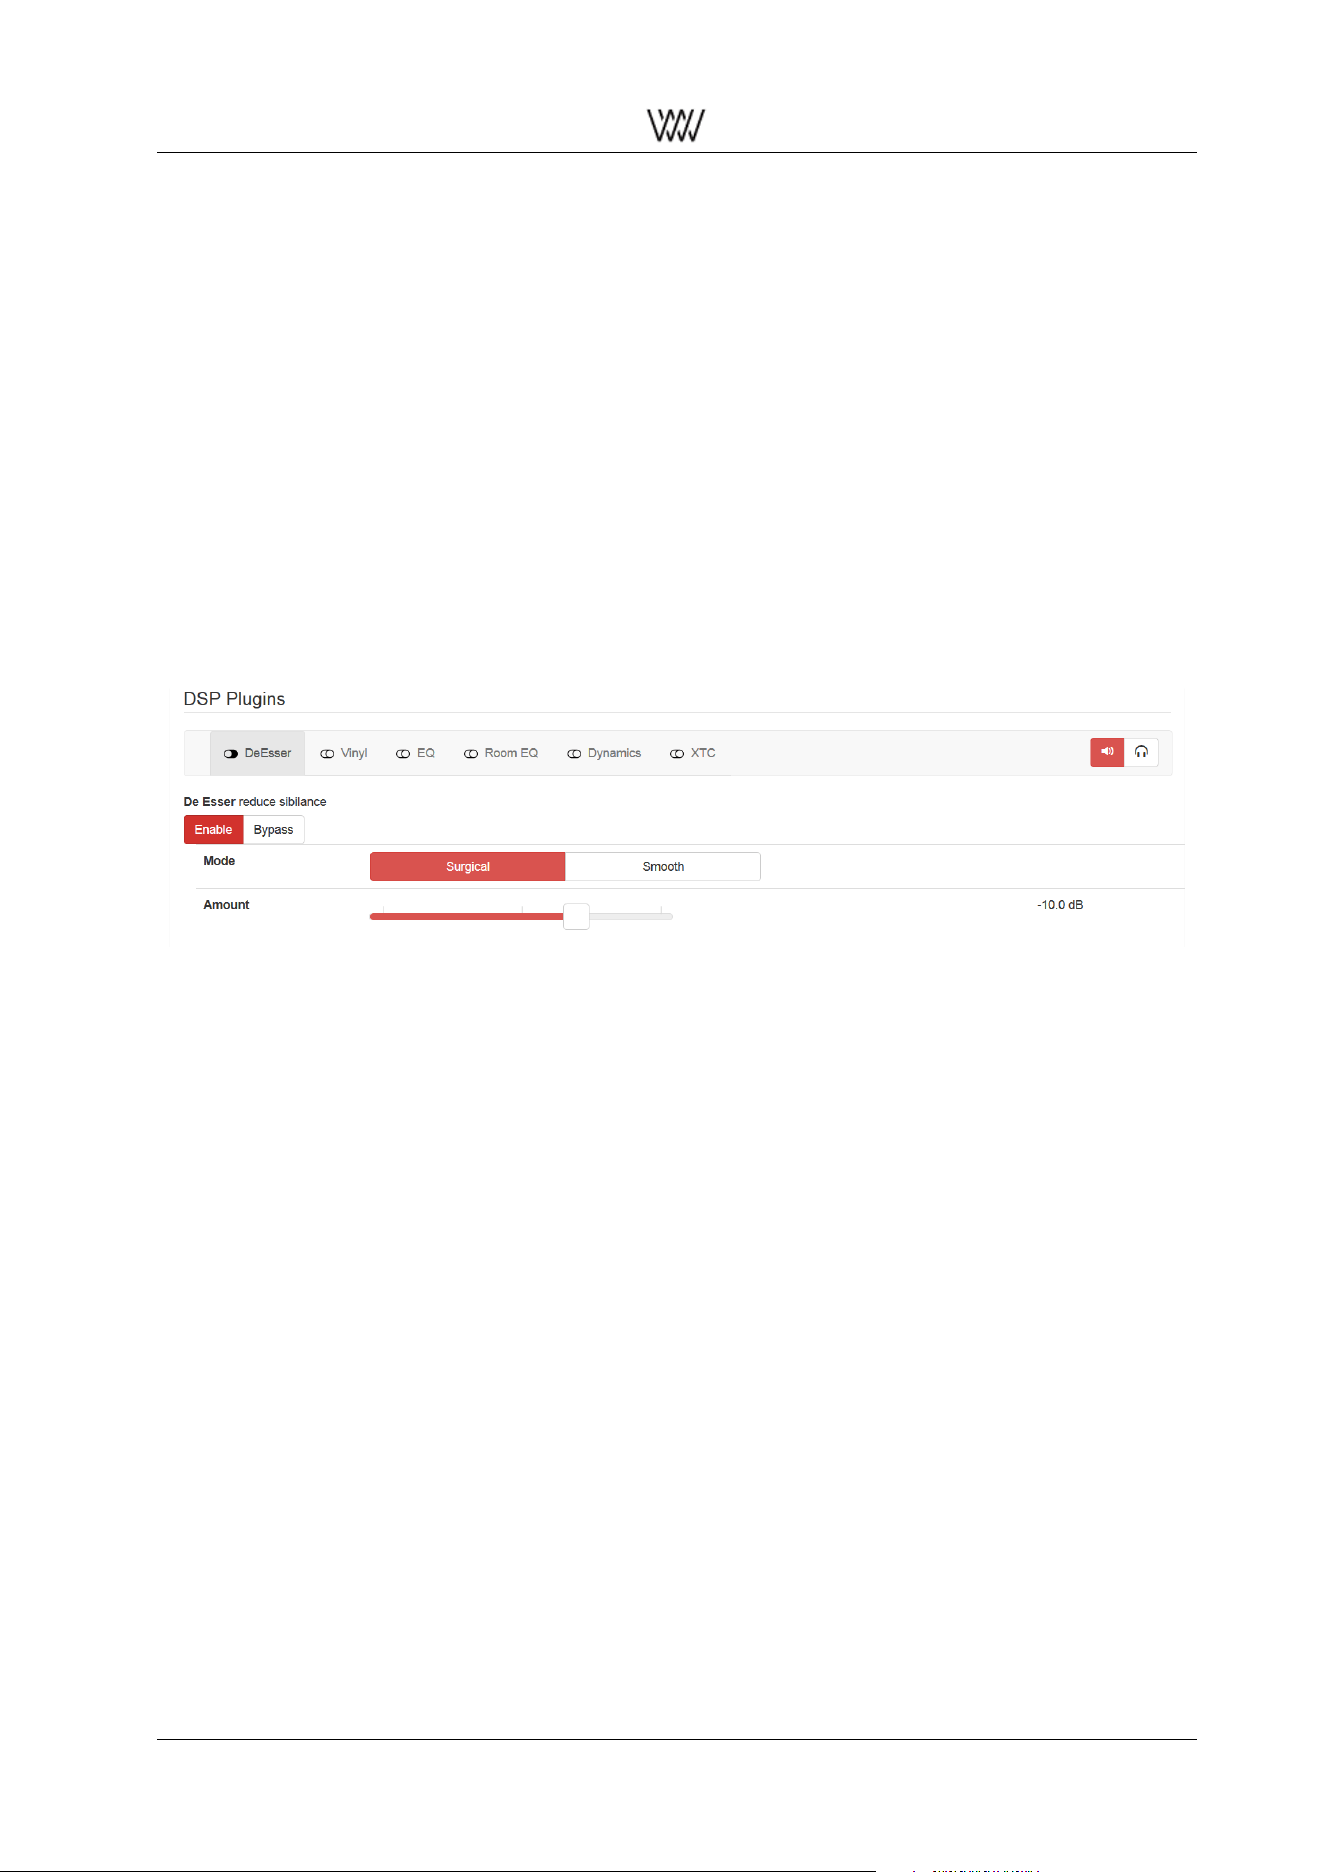
2.3.3 De-Essing
The De-Esser plugin reduces critical sounds of sharpness that can occur in the high frequency content of
music. So this plugin can be beneficial if your favourite recording contains some unpleasant harsh sounds.
But sharpness can also arise during mastering or as a results of inapt constellations in the playback room.
The De-Esser plugin offers you two setting possibilities - the Amount and the Mode of the De-Esser. The
Figure 5: De-Esser plugin
two modes behave different when critical sharpness is detected and can be selected via tapping on the
desired mode. The red highlighting displays which mode is active. For selectively getting rid of unpleasant
sharpness the mode Surgical is preferential. If an overall mellow sound of the high frequency content is
desired the mode Smooth is recommendable. The disparity of the two modes and how to use them is
described in detail in section 4.7. By changing the Amount slider you can change the impact of De-Esser
effect. When the slider is on position 0dB the influence of the De-Esser is maximal.
User Manual and 5 White Papers

Weiss Enginering Ltd. DAC501/DAC502
2.3.4 The Vinyl Emulator
By tapping or touching on the desired plugin at the light gray tab its special functionality and user parameters
will be displayed below the gray tab.
Figure 6: Vinyl plugin
For marking which plugin is displayed the selected plugin will be highlighted in a darker gray. In this screen
shot the Vinyl plugin is selected. To switch a plugin on/off just tap on the enable/bypass tab. The selection
is highlighted in red.
By moving the slider you can adjust the user parameter Saturation. The Saturation parameter adjusts the
amount of the vinyl emulation effect. It has to be adjusted depending on the loudness of the recording and
depending on the amount of effect which is expected by the listener.
Note that for too high Saturation settings the audio quality can get poor. Start with e.g. the 0dB setting. The
grade of the Saturation is displayed at the right in dB.
User Manual and 6 White Papers
Weiss Enginering Ltd. DAC501/DAC502
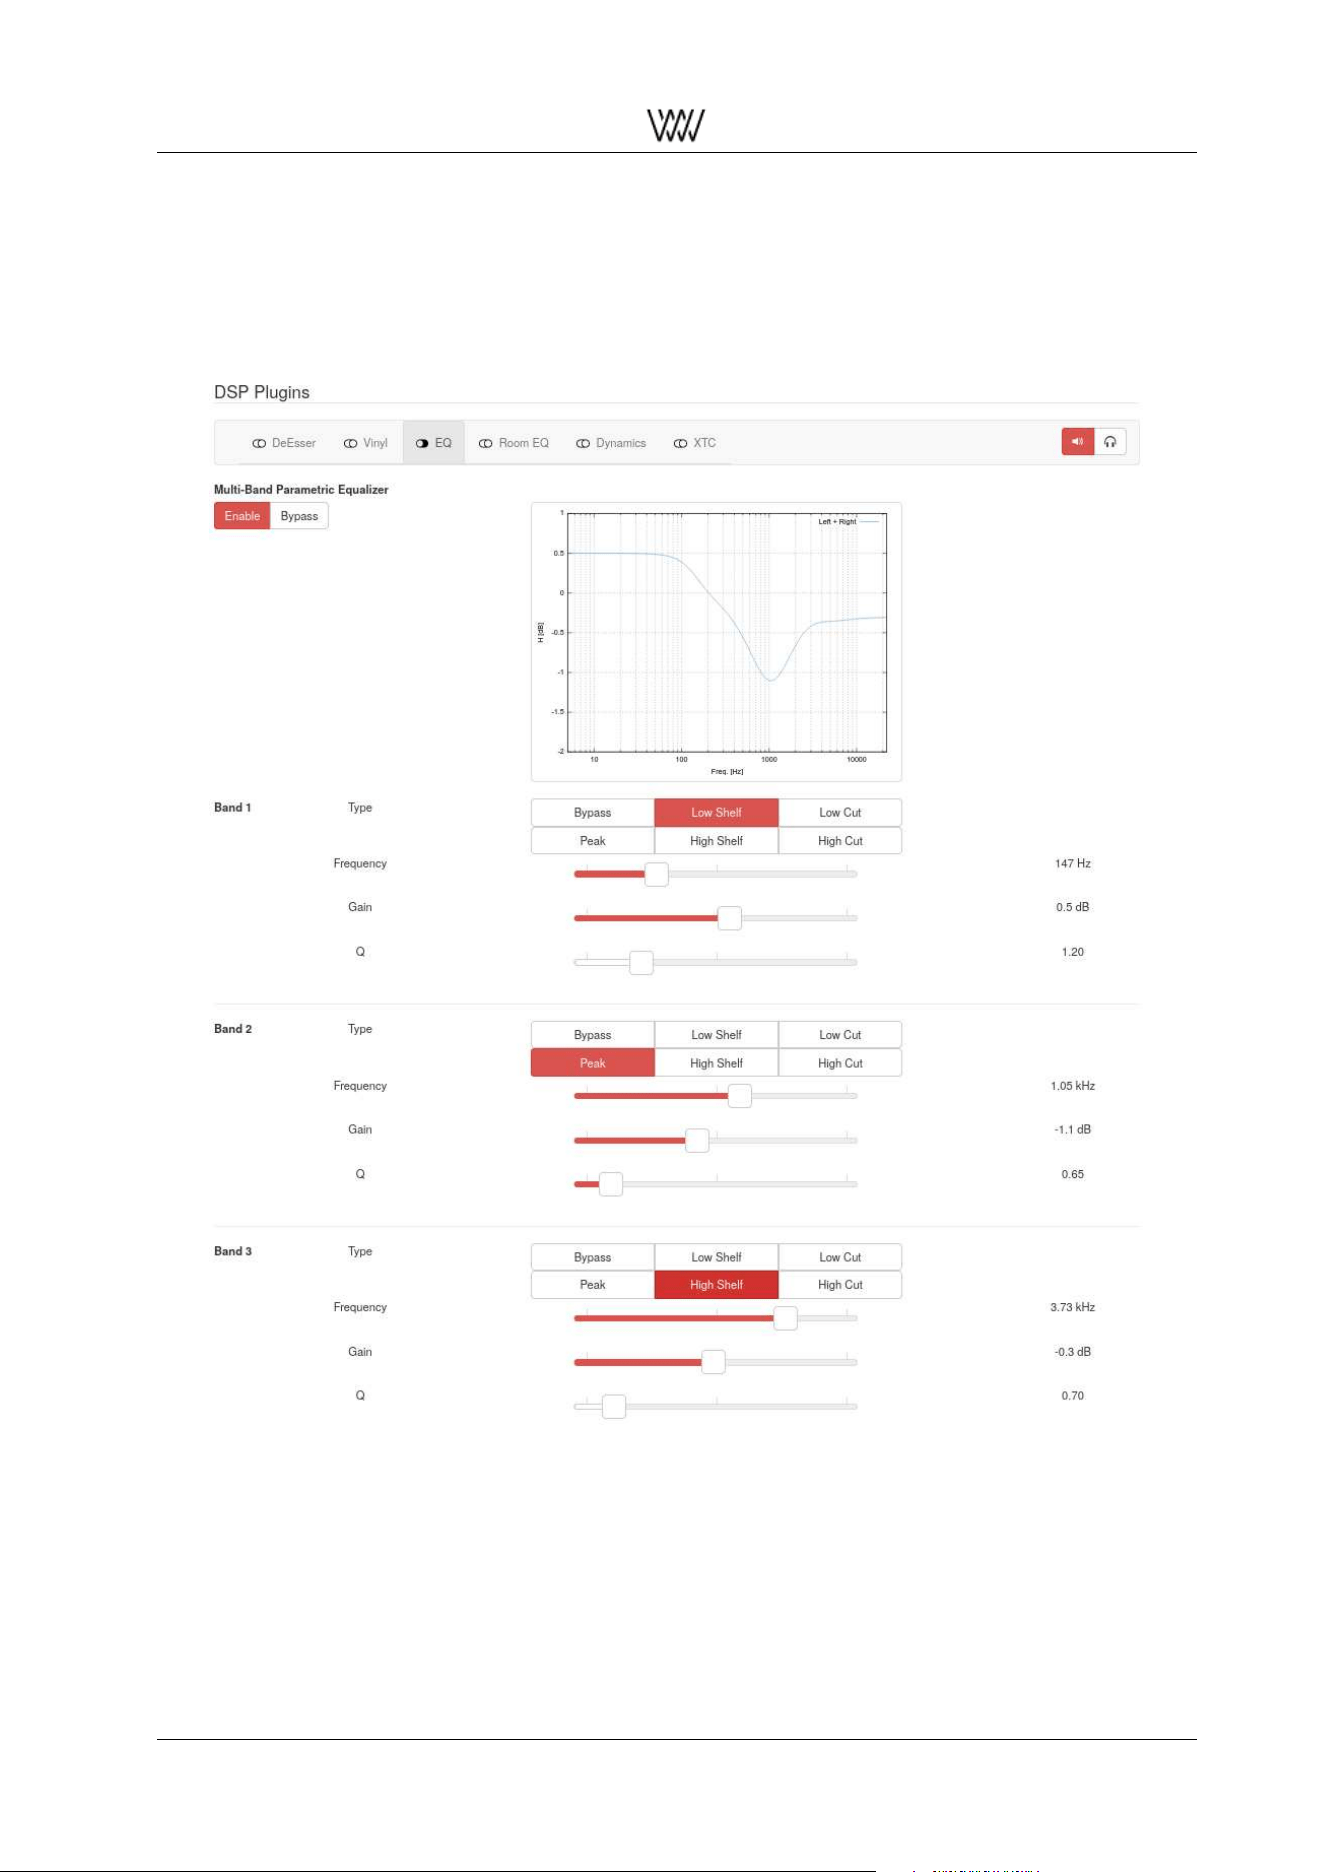
2.3.5 The Equalizer (EQ)
In the following screen shot the EQ plugin is selected. This plugin offers you 3 bands of equalization. All
settings can be defined by you.
A frequency response magnitude plot over all bands gives an informative overview of your EQ settings.
Figure 7: Equalizer plugin
A little example should give you an idea of the functionality and the manifold opportunities the EQ offers:
• The 1st band is set to low shelving with a boost of 0.5dB at 147 Hz, i.e. frequencies below 147 Hz get
boosted by 0.5dB.
• The 2nd band is a bell shaped peaking filter, attenuating 1.1dB at 1.05 kHz. The Q value is the width
of the bell shape. The smaller the Q the wider the bell.
• The 3rd band is a high shelving filter, attenuating frequencies above 3.73 kHz by 0.3dB
User Manual and 7 White Papers
Weiss Enginering Ltd. DAC501/DAC502
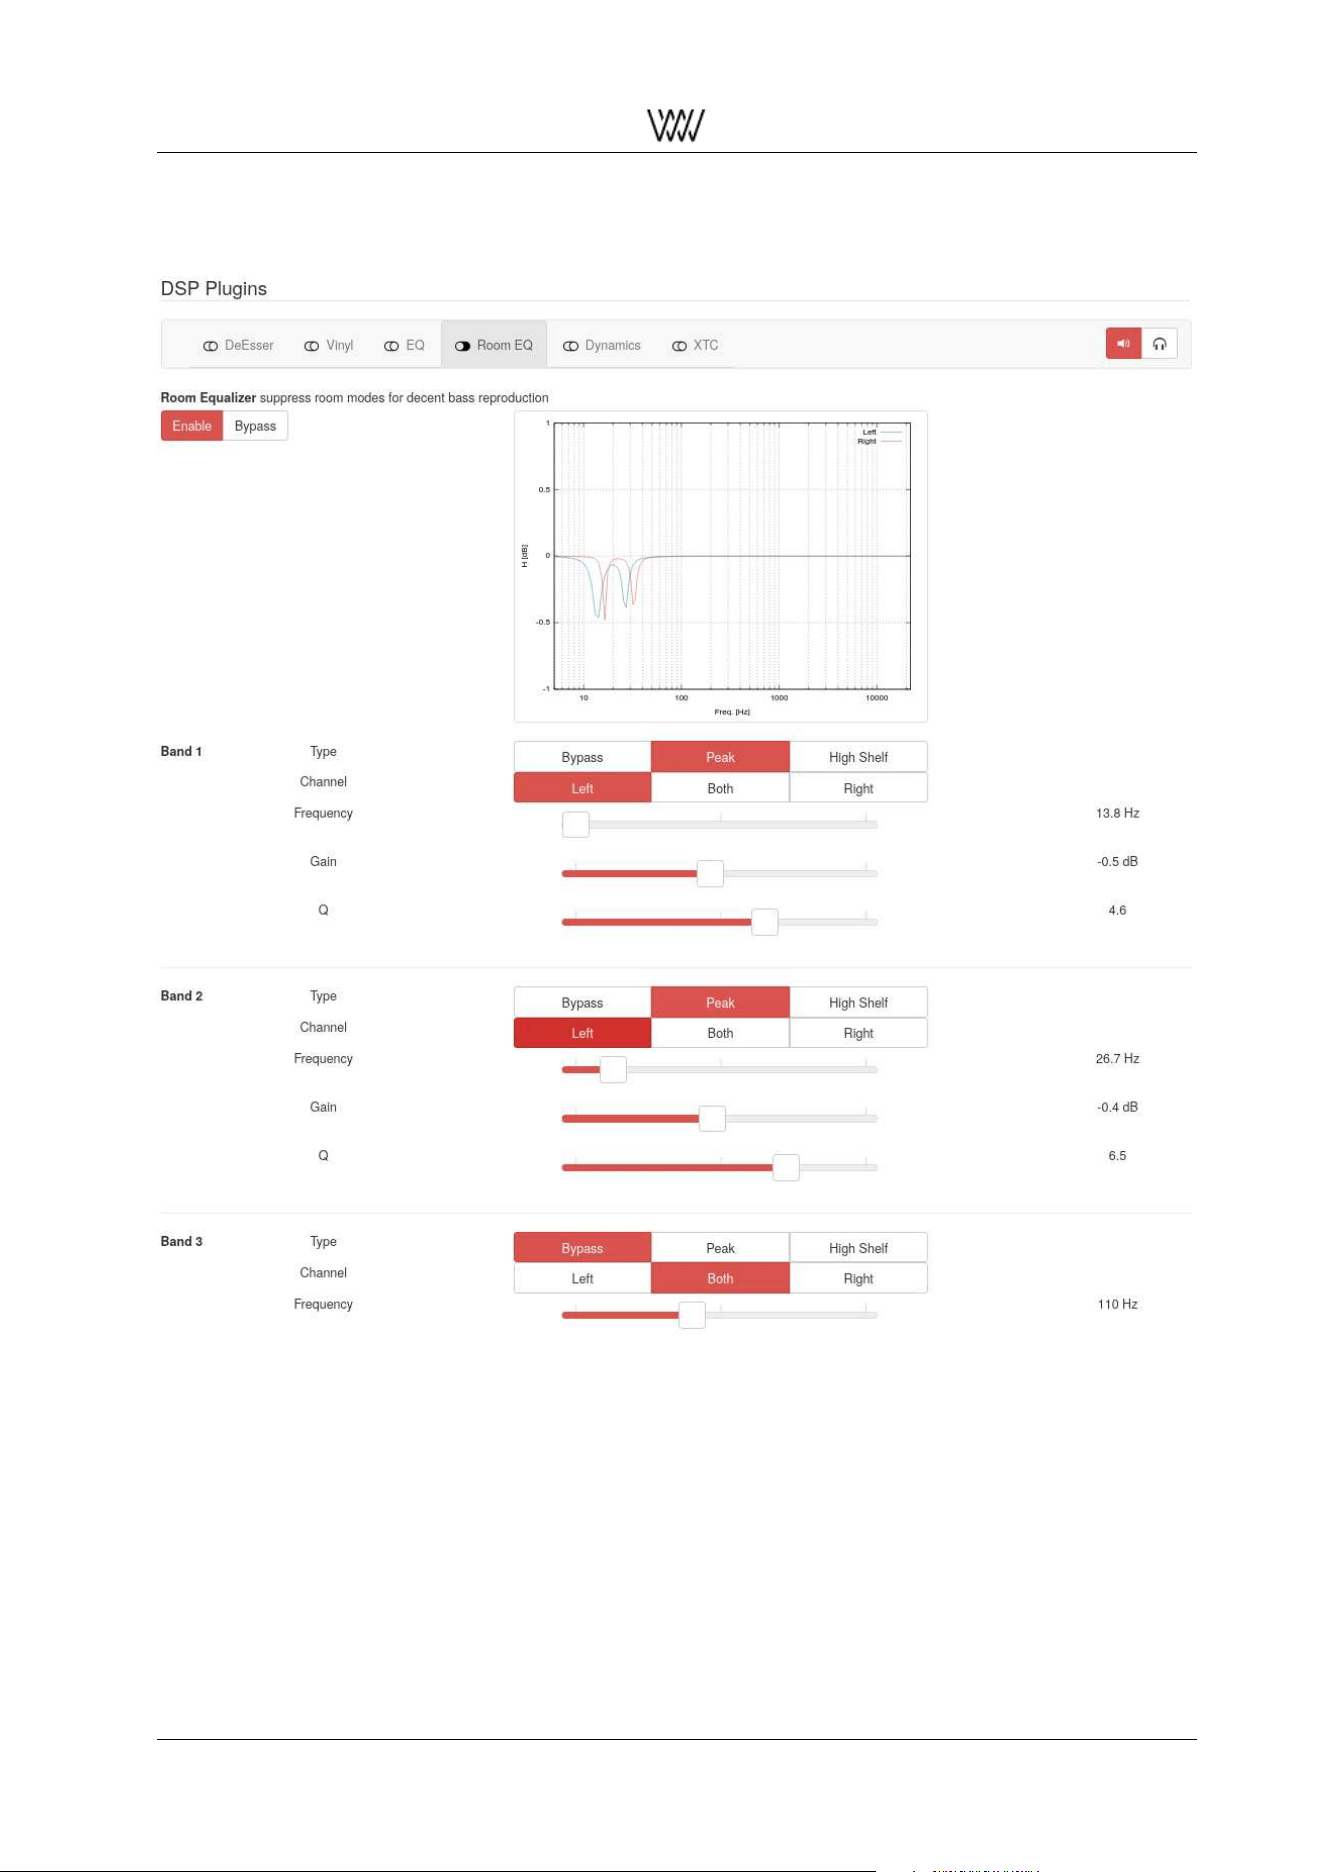
2.3.6 The Room Equalizer
Figure 8: Room EQ plugin
5 bands of room equalization are available. Only peaking mode makes sense such that certain (low) fre-
quencies can be attenuated with a sensible bell width set with the Q parameter.
A frequency response magnitude plot over all bands gives an informative overview of your Room EQ set-
tings.
Consider the following instructions on how to set up the Room EQ with a simple procedure, without using
any measurement.
In an alternative setup scenario we will use the room measurement software of the Illusonic company. (In
development.)
The simple setup procedure for the Room EQ uses a sine-wave sweep audio file to be played back via your
speaker setup. During playback you will write down the time(s) where the loudness of the sine wave reaches
a maximum, i.e. where the so called room modes show up. Those time figures then allow to determine the
User Manual and 8 White Papers

Weiss Enginering Ltd. DAC501/DAC502
frequencies of the sine wave and thus allow you to set the bands of the Room EQ in order to attenuate those
frequencies.
During the frequency sweep you probably will also notice some dips in the loudness. This is normal, as the
sine waves coming from your speakers add and subtract with the sine waves reflected from the room walls.
The added waves are what we try to suppress with the Room EQ.
The subtracted ones (loudness dips) cannot be corrected with a Room EQ or only to a very limited amount.
Do not try to lift those dips to full level, it won’t work. The problem with lifting the levels is that the Room EQ
(or your speakers) can easily get into overload and then generate nasty clipping noises.
The procedure is as follows:
1. Get one of these files from our website, one is in FLAC format the other in WAV:
https://www.weiss.ch/downloads/dac501/room-eq1.flac
https://www.weiss.ch/downloads/dac501/room-eq1.wav
2. Make sure to sit at your normal listening position (this is essential).
3. Play the file via your speakers at normal loudness (does not have to be loud). Note that the Room EQ
can be set individually for the left and the right speaker. Or can be set the same for both speakers.
If you decide to set them individually, e.g. because your speaker setup / room geometries are not
completely symmetrical, then do the following steps individually for left and right channels. Each band
of the Room EQ can have different settings in left and right. Make sure that only one speaker is playing
when setting left and right individually. You can select the proper speaker via the Balance fader.
4. Write down the time(s) into the playback where you hear a maximum volume of the sine wave. If
necessary repeat the test to find all those maxima.
5. If your listening room is not too complex in terms of wall geometries you may visit this website and
calculate the potential room mode frequencies by entering the dimensions of your listening room:
https://amcoustics.com/tools/amroc(This can help with determining the proper frequencies).
6. Get this PDF file with a table to translate the times you have written down to the frequency of the sine
wave: https://www.weiss.ch/downloads/dac501/sine-sweep.pdf- or use the table on the next
page.
7. Write down the frequencies according to the table.
8. Now activate the Room EQ in your DAC501/DAC502 unit. Enable first the overall Room EQ and then
enable one frequency band after the other as required (i.e. tap on the Peak pad to enable a band).
9. Select the first frequency you like to process, i.e. set the Frequency fader to the proper frequency
according to your list.
10. Move the Q fader to a value around 14 to start with. The Q is the Quality parameter which is the
bandwidth of the notch filter we apply to suppress the frequency. The higher the Q parameter the
narrower the notch. A high Q makes sure that not too many frequencies around the annoying frequency
are affected by the notch. On the other hand a high Q may cause that frequencies close to the one
we have selected still get through and excite the room mode.
11. Move the Gain fader to the left to e.g. -15dB to start with.
12. Now you may play the sine wave sweep again and check the frequency range around the frequency
you have selected to suppress. Check whether the listening volume stays about constant now, i.e. whether
the room mode is suppressed properly. If necessary adjust the Gain parameter. If you can’t get a
proper result by adjusting the Gain parameter (i.e. you always get too much loudness at the room
mode frequency) then adjust the Q value to a lower value and then try again with the Gain parameter.
13. Now select another frequency you may have on your list and proceed from 8) above again. Usually
there are only a very few frequencies which need treatment, so the 5 bands of the Room EQ should
be fine.
User Manual and 9 White Papers

Weiss Enginering Ltd. DAC501/DAC502
Once you have properly set the Room EQ you will notice a much clearer reproduction, without boomed
bass. Note, you may have gotten used to the acoustics of your playback setup and then when correcting it
with the Room EQ it may sound strange at first. But keep it and listen to it, you will get used to it again and
enjoy listening to a better reproduction chain.
User Manual and 10 White Papers
Weiss Enginering Ltd. DAC501/DAC502
Time in seconds Frequency in Hz Time in seconds Frequency in Hz
4 200 77 65
4 199 78 64
5 197 79 63
6 194 80 62
7 191 81 61
8 188 82 60
9 185 83 59
10 182 84 58
11 179 85 57
12 177 86 56
13 174 87 56
14 171 88 55
15 169 89 54
16 166 90 53
17 163 91 52
18 161 92 51
19 159 93 51
20 156 94 50
21 154 95 49
22 152 96 48
23 149 97 48
24 147 98 47
25 144 99 46
26 142 100 45
27 140 101 45
28 138 102 44
29 136 103 43
30 134 104 43
31 132 105 42
32 130 106 41
33 128 107 41
34 126 108 40
35 124 109 40
36 122 110 39
37 120 111 38
38 118 112 38
39 117 113 37
40 115 114 37
41 113 115 36
42 111 116 36
43 109 117 35
44 108 118 34
45 106 119 34
46 105 120 33
47 103 121 33
48 101 122 32
49 100 123 32
50 98 124 31
51 97 125 31
52 95 126 30
53 94 127 30
54 92 128 30
55 91 129 29
56 90 130 29
57 88 131 28
58 87 132 28
59 86 133 27
60 84 134 27
61 83 135 26
62 82 136 26
63 80 137 26
64 79 138 25
65 78 139 25
66 77 140 24
67 76 141 24
68 74 142 24
69 73 143 23
70 72 144 23
71 71 145 23
72 70 146 22
73 69 147 22
74 68 148 22
75 67 149 21
76 66 150 21
151 21
152 20
153 20
User Manual and 11 White Papers
Weiss Enginering Ltd. DAC501/DAC502
2.3.7 Headphone EQ
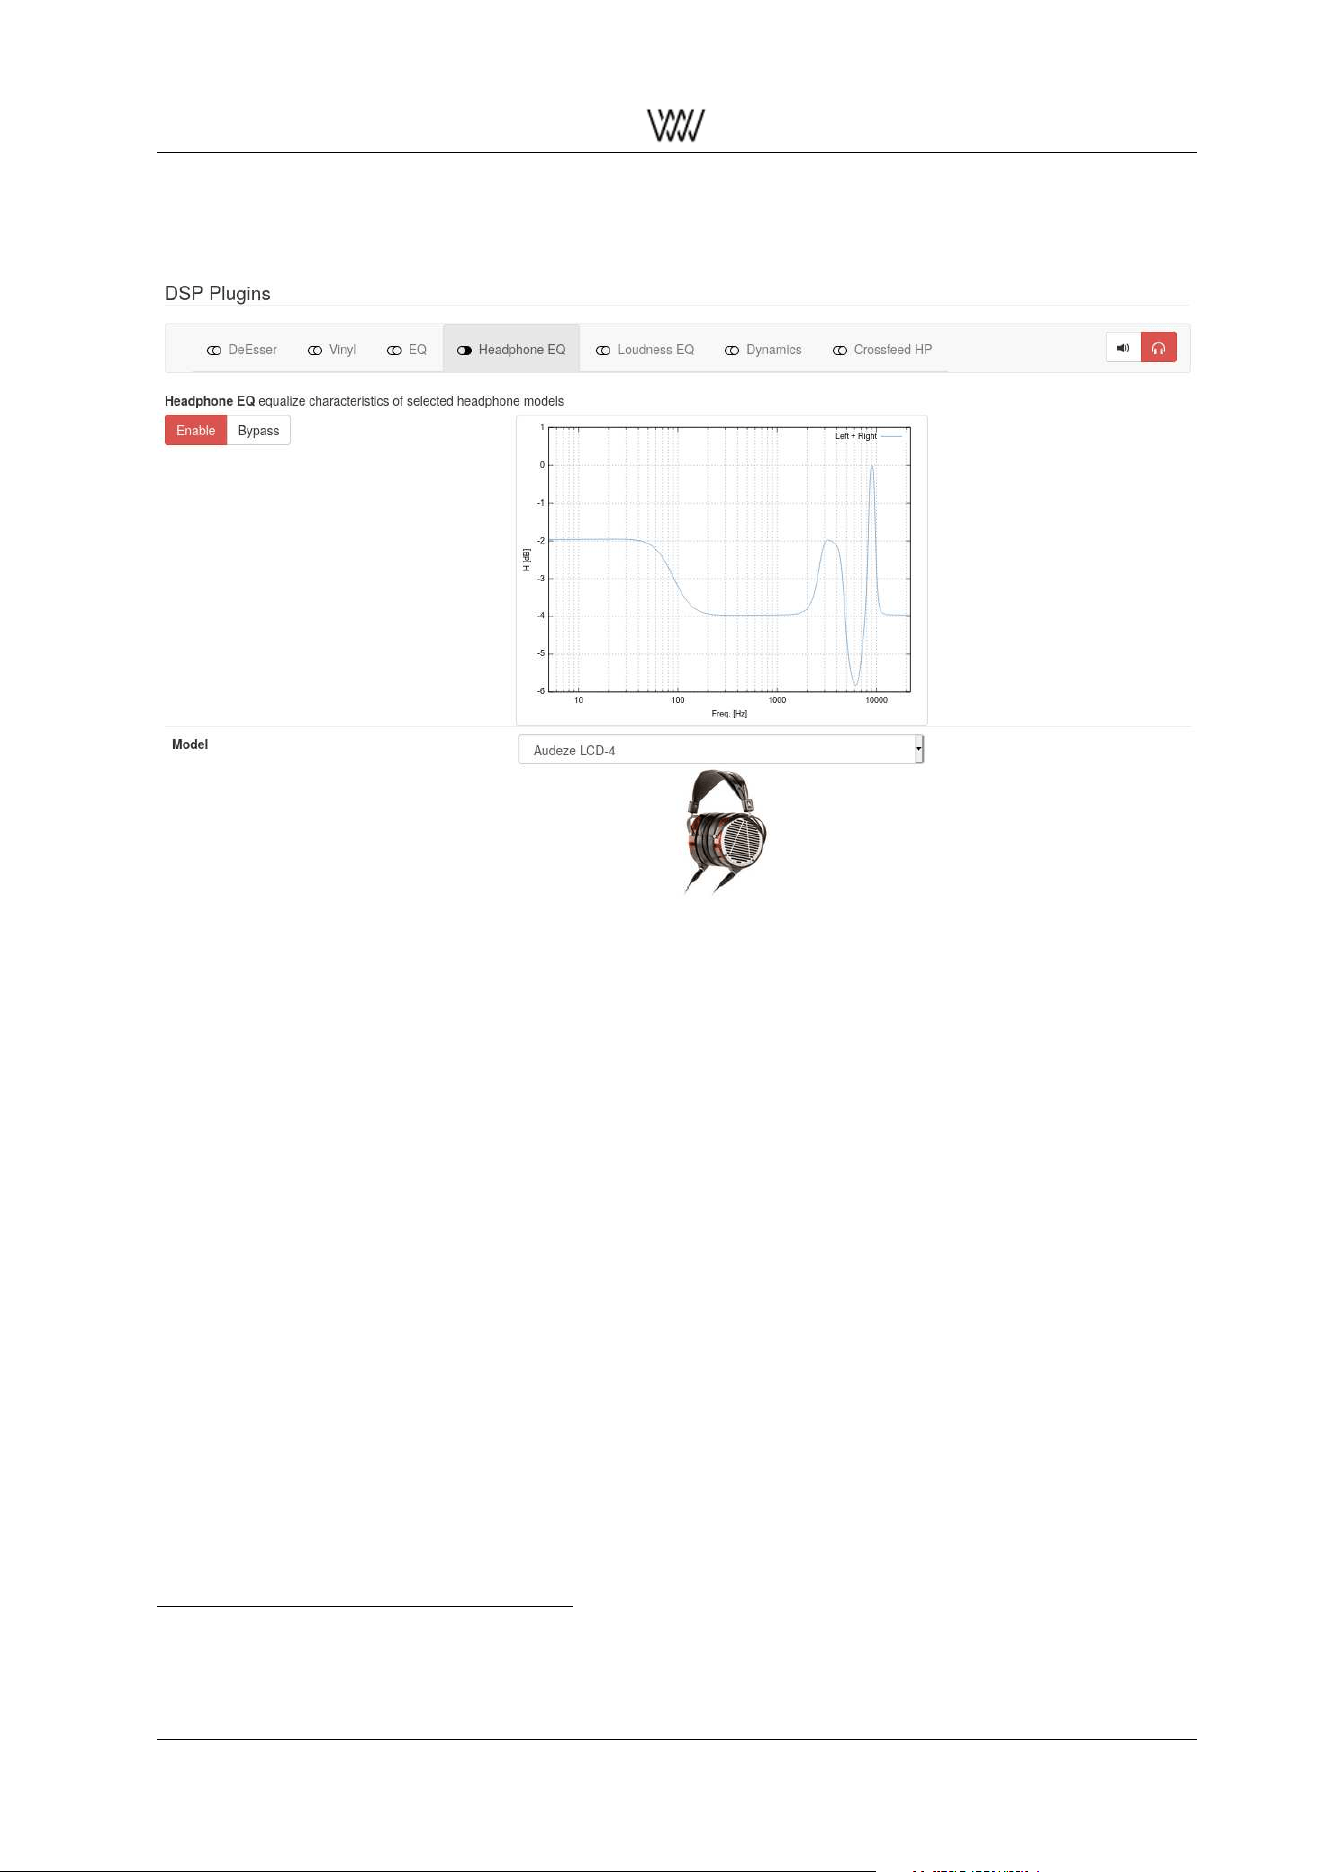
Figure 9: Headphone EQ plugin
Fig. 9 shows the headphone EQ plugin. Select your headphones Model using the drop-down menu. Based
on your selection an associated photo of the current headphone model is displayed, click on it to show the
manufacturer’s product website.
In addition the frequency response of the corresponding headphone EQ will be plotted. The EQ setting is
designed by the manufacturer and tailored to optimize the sound of the headphone. These specified EQ
designs can not be altered by the user.
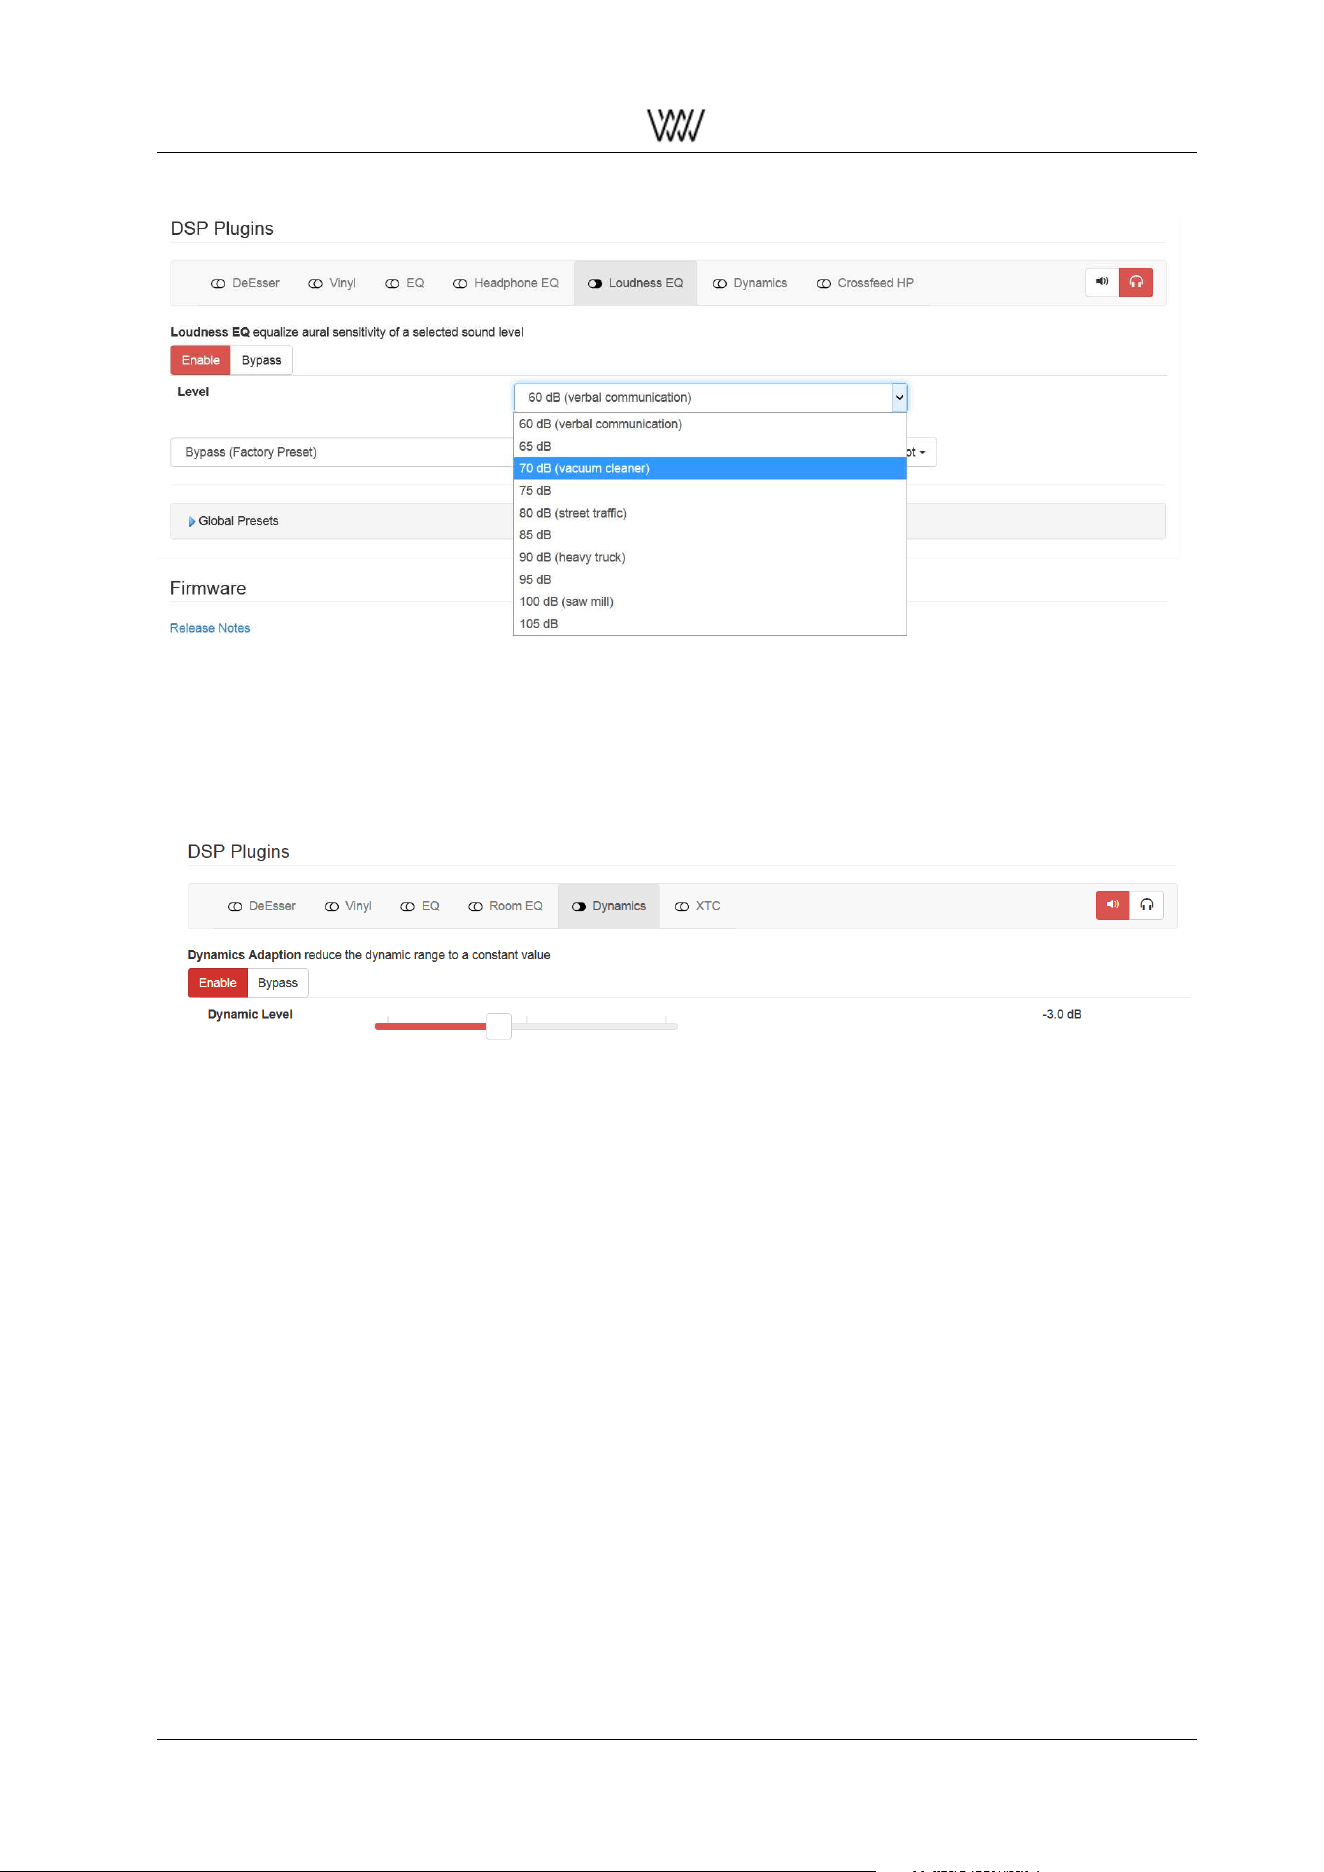
2.3.8 Loudness EQ
The loudness EQ visualized in figure 10 is based on the Equalizer patent of Bernhard Schwede
2
. The idea
behind this equalization is based on psychoacoustic grounds.
Mainly the psychoacoustic quantity loudness is eponymous and essential for the EQ design by Schwede.
In acoustics this loudness describes the subjective perception of sound pressure
1
. Schwedes EQ design
then considers this subjective perception to create a more pleasant playback regarding the sound intensity.
The specific design of Schwedes patent is implemented in the presented plugin.
Summing up this EQ offers you the possibility to influence playback volume in such a way that the resulting
loudness impression becomes more authentic throughout the audible frequency spectrum.
Choose your desired loudness Level via the drop-down menu. These ten different level settings in dB are
illustrated with comparisons benefiting an intuitive use of this plugin. Starting at the lowest level at 60 dB
you can increase the loudness up to 105 dB.
2
Patent specification: EP 3 123 471 B: Schwede, Bernhard ”Equalizer, audio system with such an equalizer and method
for equalizing a sound mix”. https://data.epo.org/publication-server/pdf-document/EP15712869NWB1.pdf?PN=EP3123471%
20EP%203123471&iDocId=5586961&iepatch=.pdf
User Manual and 12 White Papers
Weiss Enginering Ltd. DAC501/DAC502
Figure 10: Loudness EQ plugin
2.3.9 Dynamics Adaption
In the following screen shot the Dynamics Adaption or shortly Dynamics plugin is selected and enabled.
Figure 11: Dynamics Adaption plugin
This plugin reduces the dynamic range of the played audio to a constant value. This is useful when listening
to a desired play list with songs that have quite a different loudness - for example while having a dinner with
friends. With this plugin your play list will be played with overall the same loudness impression.
To adjust how strong this dynamic range reduction should affect the playback you can set the Dynamic
Level. If you want to have less dynamics left in the output choose a low Dynamic Level. If you want to have
still a lot of dynamics left but avoid loud peaks increase the Dynamic Level again. We recommend you to
start with a Dynamic Level at 0dB.
Note, the Dynamics Adaption algorithm apparently depends on the level fed into the algorithm. We recom-
mend to feed the DAC50x with the maximally possible level. I.e. have any digital level control which may
be sitting in front of the DAC50x (like e.g. a network player output) set to the maximal level.
User Manual and 13 White Papers
Weiss Enginering Ltd. DAC501/DAC502
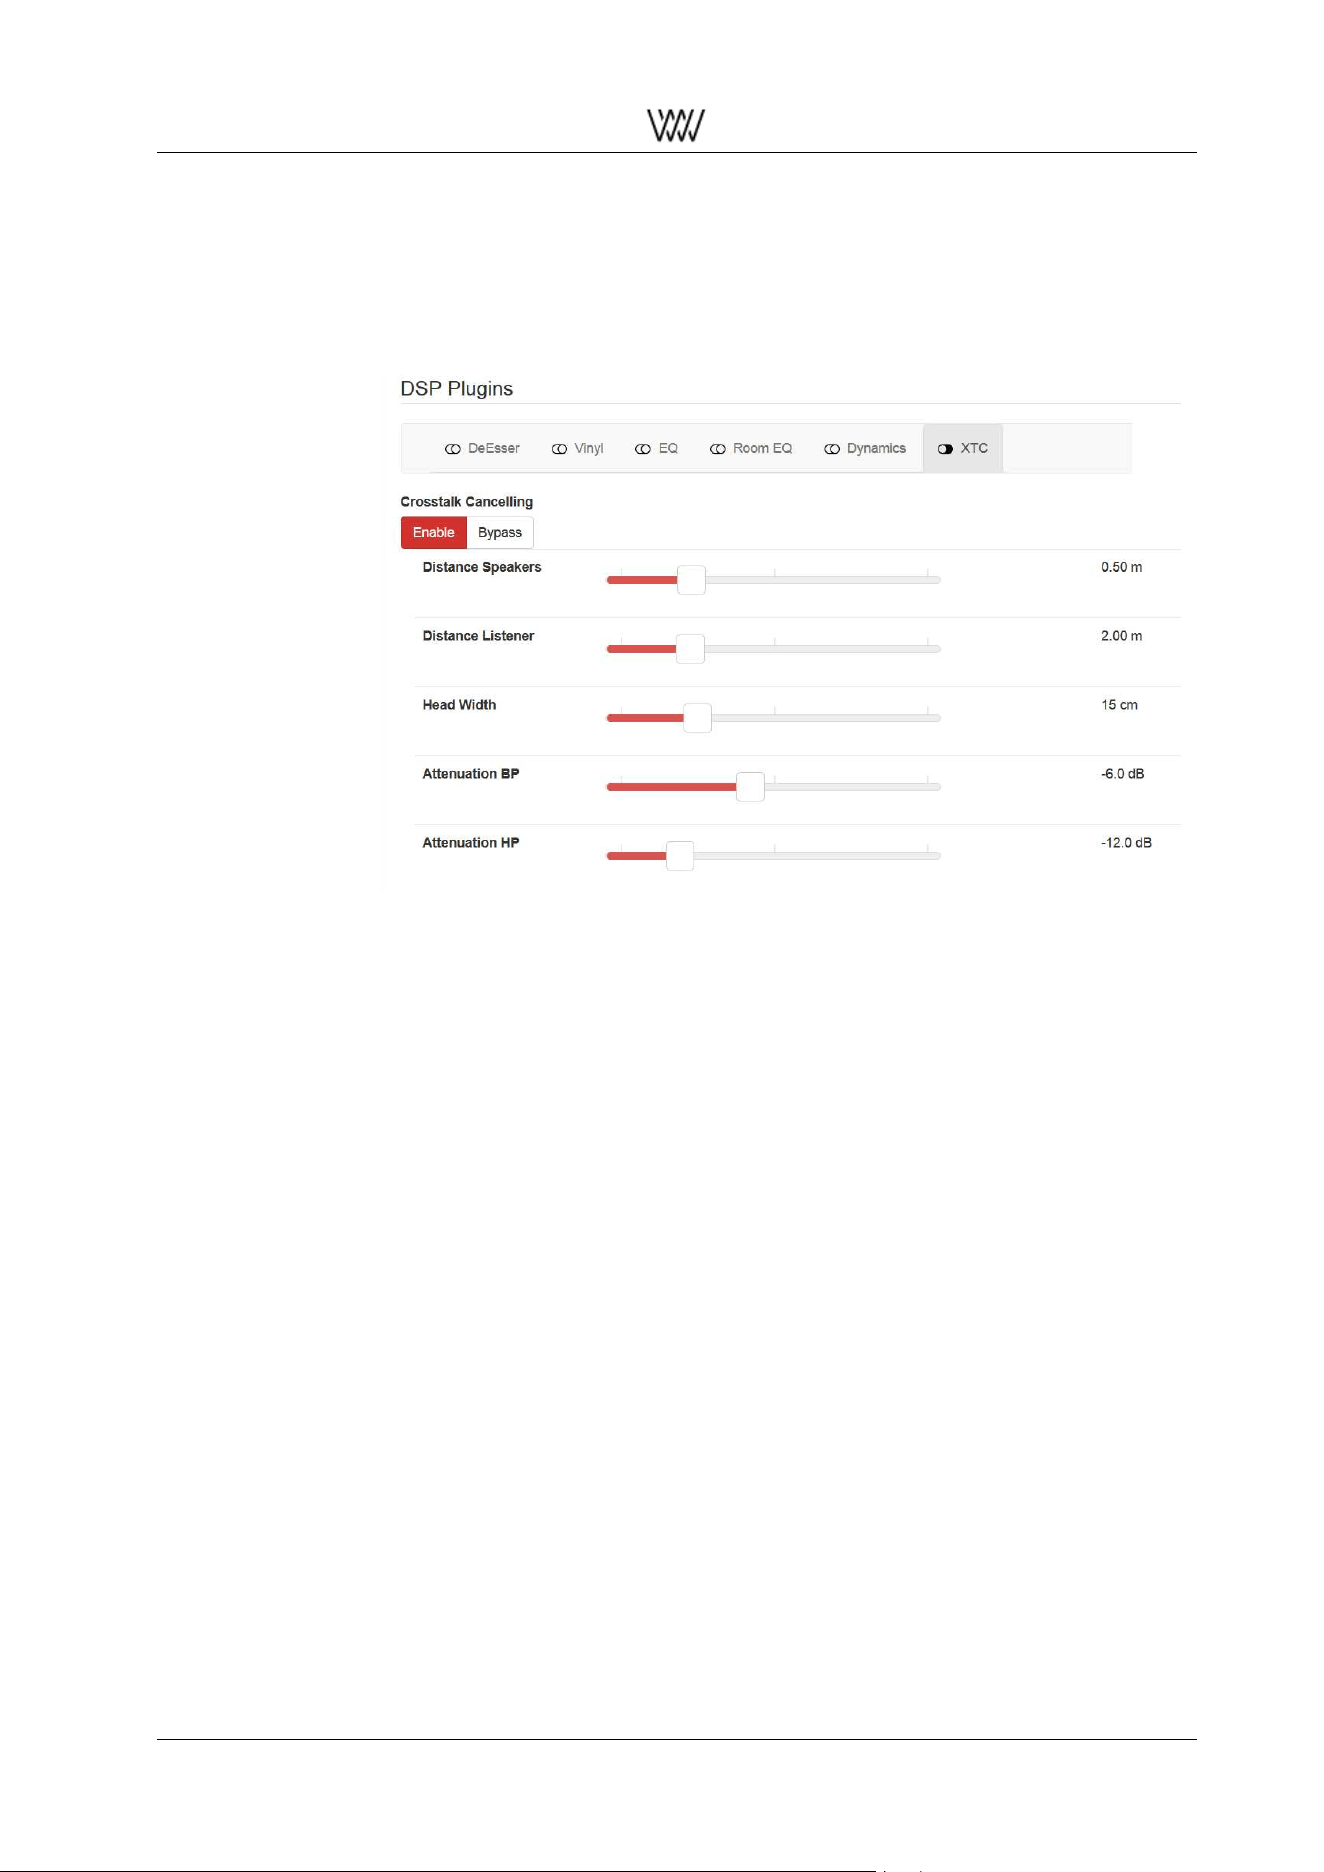
2.3.10 The Crosstalk Cancellation (XTC)
The XTC processing is a special kind of filtering which allows to reduce the crosstalk between the left speaker
and the right ear and between the right speaker and the left ear.
Thus the playback resembles a playback via headphones (where that crosstalk is close to zero), but speak-
ers are used and thus the problems with headphone playback (e.g. in-head localization) are avoided.
the XTC plugin is
selected →
enable is highlited in
red→
Distance between
speaker centers→
in meters
Distance listener →
to baseline between
speakers
Listener’s head
width →
Mid frequency
attenuation →
High frequeny
attenuation →
Figure 12: XTC plugin
With the XTC playback the listeners gets a live-like listening experience. The sound stage extends beyond
the speakers and even becomes 3-dimensional with certain recordings. The best suited recordings are
those made with a dummy head (binaural recordings) and live recordings also are often suited very well.
The dummy head is a plastic model of a human head with microphones in its ears. This head is placed in
the concert hall in order to record the performance in a 2-channel manner.
XTC works best if the speakers are fairly close to each other compared to the listener distance. Set the
geometry of your setup with the Distance Speakers and Distance Listener faders. If the geometry is not
very well suited for the XTC playback, the background of the two fader sections turns yellow.
The XTC may still work but may be compromised. Note, the listener distance is the distance between lis-
tener and the baseline between the speakers.
Also set your head width with the appropriate fader. This value is not that critical. 15cm is a typical head
width.
With the Attenuation parameters set the XTC for best performance. Start the Attenuation BP fader at the
left and move it to the right for an optimal setting. Around -5dB is a typical value for a good performance.
The Attenuation HP you may set to the same value as the Attenuation BP or experiment with its setting. The
Attenuation HP controls the XTC of the high frequency band, so changes may be more difficult to notice.
The Attenuation BP controls the mid frequency band.
The low frequencies are not crosstalk cancelled at all. After setting all parameters you may switch back
and forth between XTC on and off to check the effect. You may notice a loss in the low frequency band
when switching on the XTC. This can be compensated with the EQ plugin. E.g. boost the low frequencies
at around 150Hz with a peaking filter at Q around 1.4 and a boost of a few dBs.
2.3.11 Crossfeed Headphone
The Crossfeed Headphone plugin is designed to enhance the playback via headphones. Its usage is espe-
cially recommended when listening to audio with high channel separation. Furthermore it creates a more
User Manual and 14 White Papers

Weiss Enginering Ltd. DAC501/DAC502
roomy sound scape, similar to loudspeaker reproduction in a room.
The Crossfeed Headphone plugin allows adjusting the Amount level between 0 and 100 in order to achieve
your preferential setting. A higher Amount results in stronger impact of the plugin’s effect on the played back
audio.
See section 4.8 for further details about this plugin.
Figure 13: Crossfeed HP plugin
User Manual and 15 White Papers
Weiss Enginering Ltd. DAC501/DAC502
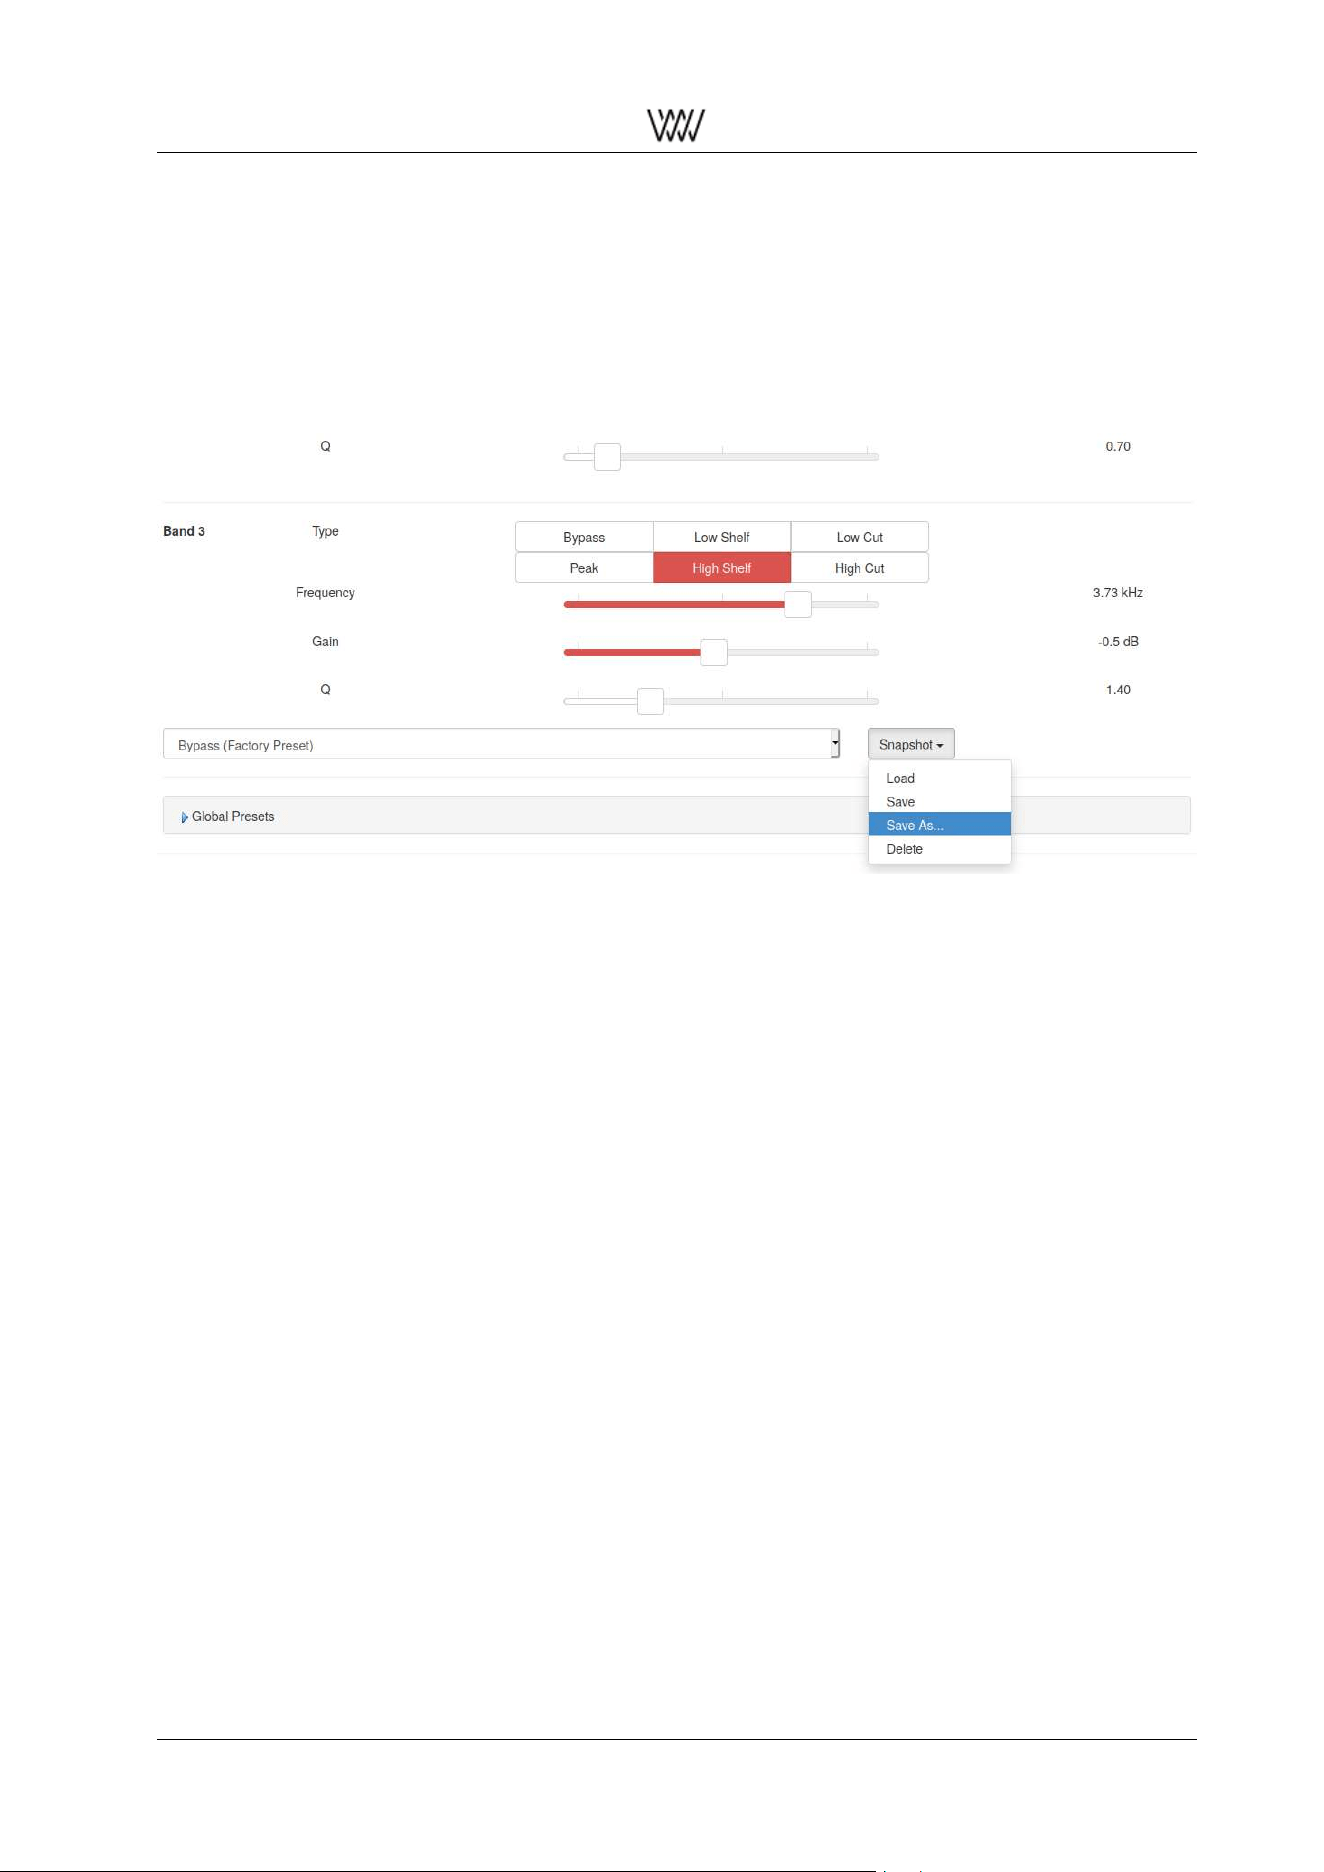
2.3.12 Snapshot Storage
Snapshots allow you to save and recall your favorite DSP plugin settings. Each plugin maintains its own set
of snapshots. Moreover snapshots can be used to assemble Global Presets (section 2.3.13).
Select your intended DSP plugin and adjust its parameters as desired. Whether a plugin is enabled or
bypassed is also part of its setting and will be stored in the snapshot.
Figure 14: Snapshots maintenance
In order to recall a stored snapshot select it by name from the list and tap on Snapshot → Load.
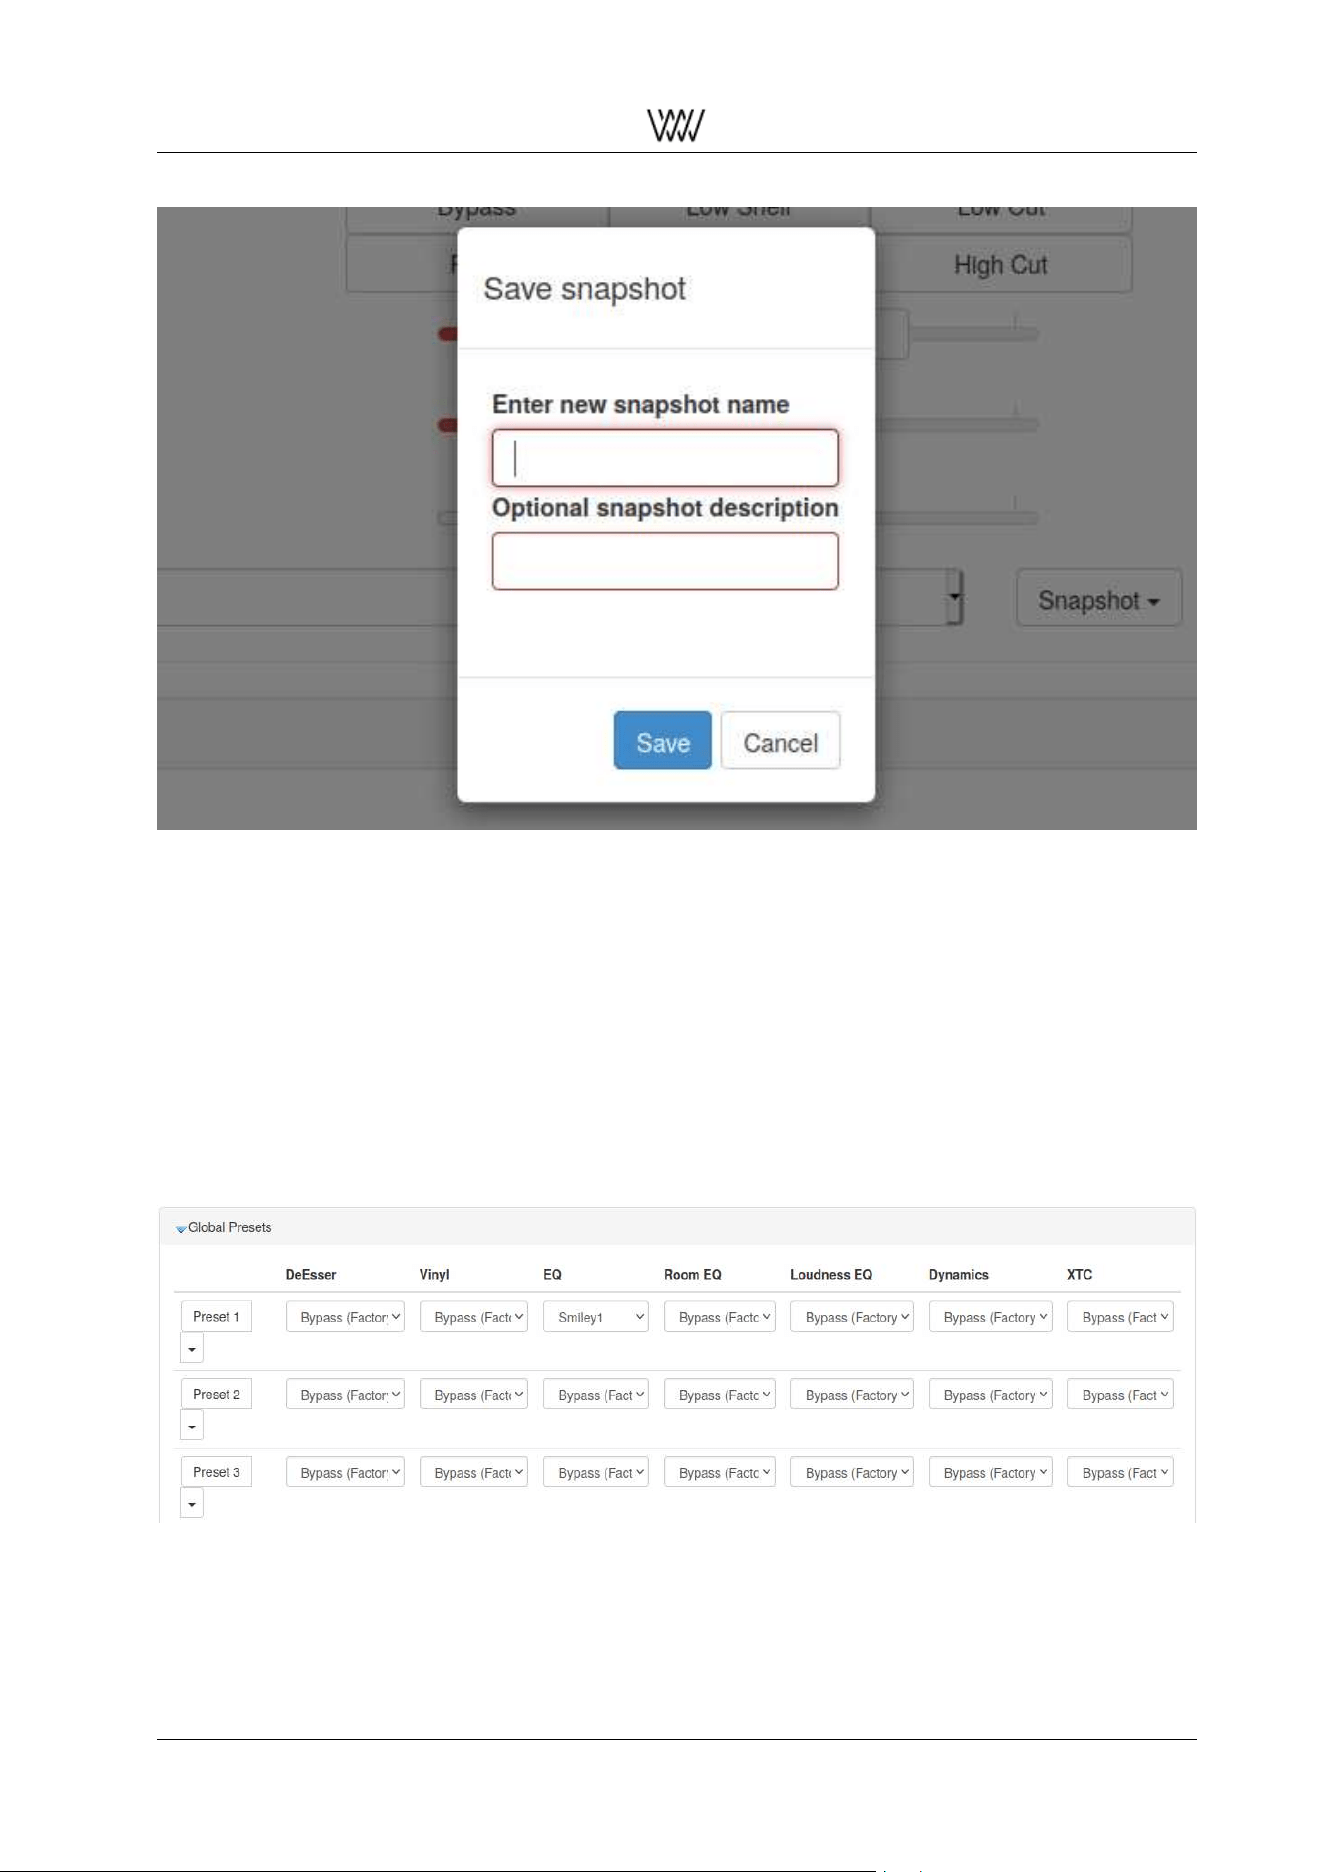
Store a plugin’s current setting by tapping on Snapshot → Save As... to generate a new snapshot (with
name and optional description, see fig. 15).
Or use Snapshot → Save to overwrite the currently selected snapshot.
Note: Snapshots pre-marked with Factory Preset cannot be overwritten or deleted but may serve as con-
venient starting points for your own snapshots.
User Manual and 16 White Papers
Weiss Enginering Ltd. DAC501/DAC502
Figure 15: Saving a new snapshot
2.3.13 Global Presets
The 12 Global Presets are a useful facility to compose and quickly recall your favourite settings.
Each Preset can be recalled from the Global Preset composer matrix or via the 12 DSP Preset keys on the
IR remote control.
A Preset is composed of Snapshots from the individual DSP plugins (section 2.3.12). Preset 1 in fig. 16
consists of the Smiley1 EQ Snapshot while the other DSP algorithms are bypassed.
The plugin sequence within the composer matrix reflects the actual sequence of the DSP processing. Pre-
set snapshot dropdown lists of plugins which are currently not applicable (due to current Output Termination
setting, see section 2.3.2) are not shown.
Figure 16: Global Preset composer matrix
With additional DSP plugins in future firmware upgrades the preset composer matrix will obviously grow.
Furthermore we will supply multiple built-in factory preset snapshots as suggestions for sensible presets.
Note: Each Output and each Output Termination has its own separate set of Presets. So there is a total of
User Manual and 17 White Papers
Weiss Enginering Ltd. DAC501/DAC502
48 Presets, 12 each for XLR/RCA and JACK and their Output Termination (Speakers or Headphones). If
the Output and/or Output Termination is changed the Preset bank is automatically changed as well.
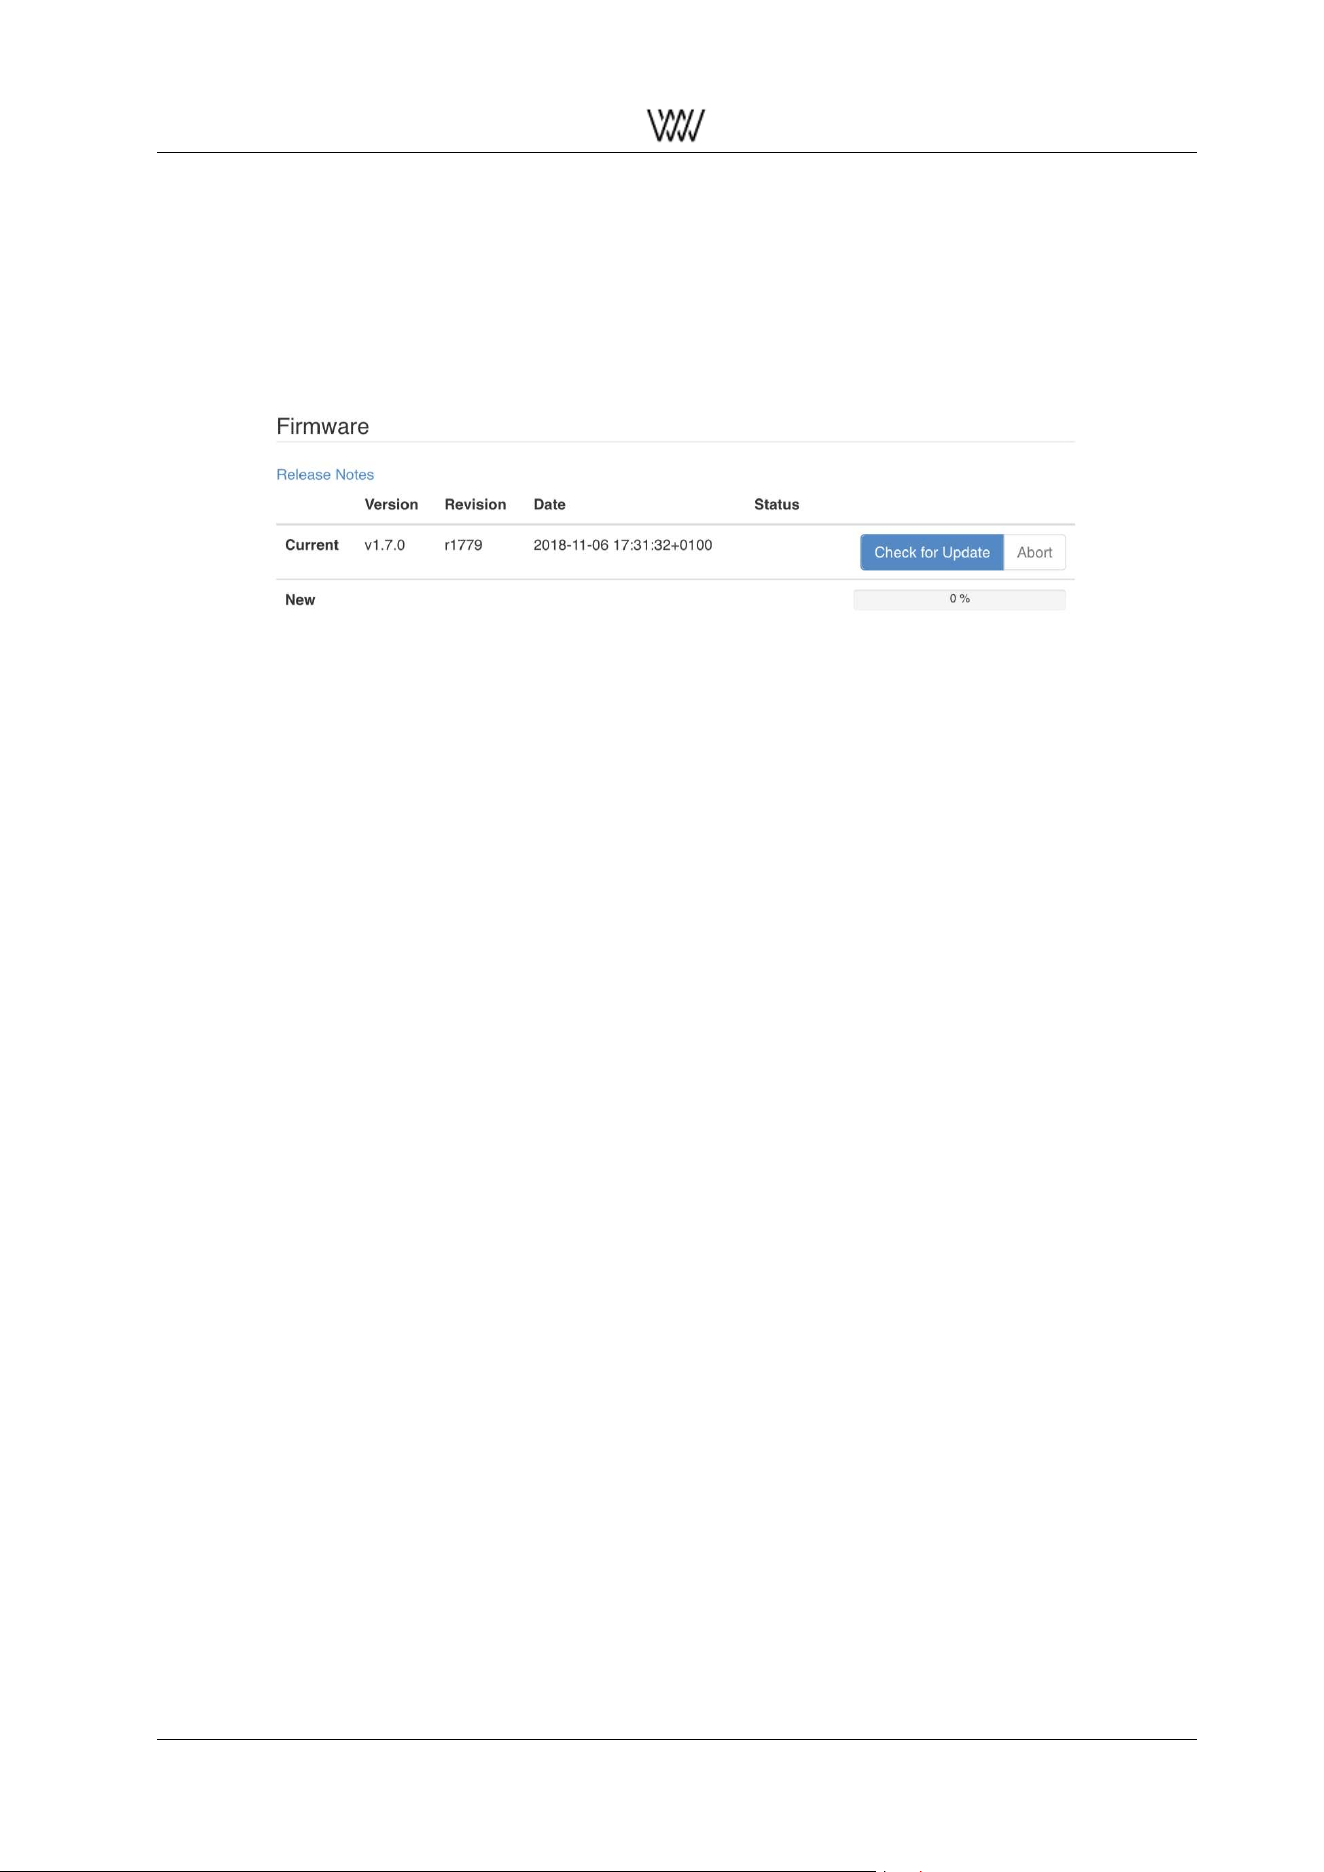
2.3.14 Firmware Update/ Download
Figure 17: Firmware update
At the bottom of the web interface there is the Check for Update pad. Tapping on that pad starts the DAC50x
to connect to our Server to see whether there is any new device firmware available. (The DAC50x has to
be connected via Ethernet to your internet router.)
If new firmware is available the pad allows to download the firmware (allow for some time due to internet
speed) and after download the firmware can be activated (also allow some time for this).
Once this has been done the DAC50x needs to be rebooted in order to get the new firmware running.
For detailed information about the new and previous firmware releases tap on the Release Notes link.
2.3.15 M/S Control
→ to be announced
User Manual and 18 White Papers
Weiss Enginering Ltd. DAC501/DAC502
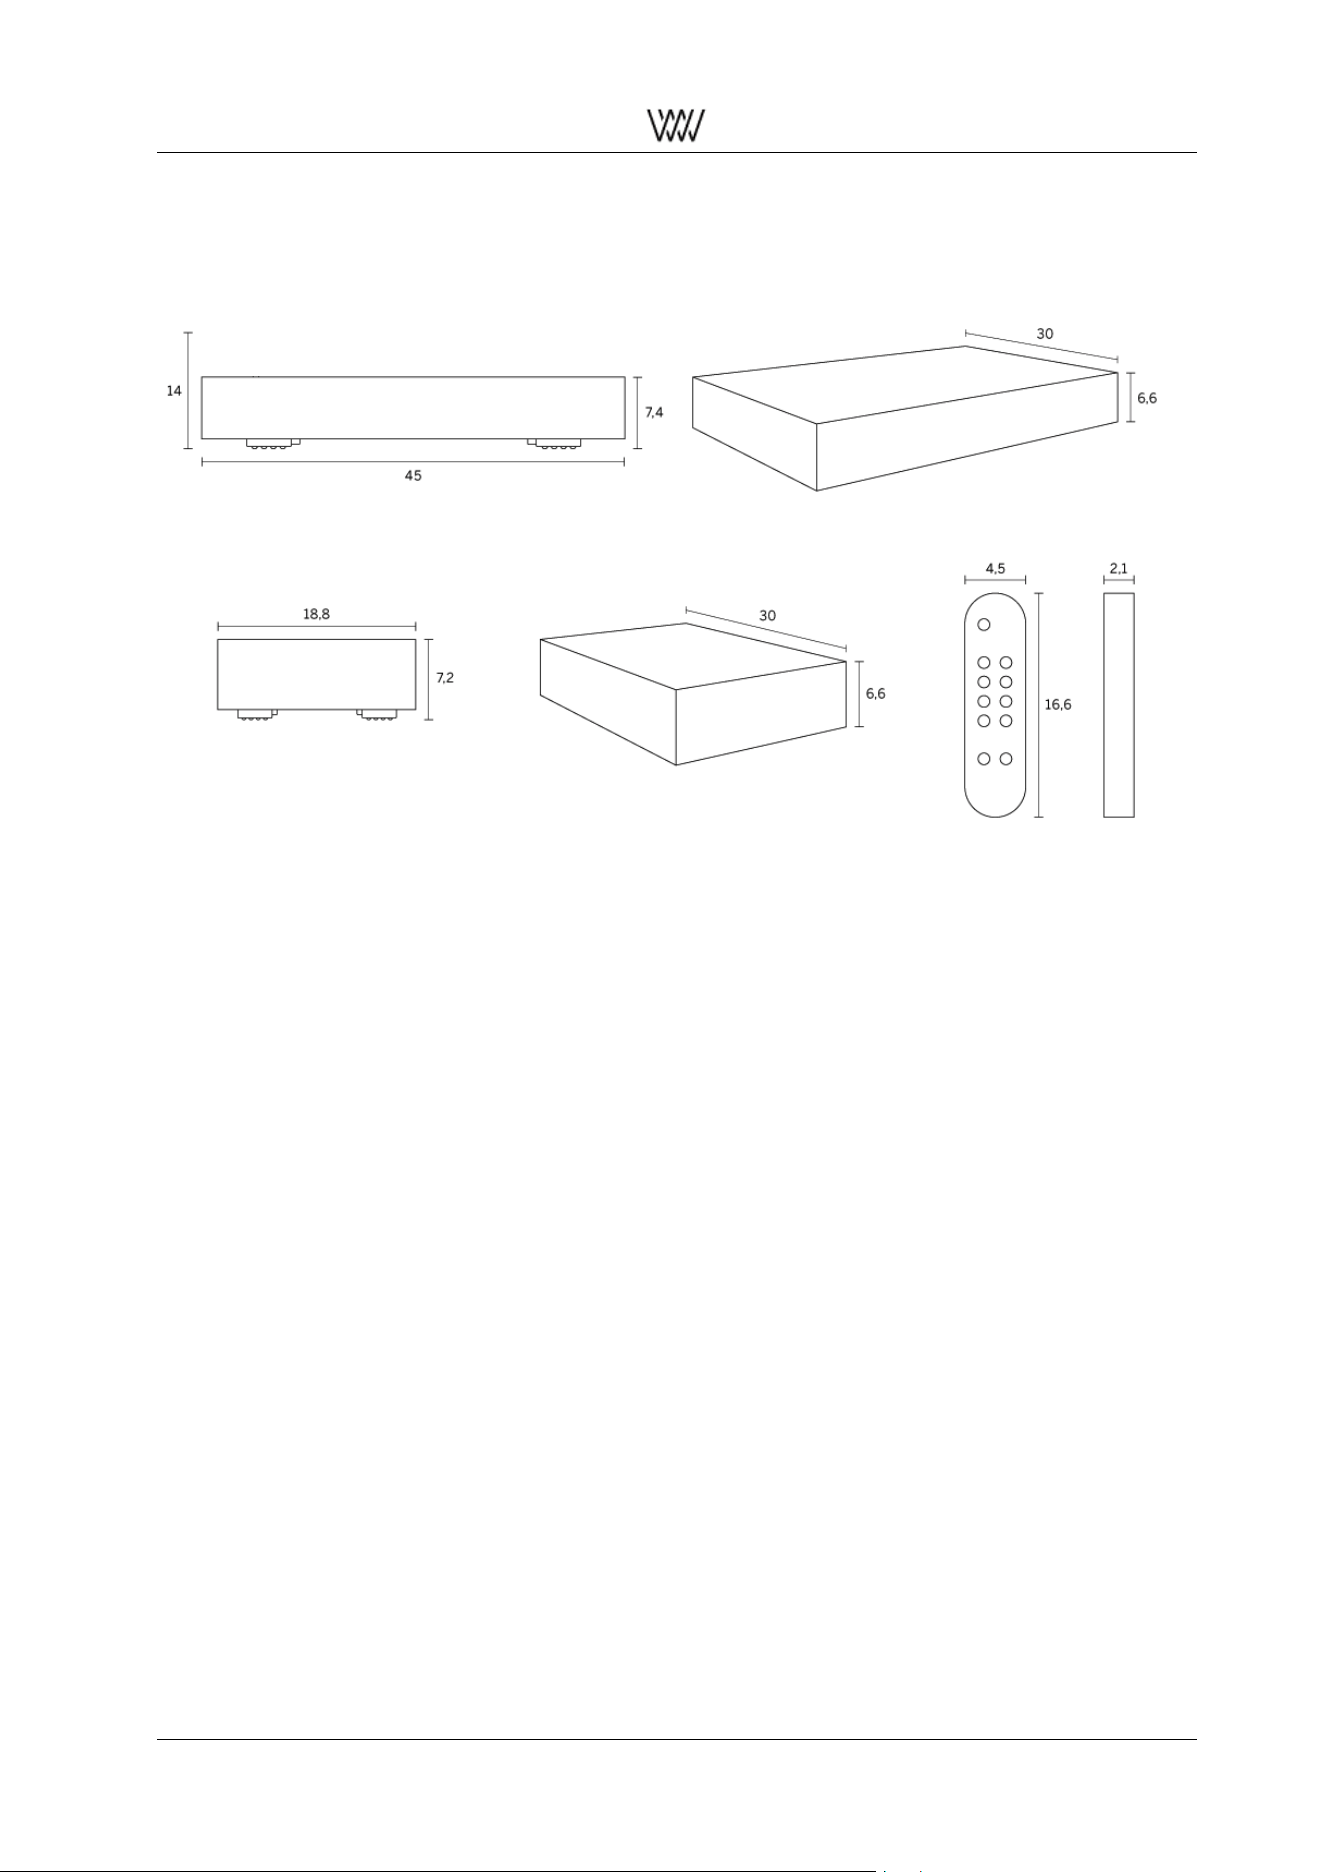
3 Technical Specification
Figure 18: Engineering drawings of the DAC501, DAC502 and the IR remote control
Power:
• Mains voltage: 100...120 V or 200...240 V, automatic voltage selection
• Fuse rating: 500 mA slow blow
• Power consumption: 25 VA max.
• Power consumption in standby: 2.2 VA max.
Size DAC501
• Depth: 30 cm
• Width: 18.8 cm
• Height: 6.6 cm
• Height with feet: 7.2 cm
Size DAC502
• Depth: 30 cm
• Width: 45 cm
• Height: 6.6 cm
• Height with feet: 7.4 cm
Size Remote:
• Depth: 2.1 cm
• Width: 4.5 cm
• Height: 16.6 cm
User Manual and 19 White Papers

Weiss Enginering Ltd. DAC501/DAC502
Available Colours: Silver, Black
Digital Inputs
• (1) XLR connector
• (1) RCA connector
• (1) TOSLINK connector (optical)
• (1) USB type B connector
• (1) RJ45 Ethernet connector
→ All inputs accept professional or consumer standard, i.e. accept AES/EBU or S/PDIF signals.
Sampling frequencies
• AES/EBU and S/PDIF inputs:
– 44.1 kHz, 48 kHz, 88.2 kHz, 96 kHz, 176.4 kHz, 192 kHz
• USB and RJ45 Ethernet inputs:
– 44.1 kHz, 48 kHz, 88.2 kHz, 96 kHz, 176.4 kHz, 192 kHz, 352.8 kHz, 384 kHz, DSD64, DSD128
• Toslink input:
– 44.1 kHz, 48 kHz, 88.2 kHz, 96 kHz
Input word-length: max. 24 / 32 Bits
Digital Outputs: None
Analog Outputs
• (2) XLR connectors (hot on pin 2), short circuit proof output circuitry, DC coupled, low output impedance
• (2) RCA connectors, short circuit proof output circuitry, DC coupled, low output impedance
• (1) 6.3mm Jack socket for headphones, DC coupled, low output impedance
• DAC502 only: (1) 4 pin XLR socket for headphones, DC coupled, low output impedance
The output level is selectable via the LCD menu or the web interface; four settings are provided as shown
below:
XLR Output
• 0dB setting: 6.8 V
rms
+18.9 dBu
• -10dB setting: 2.2 V
rms
+8.9 dBu
• -20dB setting: 0.68 V
rms
-1.1 dBu
• -30dB setting: 0.22 V
rms
-11.1 dBu
→ As input a 0 dBFS sine wave signal was used
→ These levels are achieved with a 0.0 dB setting for the level control on the LCD screen.
RCA Output:
User Manual and 20 White Papers

Weiss Enginering Ltd. DAC501/DAC502
• 0dB setting: 3.4 V
rms
+12.9 dBu
• -10dB setting: 1.1 V
rms
+2.9 dBu
• -20dB setting: 0.34 V
rms
-7.1 dBu
• -30dB setting: 0.11 V
rms
-17.1 dBu
→ As input a 0 dBFS sine wave signal was used
→ These levels are achieved with a 0.0 dB setting for the level control on the LCD screen.
Headphone Output:
• (1) stereo 1/4-inch jack connector, DC coupled. The output level is selectable via the LCD menu; four
level settings are provided as shown below:
– 0 dB setting: 6.8 V
rms
+18.9 dBu
– -10 dB setting: 2.2 V
rms
+8.9 dBu
– -20 dB setting: 0.68 V
rms
-1.1 dBu
– -30 dB setting: 0.22 V
rms
-11.1 dBu
→ As input a 0 dBFS sine wave signal was used
→ These levels are achieved with a 0.0 dB setting for the level control on the LCD screen.
Suggested headphone impedances:
• 0 dB setting: 200 Ω or higher
• -10 dB setting: 30 Ω or higher
• -20 dB setting: 10 Ω or higher
• -30 dB setting: 4 Ω or higher
→ The same parameters apply to the 4 pin headphone output of the DAC502 as well.
Synchronization
Via the input signal in case of the AES/EBU and S/PDIF inputs. Via the internal oscillator in the case of USB
and Ethernet inputs.
User Manual and 21 White Papers

Weiss Enginering Ltd. DAC501/DAC502
D/A Converter chip
Over-sampling multi-bit sigma-delta converter - Two converters per audio channel.
Measurements XLR/RCA Output
The measurements below have been taken at the following conditions (unless noted otherwise):
1 kHz measurement frequency, maximum selectable output level, 192 kHz sampling frequency (Fs),
22 kHz measurement bandwidth, unweighted, 0 dBr equals the output level at 0 dBFS input.
Frequency Response:
Fs = 44.1 kHz, 0 Hz...20 kHz: within ± 0.25 dB
Fs = 88.2 kHz, 0 Hz...20 kHz: within ± 0.25 dB
Fs = 88.2 kHz, 0 Hz...40 kHz: within ± 0.8 dB
Fs = 176.4 kHz, 0 Hz...20 kHz: within ± 0.25 dB
Fs = 176.4 kHz, 0 Hz...40 kHz: within ± 0.8 dB
Fs = 176.4 kHz, 0 Hz...80 kHz: within ± 2.5 dB
Total Harmonic Distortion plus Noise (THD+N):
-111 dBr at -3 dBFS input level
-125 dBr at -40 dBFS input level
-125 dBr at -70 dBFS input level
Linearity:
At 0 dBFS to -120 dBFS input level: less than ±0.2 dB deviation from ideal
Spurious components (including harmonics):
At 0 dBFS input level, maximum output level, 1 kHz, all components at less than -110 dB
At 0 dBFS input level, maximum output level, 4 kHz, all components at less than -110 dB
Crosstalk:
Better than 110 dB, 20 Hz...20 kHz
Inter channel Phase Response:
±0.3
◦
20 Hz...20 kHz
±0.6
◦
20 Hz...40 kHz
User Manual and 22 White Papers

Weiss Enginering Ltd. DAC501/DAC502
Measurements Jack Output
The measurements below have been taken at the following conditions (unless noted otherwise):
1 kHz measurement frequency, maximum selectable output level, 192 kHz sampling frequency (Fs),
22 kHz measurement bandwidth, unweighted, 0 dBr equals the output level at 0 dBFS input.
Frequency Response:
Fs = 44.1 kHz, 0 Hz...20 kHz: within ± 0.25 dB
Fs = 88.2 kHz, 0 Hz...20 kHz: within ± 0.25 dB
Fs = 88.2 kHz, 0 Hz...40 kHz: within ± 0.8 dB
Fs = 176.4 kHz, 0 Hz...20 kHz: within ± 0.25 dB
Fs = 176.4 kHz, 0 Hz...40 kHz: within ± 0.8 dB
Fs = 176.4 kHz, 0 Hz...80 kHz: within ± 2.5 dB
Total Harmonic Distortion plus Noise (THD+N):
-112 dBr (0.00025 %) at -3 dBFS input level
-121 dBr (0.000089 %) at -40 dBFS input level
-121 dBr (0.000089 %) at -70 dBFS input level
Linearity:
At 0 dBFS to -120 dBFS input level: less than ±0.4 dB deviation from ideal
Spurious Components (including Harmonics)::
At 0 dBFS input level, maximum output level, 100kΩ load, 1 kHz, all components at less than -110 dB
At 0 dBFS input level, maximum output level, 600Ω load, 1 kHz, all components at less than -110 dB
At 0 dBFS input level, maximum output level, 300Ω load, 1 kHz, all components at less than -110 dB
At 0 dBFS input level, maximum output level, 100kΩ load, 4 kHz, all components at less than -110 dB
At 0 dBFS input level, maximum output level, 600Ω load, 4 kHz, all components at less than -110 dB
At 0 dBFS input level, maximum output level, 300Ω load, 4 kHz, all components at less than -110 dB
Crosstalk:
Better than 105 dB, 20 Hz...20 kHz
Interchannel Phase Response:
±0.2
◦
20 Hz...20 kHz
±0.5
◦
20 Hz...80 kHz
User Manual and 23 White Papers
Weiss Enginering Ltd. DAC501/DAC502
4 Signal Processing Algorithms
4.1 The Weiss parametric Equalizer (EQ)
The parametric equalizer is one of the most used tools in the professional audio production studio. It allows
to shape the tonal character of a recording or of single instrument tracks with great precision. This is due to
the fact that all the parameters of the EQ can be user set. I.e. the frequency where the EQ acts, the width
of the bell shaped EQ curve and the amount of boost or cut all can be set independently.
The EQ in the DAC50x has three independent bands. Each of them can be set to a mode, namely low
cut\high cut (to get rid of disturbing low or high frequencies), low shelf \high shelf (to boost or cut low or high
frequencies) or peaking (to boost any frequency with a bell shaped curve with a variable width).
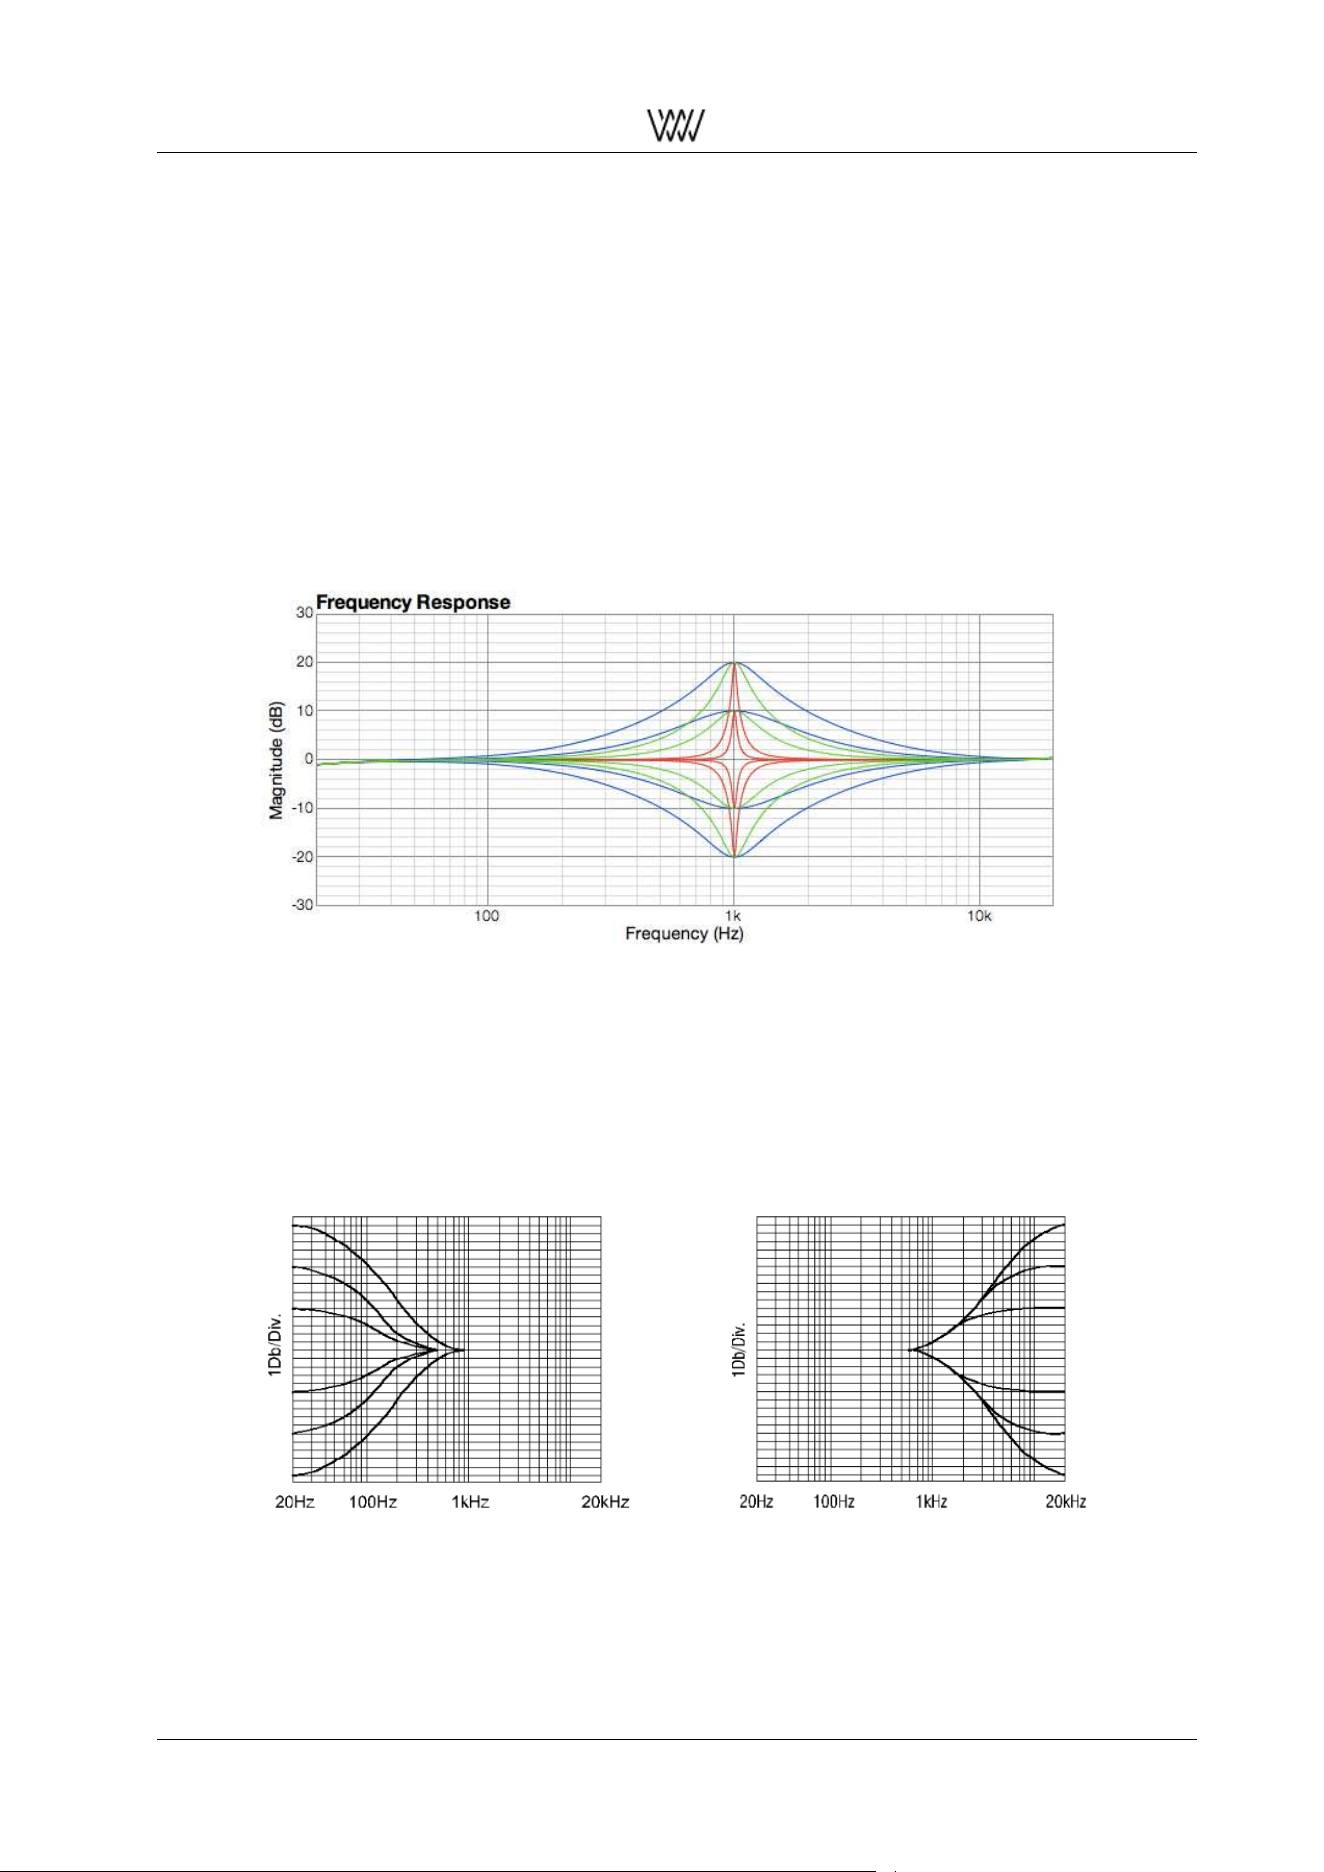
Here are a few examples of frequency responses achievable with the parametric EQ:
Figure 19: EQ peak and notch filters
The peaking filter with various settings for the Q parameter (width) and the boost/cut parameter is displayed
above. The frequency of the filter is set to 1kHz in this example.
In the graphic below you see a low shelf filter and a high shelf filter with various settings for the boost/cut
parameter.
Figure 20: Low shelf and high shelf filter
User Manual and 24 White Papers
Weiss Enginering Ltd. DAC501/DAC502
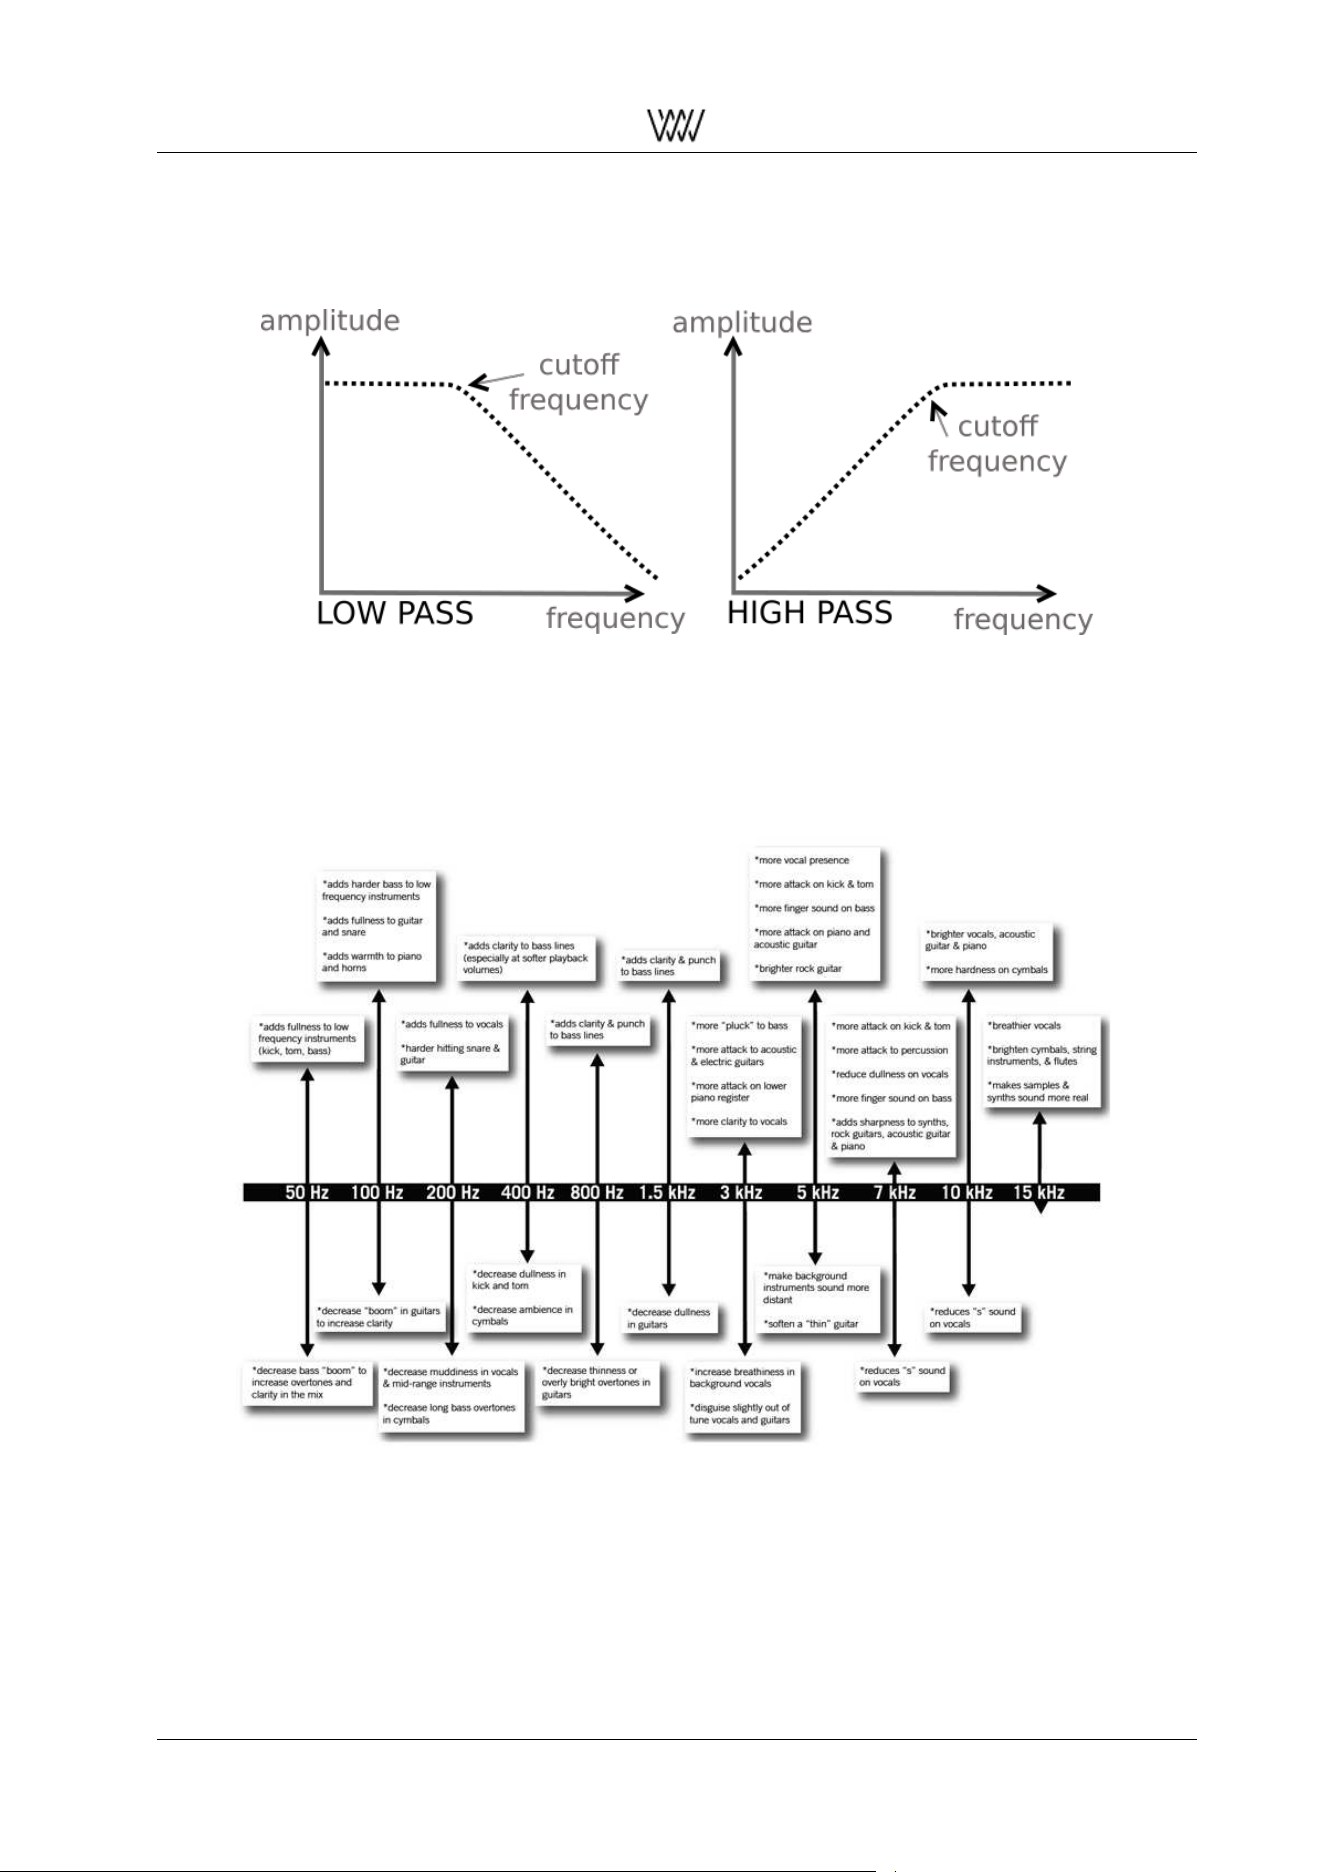
As a last filter example the high cut filter (also called low pass filter) and low cut filter (also called high pass
filter) is displayed.
Figure 21: Low pass and high pass filter scheme
To finalize this section you find an example chart that visualizes examples of frequencies for various instru-
ment treatments:
Figure 22: Instruments’ spectral treatment overview
User Manual and 25 White Papers
Weiss Enginering Ltd. DAC501/DAC502
4.2 The Weiss Room Equalizer
A room equalizer is used to change the acoustic behaviour of a listening room to some extent. Usually it is
best to first take other measures to enhance the characteristics of a room, e.g. by applying absorbers and/or
diffusors to the walls, the floor and the ceiling of a room. This plugin is not applicable on headphones.
In a residential environment such a room treatment can be difficult as one may not like to change the looks
of a room. This is where a room equalizer comes in handy. The goal is to tame the so called room modes,
which are discrete low frequencies where the room resonates.
The frequencies where modes appear depend on the geometric shape of the room.
The amroc room mode calculator tool by amcoustics allows you to enter the dimensions of a room and
calculates the potential frequencies of room modes:
• amcoustics.com/tools/amroc
The number of different room mode frequencies can be quite large - depending on the room geometry and
acoustic properties of the room. In addition the room modes which actually cause problems depend on the
positioning of the speakers, the radiation pattern of the speakers and the listening position. Thus the room
equalizer based treatment of a room can be quite complex.
One approach is to first find the potential frequencies of the room modes with the help of e.g. the website
given above. After that the room modes at those different frequencies can be excited with single frequency
tones. If the room resonance can be excited at a frequency that frequency then can be suppressed to some
extent with the room EQ.
See section 2.3.6 for instructions about how to find room modes with a slow sine wave sweep.
If a room mode is very pronounced then the room EQ can be set by listening to a music track which is suited
to excite that room mode. This would be the simplest method to set the room EQ.
Another approach is to measure the room response with the given speaker positions and listening positions.
With those measurements the necessary room EQ settings can be calculated. We are working with the
Illusonic company to license their room measuring software for the purpose of calculating the necessary
room EQ settings.
4.3 The Weiss Crosstalk Cancellation (XTC)
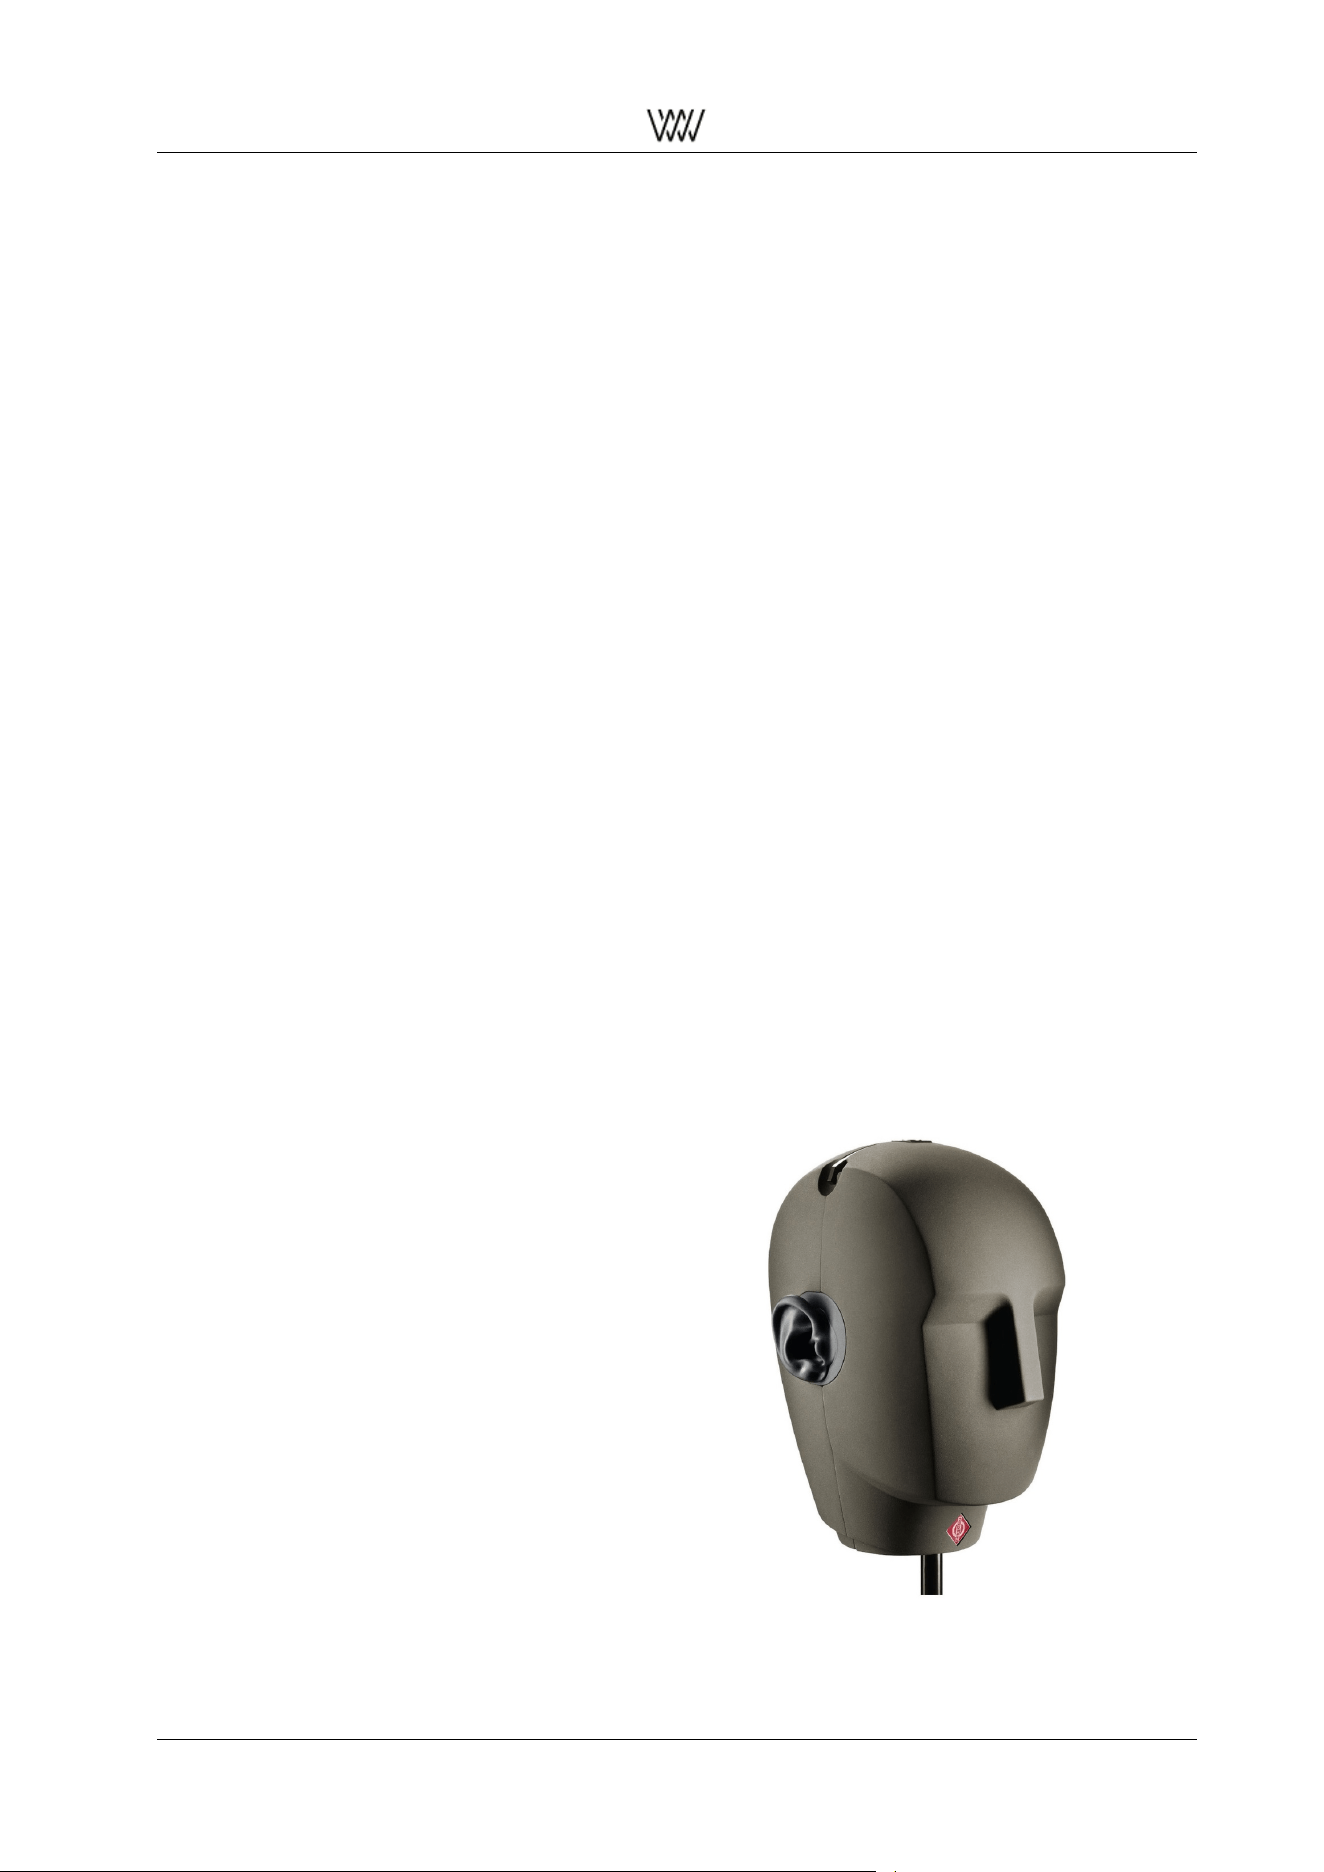
The so called binaural technology has a long history. Decades ago many live or radio drama recordings
have been made using a dummy head microphone as displayed in fig. 23. This head has microphones built
into its ears, which allow to record an event in a similar way a listener would hear it.
The idea now is to bring the two recorded
channels unchanged to the ears of a lis-
tener. The left channel shall go to the left
ear only and the right channel to the right
ear only. This means there must not be any
crosstalk from left to right or right to left.
With such a setup it is possible to repro-
duce the recorded live event with incredi-
ble realism. A headphone allows to trans-
mit the signals to the ears without any
crosstalk.
Only, the headphone based playback got
other problems, causing such a playback
of a dummy head recording often to be un-
satisfying.
If it would be possible to play back the
recording via speakers then the headphone
related problems would be gone.
Figure 23: Dummy head microphone
User Manual and 26 White Papers
Weiss Enginering Ltd. DAC501/DAC502
With speakers there are strong crosstalk components present though. Exactly this a Crosstalk Cancel-
lation (XTC) algorithm tries to suppress.
With a clever signal processing this can be achieved on an impressive level - the acoustics of the recording
venue is reproduced in a 3D manner and the musical instruments can be clearly located on a 3D stage. But
even studio recordings can be enhanced with an XTC based playback system.
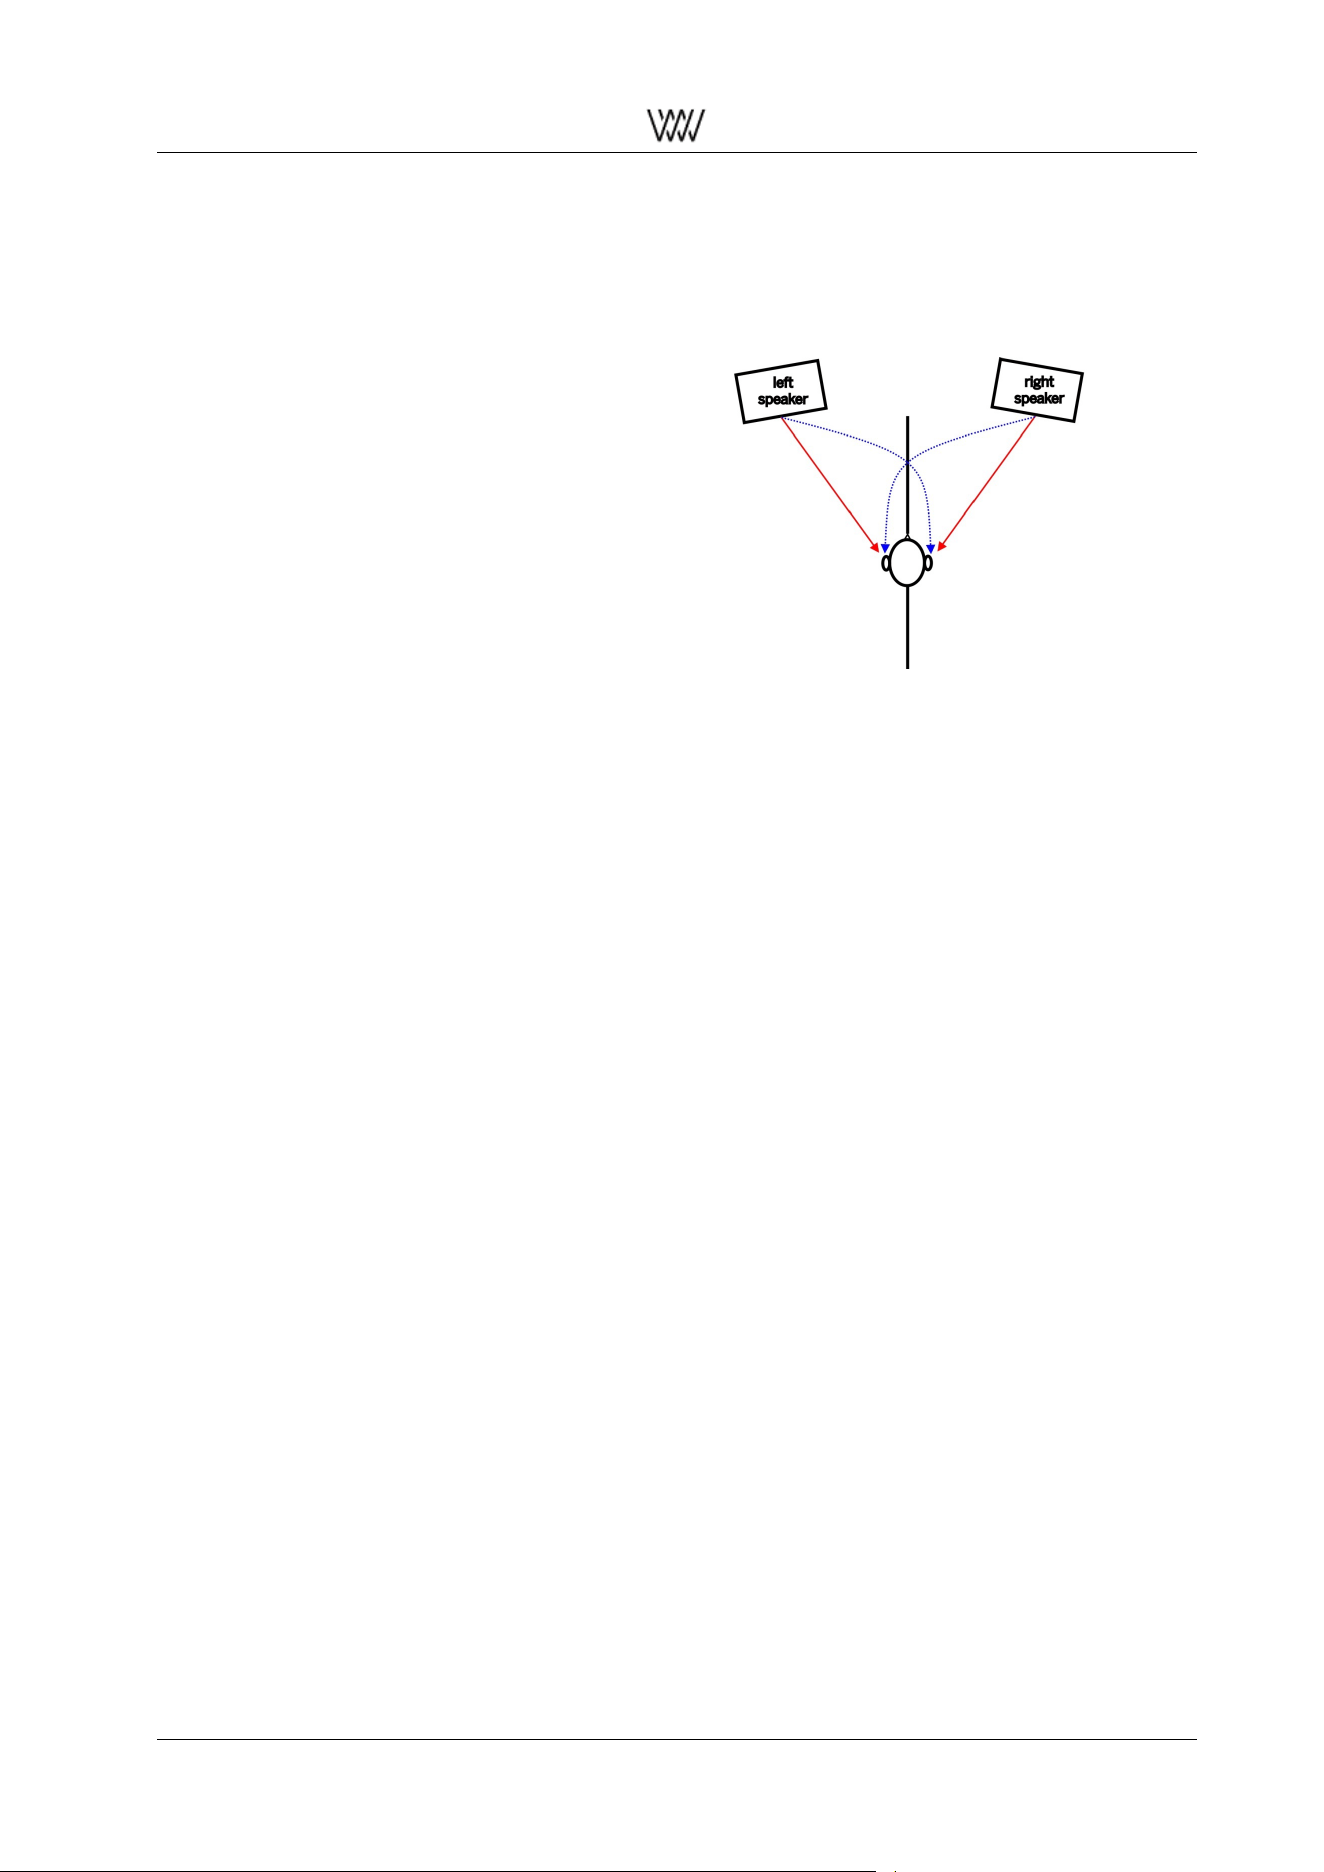
In the figure on the right an XTC listening
setup is displayed as a scheme.
The red arrows in the picture indicate
the wanted audio signals, while the blue
arrows indicate the crosstalk signals which
are suppressed.
It is essential to sit in the middle between
the speakers such that the setup is com-
pletely symmetrical as indicated in the
figure.
The listening angle should not be 60
degrees as with a standard stereo setup,
but should be more like 20 degree or less.
This helps the XTC impression a lot.
Figure 24: XTC scheme
With the DAC501/DAC502 units it is possible to enter the geometries of the setup. The XTC algorithm then
is adjusted to the setup at hand. This plugin is not applicable on headphones.
The main impressions you will get with the XTC based playback are:
• Large stereo stage, much wider than the space between the speakers
• A feeling of depth, i.e. a 3-D like presentation
• Very realistic playback of the acoustic space at the recording venue
• The instruments are clearly located on the stage
The XTC based playback is suited for:
• Dummy head recordings (with the most realistic presentation)
• Live recordings (with an impressive rendering of the acoustic space and the crowd at the place)
• Standard stereo studio recordings
• A mono recording will stay a mono recording. There won’t be any ”stereo-ization”.
4.4 The Weiss Vinyl Emulator
The playback quality of vinyl records often times is viewed as being superior to digital based playback. The
technical quality of a vinyl reproduction usually is inferior to a decent digital playback, though.
Obviously many listeners like the specific deteriorations the vinyl playback chain applies to the music.
The playback system in a record player is a fairly complex mechanical system with many variables contribut-
ing to the sound. If one likes to emulate such a system in the digital domain the most important mechanisms
have to be analysed and emulated.
Some of the sub-systems and parameters involved are:
• motor driving the platter
• needle geometry
• groove geometry
User Manual and 27 White Papers
Weiss Enginering Ltd. DAC501/DAC502
• playback speed
• position of the tonearm
• masses, rigidity of the various mechanical parts (pick-up, tonearm, bearings, ... )
• mechanical to electrical transfer function of the pick-up
• angles of the needle relative to the record
• contact pressure of the needle
• skating effect
One approach to emulate the sonic footprint of a record player would be to simulate all those mechani-
cal/electrical parts one by one for a complete transfer function.
While this is possible to some extent it is fairly complex to implement and also to measure the parts such
that their influences are gained isolated from all other effects.
It is simpler and more effective to synthesize the various effects caused by those sub-systems.
These effects are, mainly:
• specific frequency response
• specific distortion patterns
• specific additional resonance frequencies
• specific noise at various frequencies
• specific crosstalk between left and right channels
• specific effects caused by the RIAA emphasis
• specific amplitude modulation effects
The key to a good emulation is to achieve the ”right” amounts and characteristics and sequence of all those
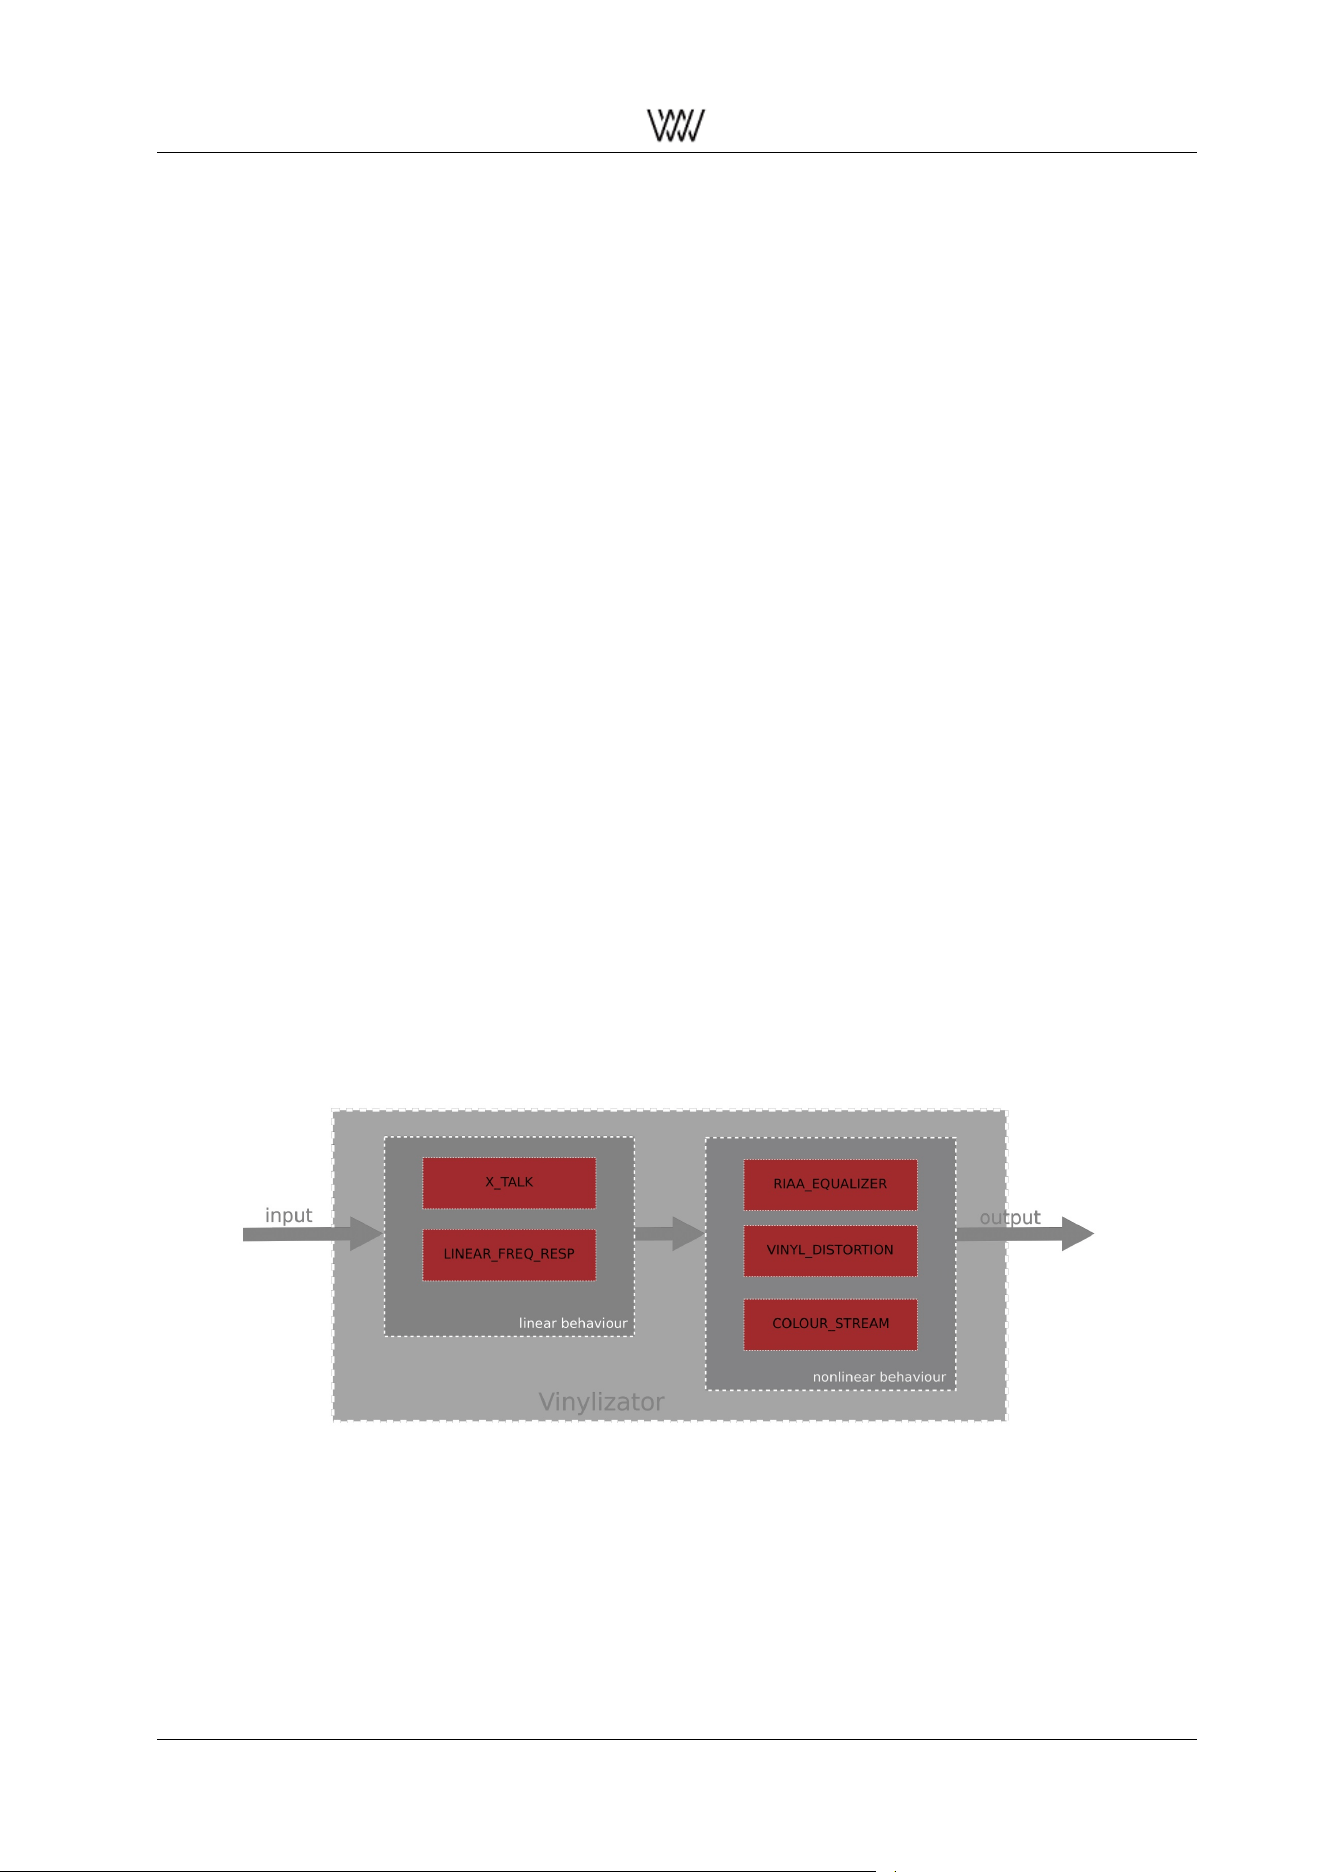
effects. Hence the word ”specific”. In the DAC501/DAC502 we implemented a processing chain for the vinyl
emulation like this:
Figure 25: Block diagramm of the Weiss Vinyl Emulator
The blocks are self - explanatory, except COLOUR_STREAM, which consists of noise generators, reso-
nance generators and amplitude modulator.
Of course there are many parameters involved in all those processing blocks. For the DAC501/DAC502 our
goal was to have a single parameter to control the amount of ”vinylization”.
That single parameter influences several of the processing block parameters at once. It leads to a very
effective and useful implementation with an astonishingly good sounding vinyl footprint.
User Manual and 28 White Papers

Weiss Enginering Ltd. DAC501/DAC502
4.5 Digital level control and Dithering
Digital Level Control – done the right way. With sound examples.
In high-end HiFi circles a level control done in the digital domain is often viewed as being inferior to one
operating in the analog domain. Let’s look on how a digital level control works and why it can be an excellent
solution if it is properly implemented.
A level control is a multiplication of the audio signal with a constant, the ”gain factor”. The gain factor usually
is in the range of zero (signal fully off ) to one (signal untouched).
A factor of 0.5 then means that the audio signal is attenuated to half of its amplitude. What exactly happens
when we multiply two numbers?
If we e.g. multiply a 2 digit and a 3 digit number, the resulting number can be up to 5 digits long (the sum 2
plus 3). As an example: 30 times 500 equals 15000. 2 digits times 3 digits yields a 5 digit result.
In digital audio, the numbers are represented in the binary system, not the decimal system. A decimal
number consists of digits 0 through 9, a binary number of digits 0 and 1.
So a binary number may look like this:
1011 0011 0101 1101
This is a 16 digit or 16 bit binary number, the grouping into 4 bit chunks is for better readability. The audio
samples on a CD are represented with such a binary number system with each sample value represented
with 16 bits.
Now let’s assume we have an 8 bit gain factor for a level control. If we apply that to a signal coming from a
CD we multiply an 8 bit gain factor with a 16 bit sample value. The result is up to 24 bits long (the sum of
the word-lengths of the two factors).
An example:
0100 1001 x 1001 0110 0111 1011 = 0010 1010 1110 1001 0001 0011
The question now is what do we do with the 24 bit long result? The digital to analog converter which converts
the samples after the level control may only be capable to handle 16 bit wide samples. Thus what should
we do with the excessive 8 bits? The simplest solution is to truncate the 24 sample to 16 bits, i.e. to cut off
the 8 less significant bits. The truncated 24 bit result above then would look like this:
0010 1010 1110 1001
i.e. the first 16 bits of the 24 bit result above. The remaining bits
0001 0011
are discarded. If these bits are discarded, an error is introduced. This error is called a quantization error,
because the 24 bit result is requantized to 16 bits.
Unfortunately the quantization error is part of the audio signal – and if we take that part away from the signal,
the signal undergoes some distortion, the so called quantization distortion.
The sound example at the link below shows how such a distortion sounds. In this music example a 16
bit signal is truncated to 8 bits. 8 bits in order to clearly show the effect. Notice how the noise (distortion) is
modulated by the music signal.
• https://www.weiss.ch/linked/digital-level-control/nodither.mp3
This is how a badly implemented digital level control works....
Fortunately there is a better way to handle the re-quantizing. One solution would be to use a D/A converter
with a higher word-length, e.g. a 24 bit converter, to accommodate for the 24 bit samples coming out of the
level control. This of course would already help a lot, but there is another technique: dithering.
The idea about dithering is to de-correlate the quantization error from the audio signal. As we have seen in
the example above, the quantization error depends on the audio signal, i.e. it is correlated with the audio
signal. On the other hand, if dither noise is added to the 24 bit sample after the level control and before
the re-quantization to 16 bits, the quantization error can be fully de-correlated from the signal. This means
User Manual and 29 White Papers
Weiss Enginering Ltd. DAC501/DAC502
instead of distortion there is noise. The music is undistorted. The audio example at the link below is again
a 16 bit signal quantized to 8 bits, but with dither noise added. A much more pleasant experience. Notice
how the noise stays untouched by the music, i.e. there is no noise modulation.
• https://www.weiss.ch/linked/digital-level-control/flatdither.mp3
Dithering does not stop there. More elaborate dithering schemes shape the noise such that it is mainly
present at higher frequencies where the human ear is less sensitive. This means that the audible noise
is much lower. The link below is again the 16 bit source quantized to 8 bits with noise-shaped dithering.
Probably hard to believe that this is only an 8 bit system! Note that the music is not distorted at all, despite
the 8 bit resolution.
Remember, a 16 bit system has 65,536 quantization steps while a 8 bit system has only 256 quantization
steps – a huge difference. And still, the properly dithered 8 bit system sounds great.
• https://www.weiss.ch/linked/digital-level-control/shapeddither.mp3
This is what a properly dithered level control is capable to do. You have heard the 8 bit version, imagine
that with today’s 24 bit converters – no question that a level control with a 24 bit word-length easily rivals
the best analog level controls. By the way, 24 bits means 16,777,216 quantization steps.
The last example below toggles the noiseshaping dither on and off to give a good contrast between dither/no
dither versions.
• https://www.weiss.ch/linked/digital-level-control/togglingdither.mp3
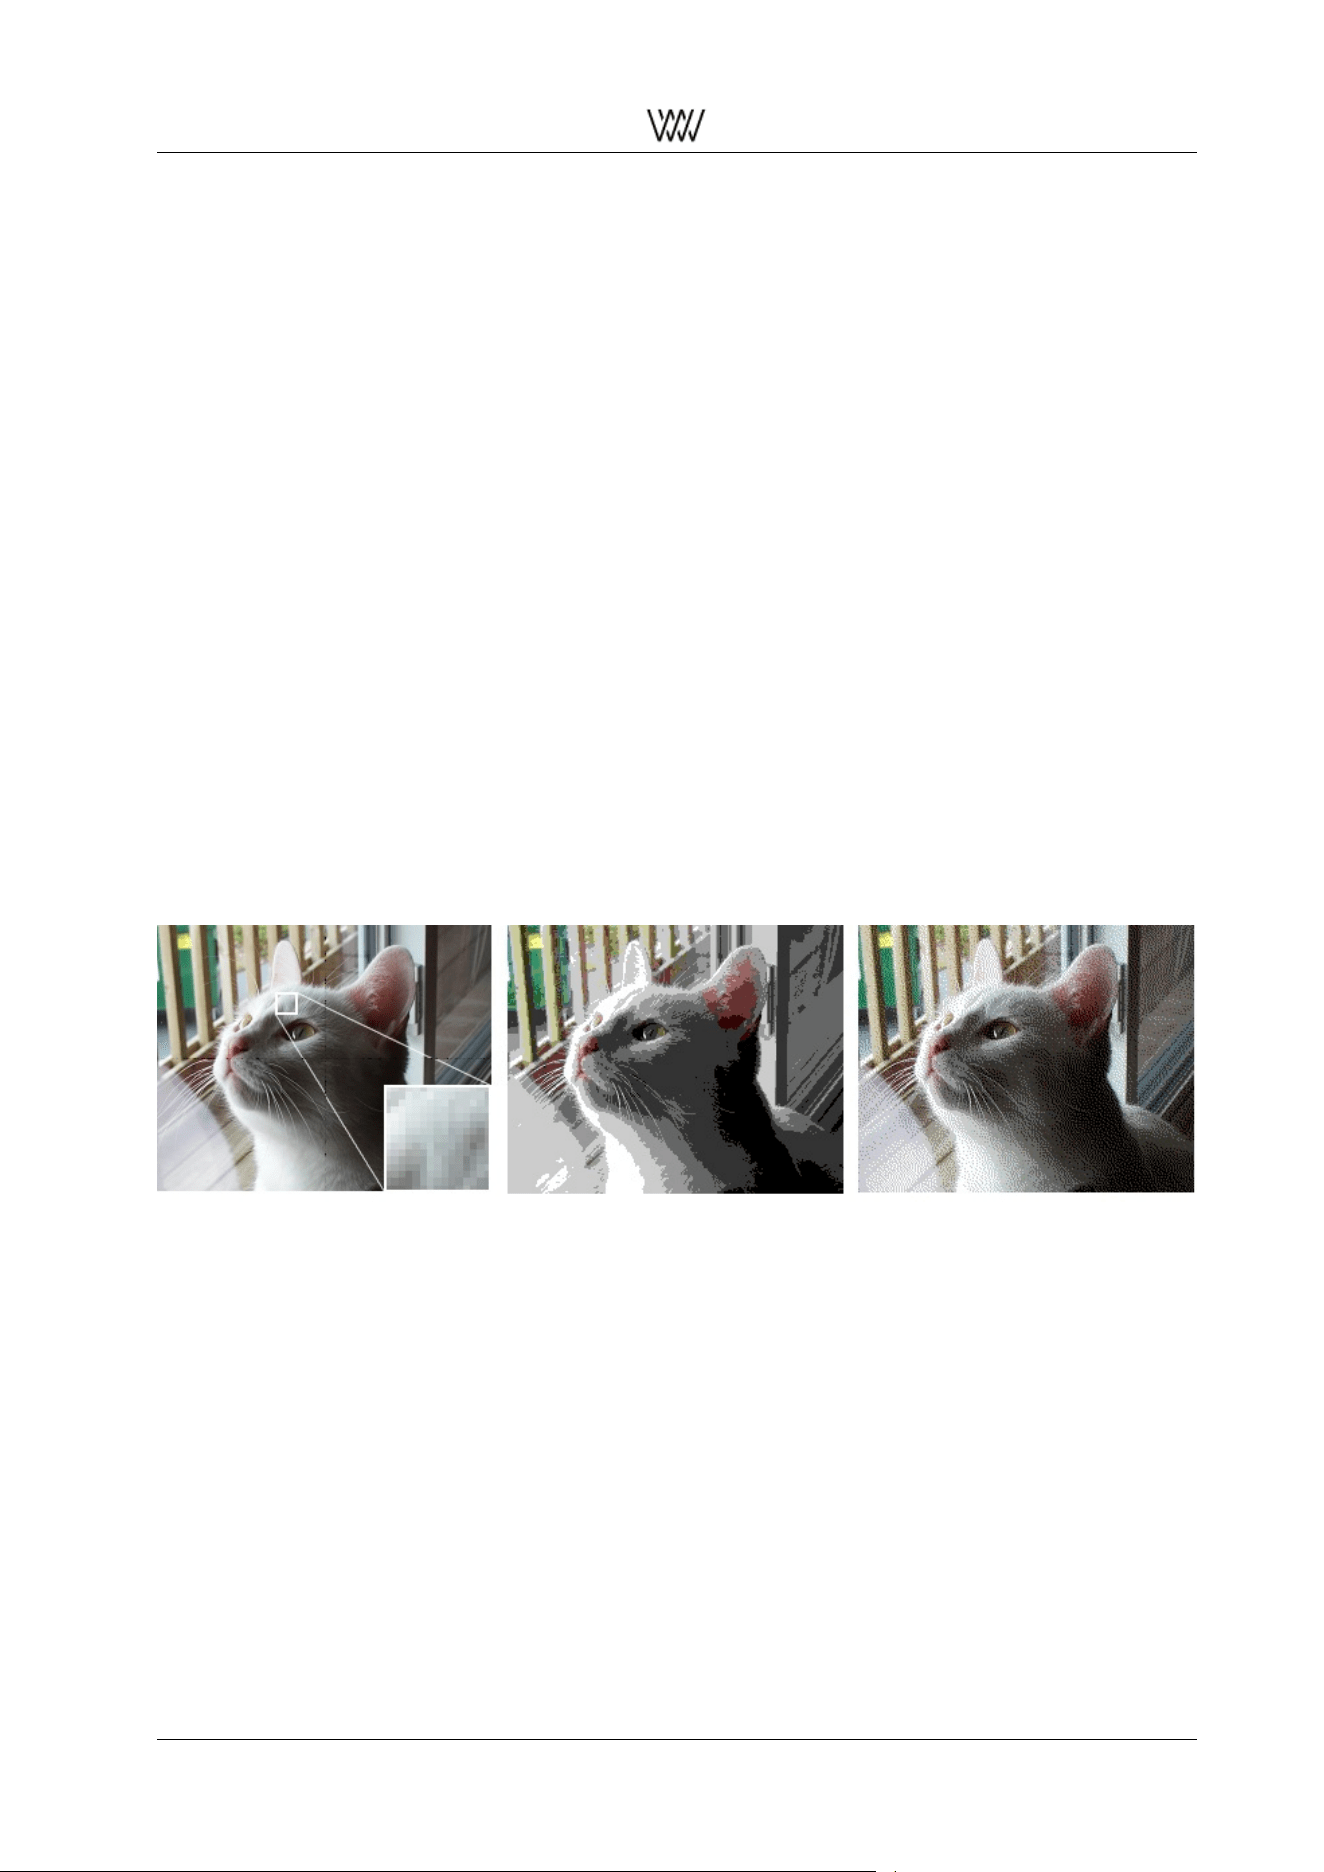
Dithering is used in many disciplines. Fig. 26 demonstrates dithering applied to quantized picture data.
Figure 26: Image processing: original (left), quantized without dithering (middle), quantized with dithering
(right)
4.6 The Weiss Dynamics Adaption
Nowadays we often have to face the issue that every piece of music can have it’s own loudness impression
- or it could be preferable to have less dynamics in the playback of a desired play list.
To make you able to control the dynamics of your music in such kind of circumstances we developed the
Dynamics Adaption plugin to overcome these problems. Shortly the aim of this algorithm is to avoid big
loudness changes or with other words make the user be able to reduce the dynamic range of the played
audio. Of course how invasive this controlling should be depends on the taste of the user - so we let you
decide by choosing the Dynamic Level.
In the following the algorithm, the parameter Dynamic Level and the recommended use of the Dynamics
Adaptions will be explained.
User Manual and 30 White Papers
Weiss Enginering Ltd. DAC501/DAC502
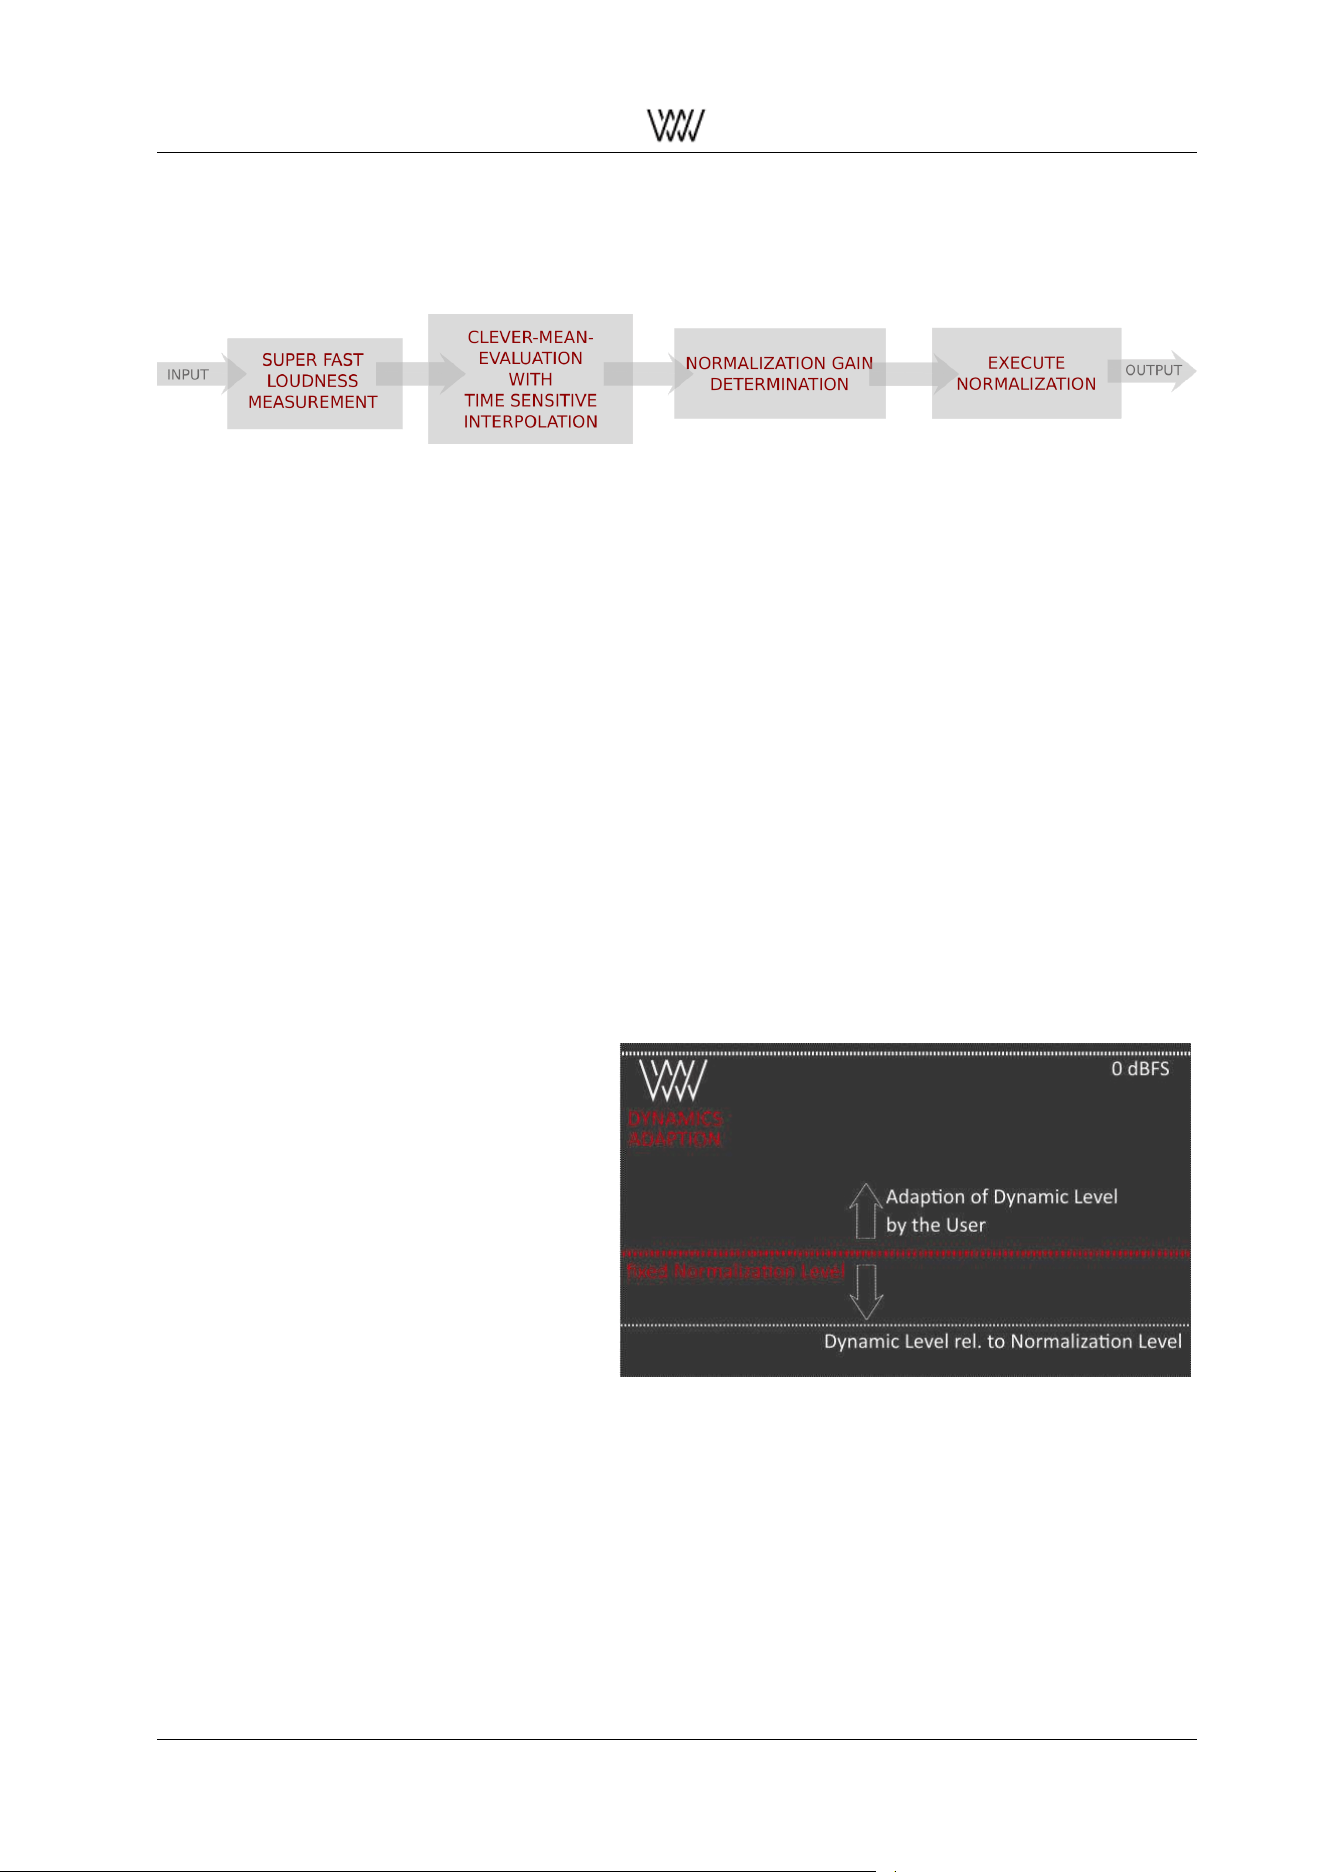
Outline of the algorithm
In the figure below the main functionality of the Weiss Loudness Normalization is outlined. The algorithm is
displayed as a simplified block diagram. It consists of four main processing blocks.
Figure 27: Block diagram of the Weiss Loudness Normalization
The first block Loudness Measurement uses a special procedure to evaluate the loudness envelope of the
signal within a very short time period. The characteristics of the human hearing-system are of course in-
cluded in this loudness measurement regarding the Recommendation BS1770 by the International Telecom-
munication Union.
With several signal processing tools this measurement will be adapted to become qualified for the use of
the normalization. In this way it is possible to create a very fast normalization but also save the important
dynamic content of the audio information to make the manipulation not disturbing.
The second block Clever-Mean-Evaluation with Time Sensitive Interpolation is the biggest part of the algo-
rithm. This block contains most of the sundry preparing steps to make the measured loudness envelope
suited to be used in the third block. Here the Normalization Gain is determined. Of course a special kind of
noise gating is used in this block. And finally the last block performs the adaptation of the audio signal to
create an output with constant loudness.
Level Definitions
By adjusting the Dynamic Level you can justify how intense the normalization should effect the audio signal.
To be able to use the plugin properly it is helpful to understand how the levels of the plugin effect the audio
signal. There are two main levels: the Dynamic Level and the Normalization Level. In the graphic on the
right the Normalization Level and the Dynamic Level are displayed.
The Normalization Level is fixed and is
used to ensure a proper overall maximum
output level.
If you change the Dynamic Level you
change the dynamic content of the audio.
So if you like to have more dynamics left
in your playback use a positive Dynamic
Level. The higher this level is the more
dynamic content is left in the output. The
lower (negative) this level is the less dy-
namics are left. More and more quite parts
of the original audio are amplified. More
and more loudness peaks are normalized.
Figure 28: Visualization of relation between dynamic level
and normalization level
All in all the whole playback becomes naturally louder when the Dynamic level is very low. Besides it is
important to emphasize that the effect of the Dynamics Adaption is depending on the musical content of the
actual playback. Some kinds of music have a very wide range of dynamics like a recording of an orchestra.
Other pieces are already very compressed concerning their dynamic range.
So it is clear that the effect of the Dynamics Adaption will sound different for different kinds of music. Also
the velocity of the loudness changes has an effect on the dynamic. And additionally the spectral content of
the music also effects how the output will sound in the end.
This illustrates the big challenge of a good sounding and fully automatic control of the dynamic range.
User Manual and 31 White Papers
Weiss Enginering Ltd. DAC501/DAC502
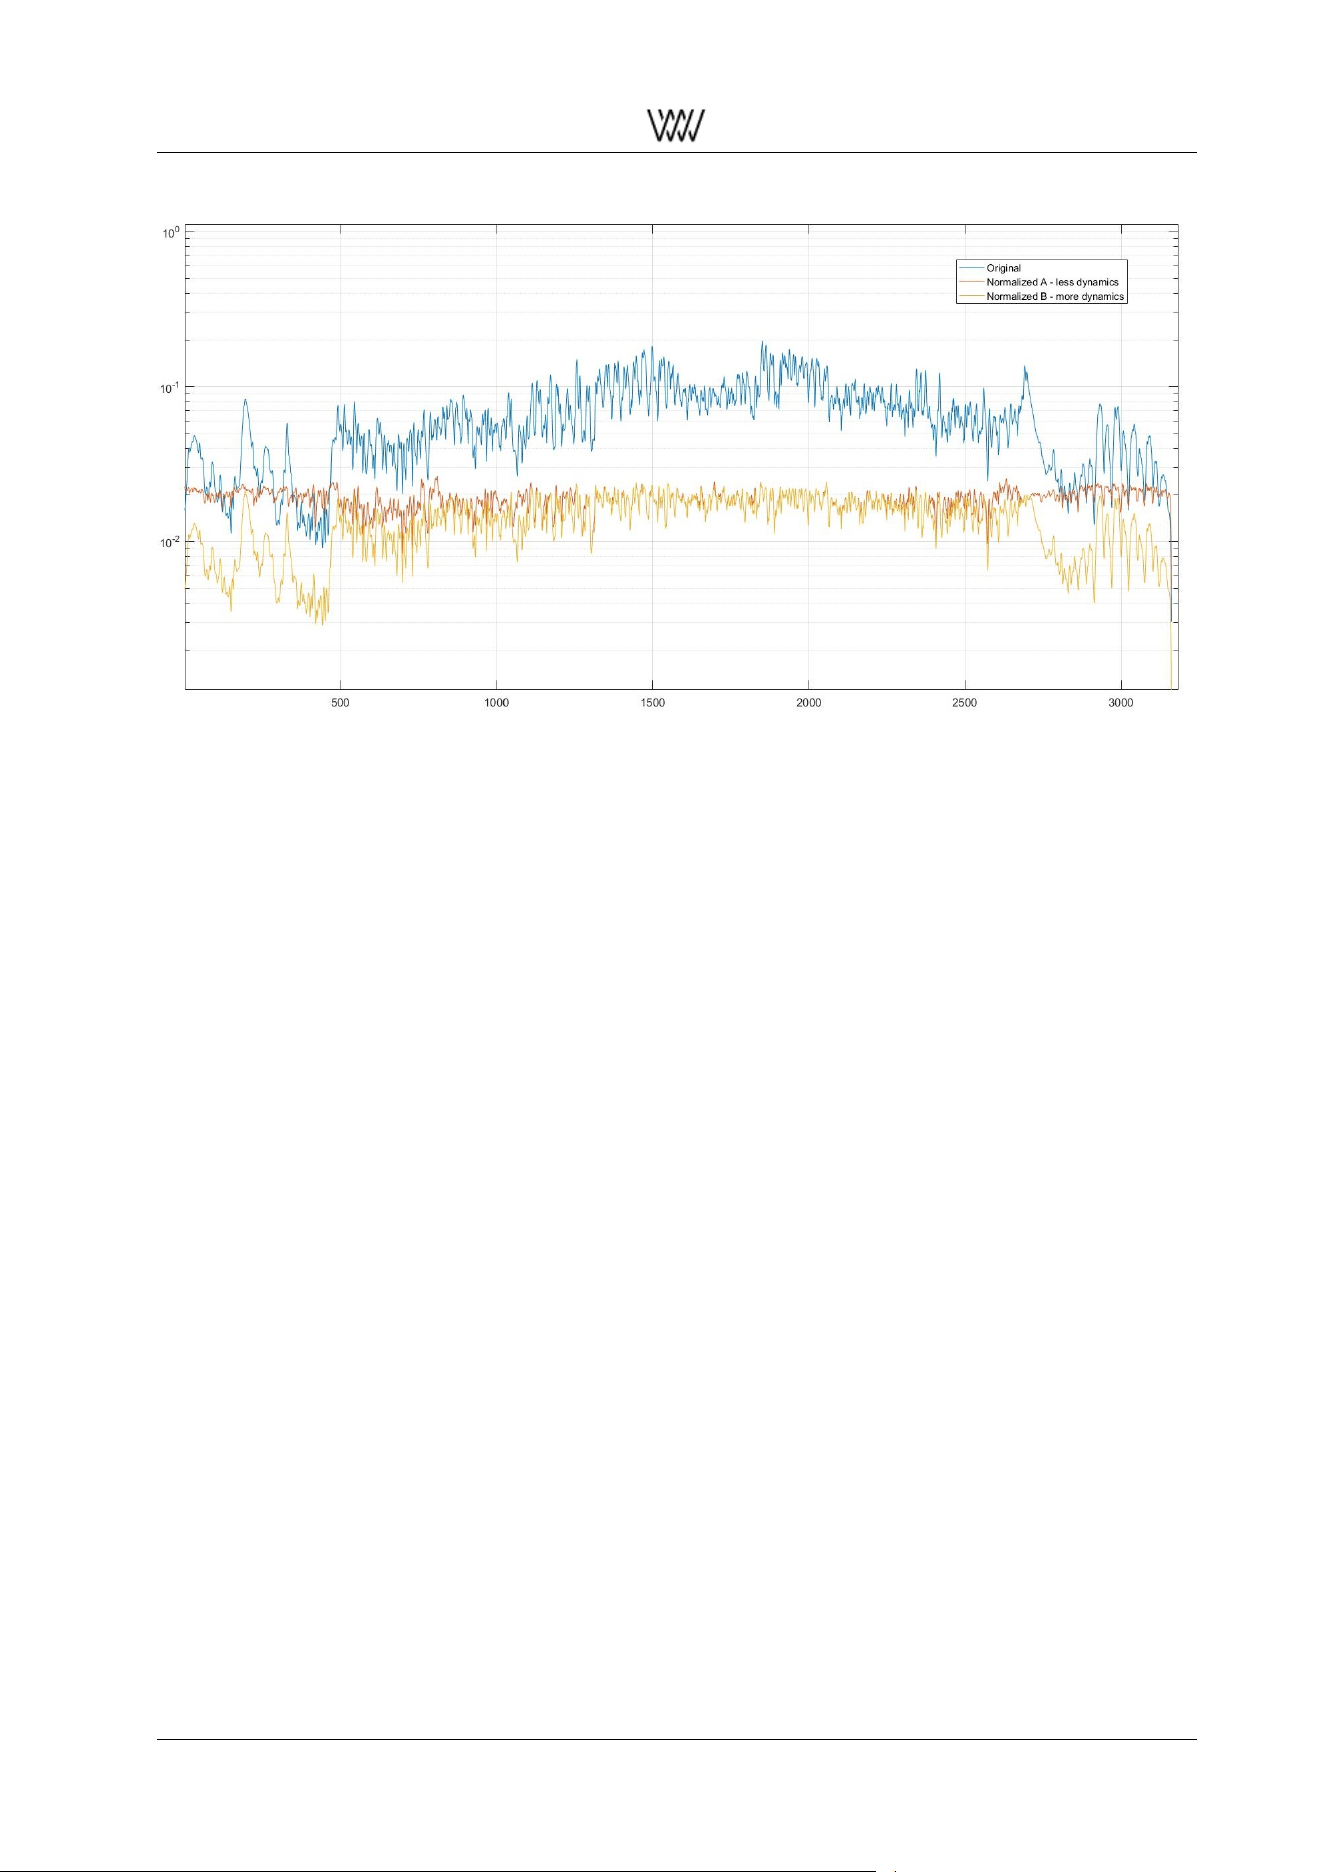
Figure 29: Comparing different settings of the Dynamic Level, (Pink Floyd, Wish You Were Here, live)
As last part of this section we want to show you a nice picture to support the understanding of the function-
ality of the Dynamics Adaption.
In the figure above you can see three different loudness measurements, displaying the piece of music ”Wish
You Were Here” by Pink Floyd live. The blue curve shows the loudness of the original audio signal. The
curves in yellow and red are normalized ones. The yellow one still contains a lot of the dynamic content
of the original. In contrast the dynamic content of the red curve is very limited and the loudness is nearly
constant.
The maximum loudness level for both normalized curves is the same. In this figure you can see especially at
the beginning and at the end the difference of the dynamic content of the two normalized signals. Besides
you can see that the dynamic content of the output of the Dynamics Adaption is level depending. When
adjusting the Dynamic Level you should keep this level dependencies concerning your play list in mind.
So for example if you want to avoid annoying loudness peaks in your playback but still desire to keep most
of the dynamics choose a Dynamic Level in the range between 0dB and higher. If you have a lot of different
recordings with a wide range of loudness levels choose a lower and if needed negative Dynamic Level. The
lower this level is the more the dynamic content is limited. The value 0dB is our default setting and should
be like the golden middle between the different sound capability of the plugin. We recommend you to start
with this default setting. Be careful with very low Dynamic Level settings for some recordings the adaption
can sound unnatural.
4.7 The Weiss De-Esser
The sound of sharpness is a natural part of singing vocals - especially when singing S or T consonants. In
fact it is a necessary characteristic of such consonants and helps the human ear to identify them. Beyond
vocals a lot musical instruments contain sharpness within their characteristic sound. For example the Hi-
Hats of a drum set would be hard to recognize without any sound of sharpness.
The science of psychoacoustics describes sharpness as a special timbre. Sounds with sharpness can be
distinguished by taking a look at their frequency characteristics. The main part of the signal energy is in the
high frequency range. Nevertheless it can happen, that certain high frequencies are too dominant and the
sharpness of the sound becomes very displeasing or even harmful for human ears.
This can occur under diverse circumstances. For example inapt conditions of a playback room can em-
phasize sounds with high sharpness. But also during recording or mastering a boost of sharpness can be
added to the music.
User Manual and 32 White Papers
Weiss Enginering Ltd. DAC501/DAC502
To give you the possibility to reduce such displeasing sounds of too high sharpness we developed the auto-
matic Weiss De-Esser. Moreover you are able to choose between two different De-Esser modes and how
much of the overall sharpness should be kept. So with the Weiss De-Esser you are able to create your
individual desired sound regarding the sharpness of the playback.
The characteristic of sharpness of a S also explains the origin of the name De-Esser - whose purpose is
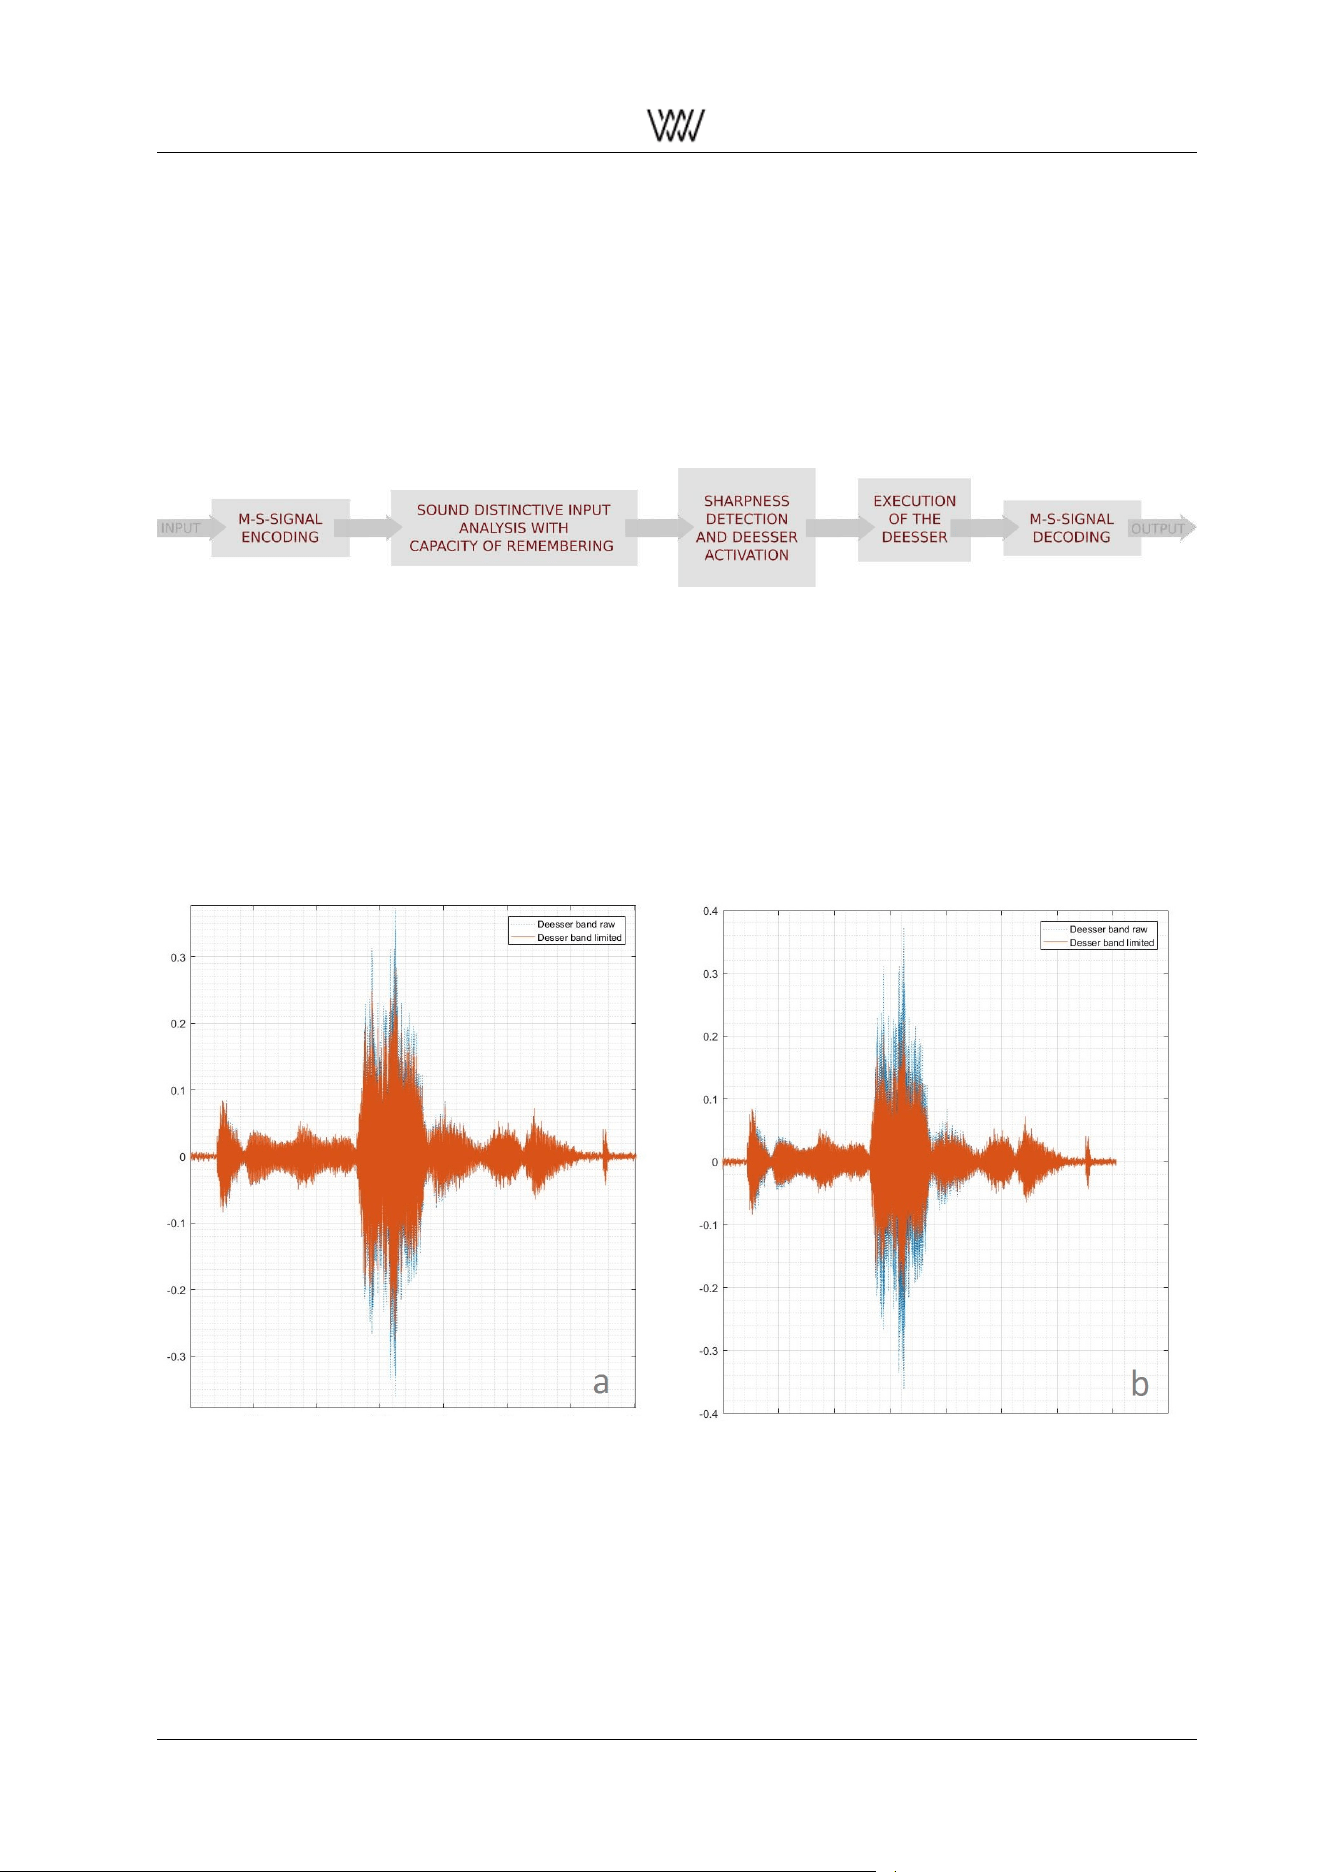
limiting S sounds or in general limiting sounds with sharpness. Below you can see a block diagram of the
algorithm of the Weiss De-Esser. There are four main parts of the algorithm which will be introduced in the
following.
Figure 30: Block diagramm of the Weiss De-Esser plugin
Sounds with high sharpness are concentrated in the mid-signal of the audio information. So the Weiss De-
Esser only processes the mid-signal and lets the side-signal untouched.
This idea is based on the so called m/s-stereophony. Which is a coding process that transforms the signals
of the left and right into a different representation. The mid-signal is the sum of the left and right channel.
As opposed to this is the side-signal the difference of them. For realizing this idea a m/s-encoding and
decoding is integrated at the beginning and the ending of the De-Esser chain.
Figure 31: Comparing different settings of the De-Esser user parameter: a) original; b) Amount -12 dB.
The second block performs a sound distinctive analysis. This block enables the De-Esser to recognize cer-
tain transformations of the signals frequency content which are important for limiting high sharpness. The
measurements of this analysis are super fast like in the section of the Weiss dynamics adoption described.
But still the overall picture is captured to factor the slow changing behaviour of the audio into the evaluation.
This is warranted by implementing a capacity of remembering into this block.
The knowledge generated by the second block is then used in the third block. Here the decision whether
User Manual and 33 White Papers
Weiss Enginering Ltd. DAC501/DAC502
to activate the De-Esser or not is made. This decision is based on the evaluation of the current frequency
content - the sharpness detection - the result indicates how high the sharpness of the audio is. If the sharp-
ness exceeds certain limits the De-Esser is activated.
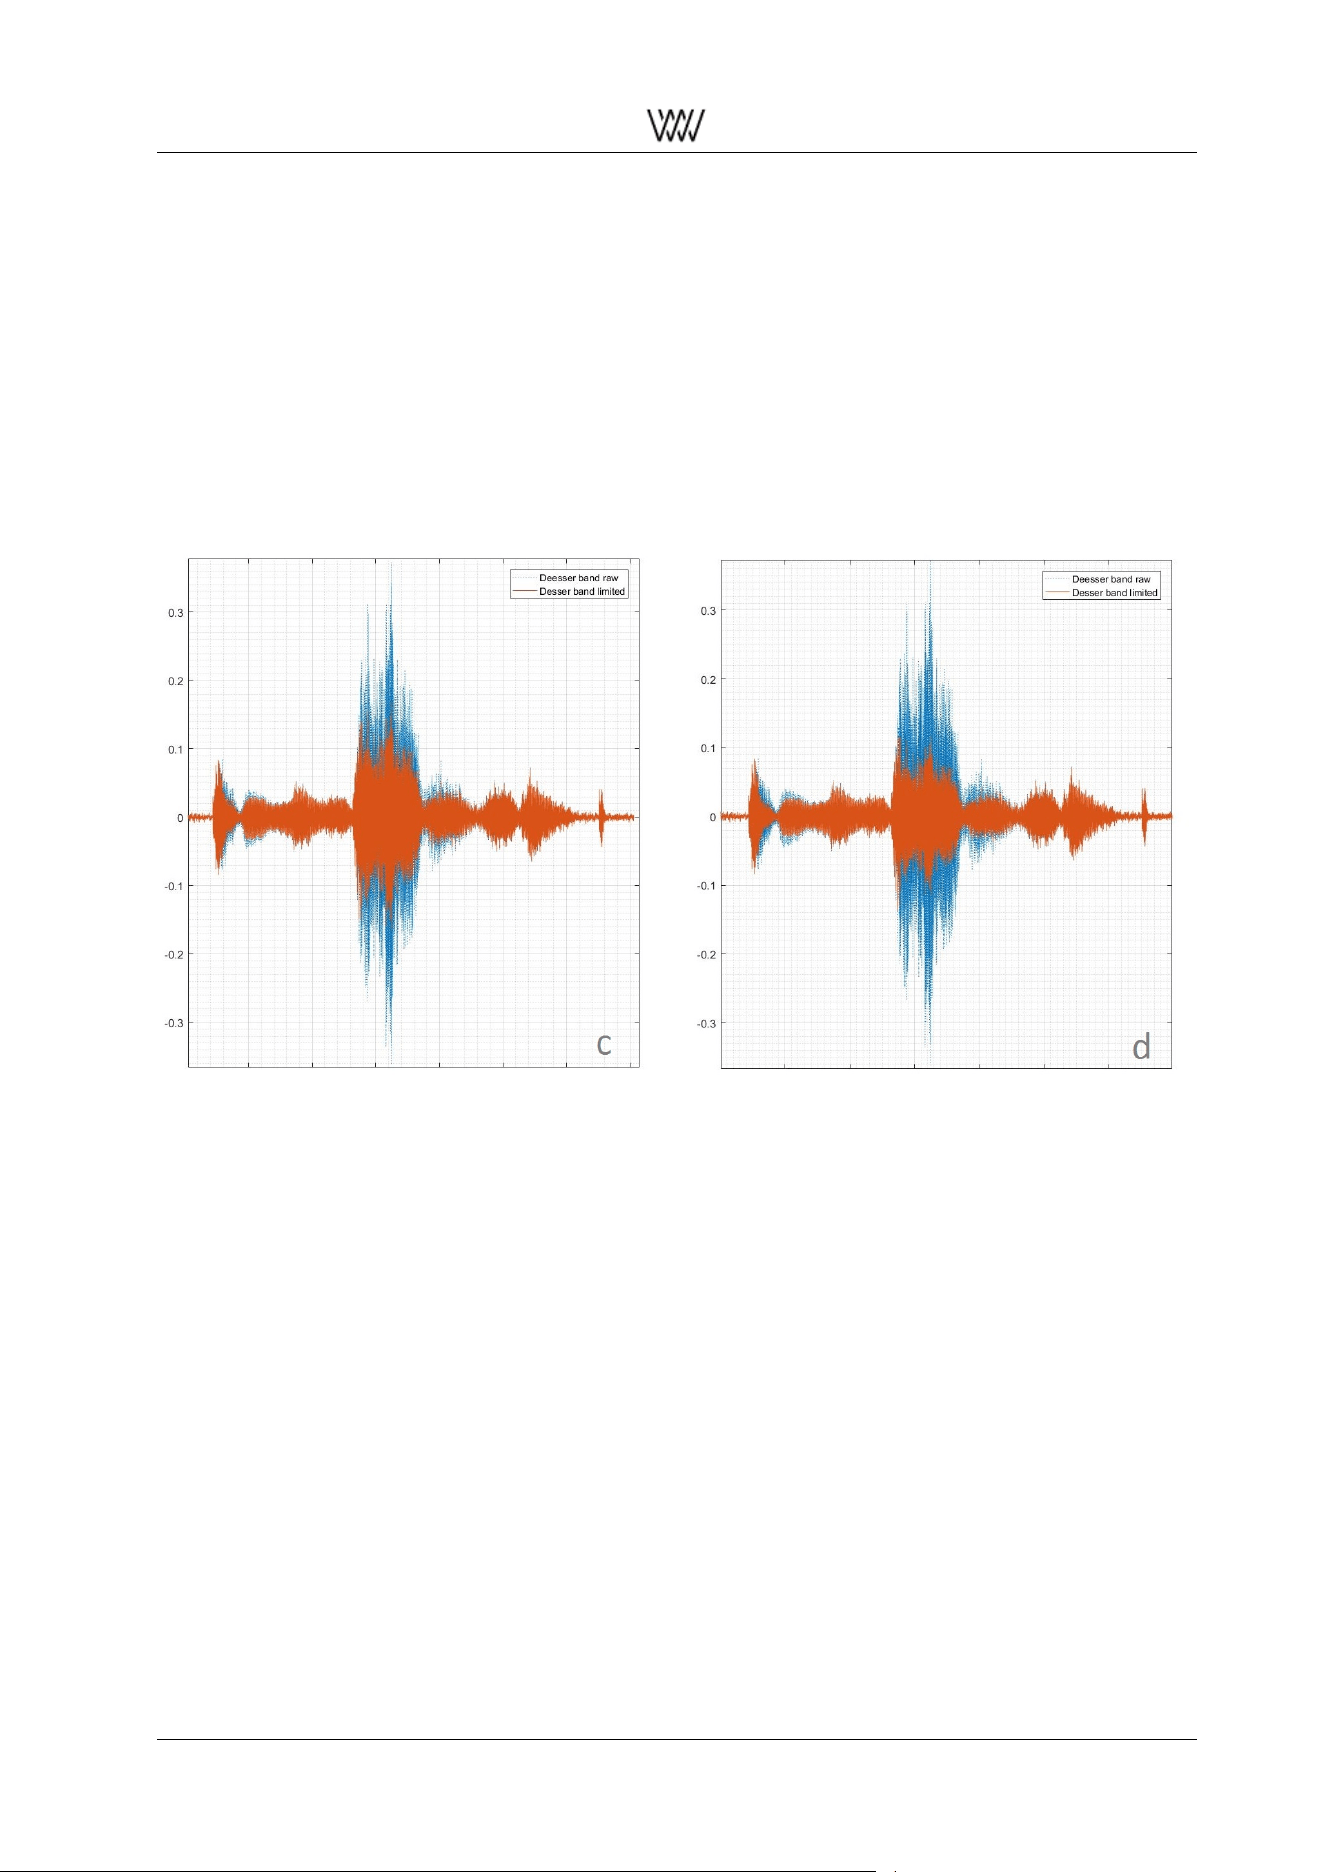
For the execution of the De-Esser a proper De-Esser gain is needed. The shape of this gain is calculated in
order to match the critical high frequencies of the current signal. This takes place in the fourth block. Here
the certain gain is applied to the De-Esser band. This De-Esser band is the part of the mid-signal which
contains the frequency range that causes the critical sharpness.
Finally the decoding of the m/s-signal can be performed and the deessed output stream can be received.
So the presented algorithm of the automatic Weiss De-Esser analyses the incoming information very fast
to realize short delays and concurrently uses its ability to take decisions with care based on its knowledge
generation about the long-term behaviour of the audio stream.
Figure 32: Comparing different settings of the De-Esser user parameter: c) Amount 0 dB; b) Amount 9 dB.
As mentioned above you have the possibility to create your own desired sound of the Weiss De-Esser. The
plugin provides two different De-Esser modes - Surgical and Smooth. Besides you can define the Amount
of the chosen De-Essing effect.
Independently a special normalization is performed to create a result that is individually matched with the
current sound of the music. This is needed on the one hand for the automatic detection of sharpness and
ensures the ability of the algorithm to adapt its behaviour to the current musical content. On the other hand
it is needed to define the maximal setting of the De-Esser gain which is computed in relation to the actual
audio stream. So with the choice of the Amount you can choose how strong the influence of the De-Esser
should be. But the determination of the maximal possible influence is performed autonomous by the De-
Esser to prevent over deessing which would sound dull or like lisping.
Different settings of this parameter are visualized in the second and third picture of this section. Here you
see how the influence of the user parameter Amount is increased. Starting at picture (a), which shows a
setting with low influence, till (d), which shows the maximal setting of the influence for this particular exam-
ple. Besides these pictures show the signal of the De-Esser band. This band only contains the part of the
music that could include sharpness. The example of the pictures is the S of the word myself of the song
”Rainy Days and Mondays” by Susan Wong.
In addition to the parameter Amount you can choose between the two modes - Surgical and Smooth. The
Surgical mode has a very precise behaviour with focus on the current changes of the high frequency con-
User Manual and 34 White Papers
Weiss Enginering Ltd. DAC501/DAC502
tent. Moreover the effect of the Surgical mode compared to the Smooth mode is very narrow to match the
range of the critical sharpness. In contrary the mode Smooth is more soft and observantly about the overall
context and long-term behaviour of the music.
We chose these two modes to provide you with a De-Esser plugin for several desired benefits. For example,
if you want to get rid of certain critical sharp sounds, the mode Surgical is preferential. Because the focus
of the mode Surgical is on fast changing events and it processes merciless when sharpness is detected.
If you want a more general diminution of the high frequency content the mode Smooth is the proper choice.
For example if you are listening with headphones the mode Smooth can enhance your listening experience.
But it is also well suited when listening with loudspeakers, if you like to have a more mellow sound of the
high frequency content. The interaction of the mode Smooth with the music could be described as more
merciful than the Surgical mode, but less strict when sharpness is detected.
For defining your favourite De-Esser settings it is important to keep in mind that the De-Esser will respond
different to different types of music. So maybe you find a setting of the De-Esser matching your favourite
Rock music album. It can happen that you will prefer a different setting for your favourite piano recordings.
This is a natural consequence of how the De-Esser works. It processes based on the dynamics of the music
and these of course sound different for different kinds of music.
So we encourage you to first play with the Weiss De-Esser to get a feeling of how the different modes
sound. For the parameter Amount a good starting point could be around -6dB. Futhermore in the beginning
it is more easy for getting to know the sound of the De-Esser and finding your own desired setting, if only
the De-Esser plugin is enabled.
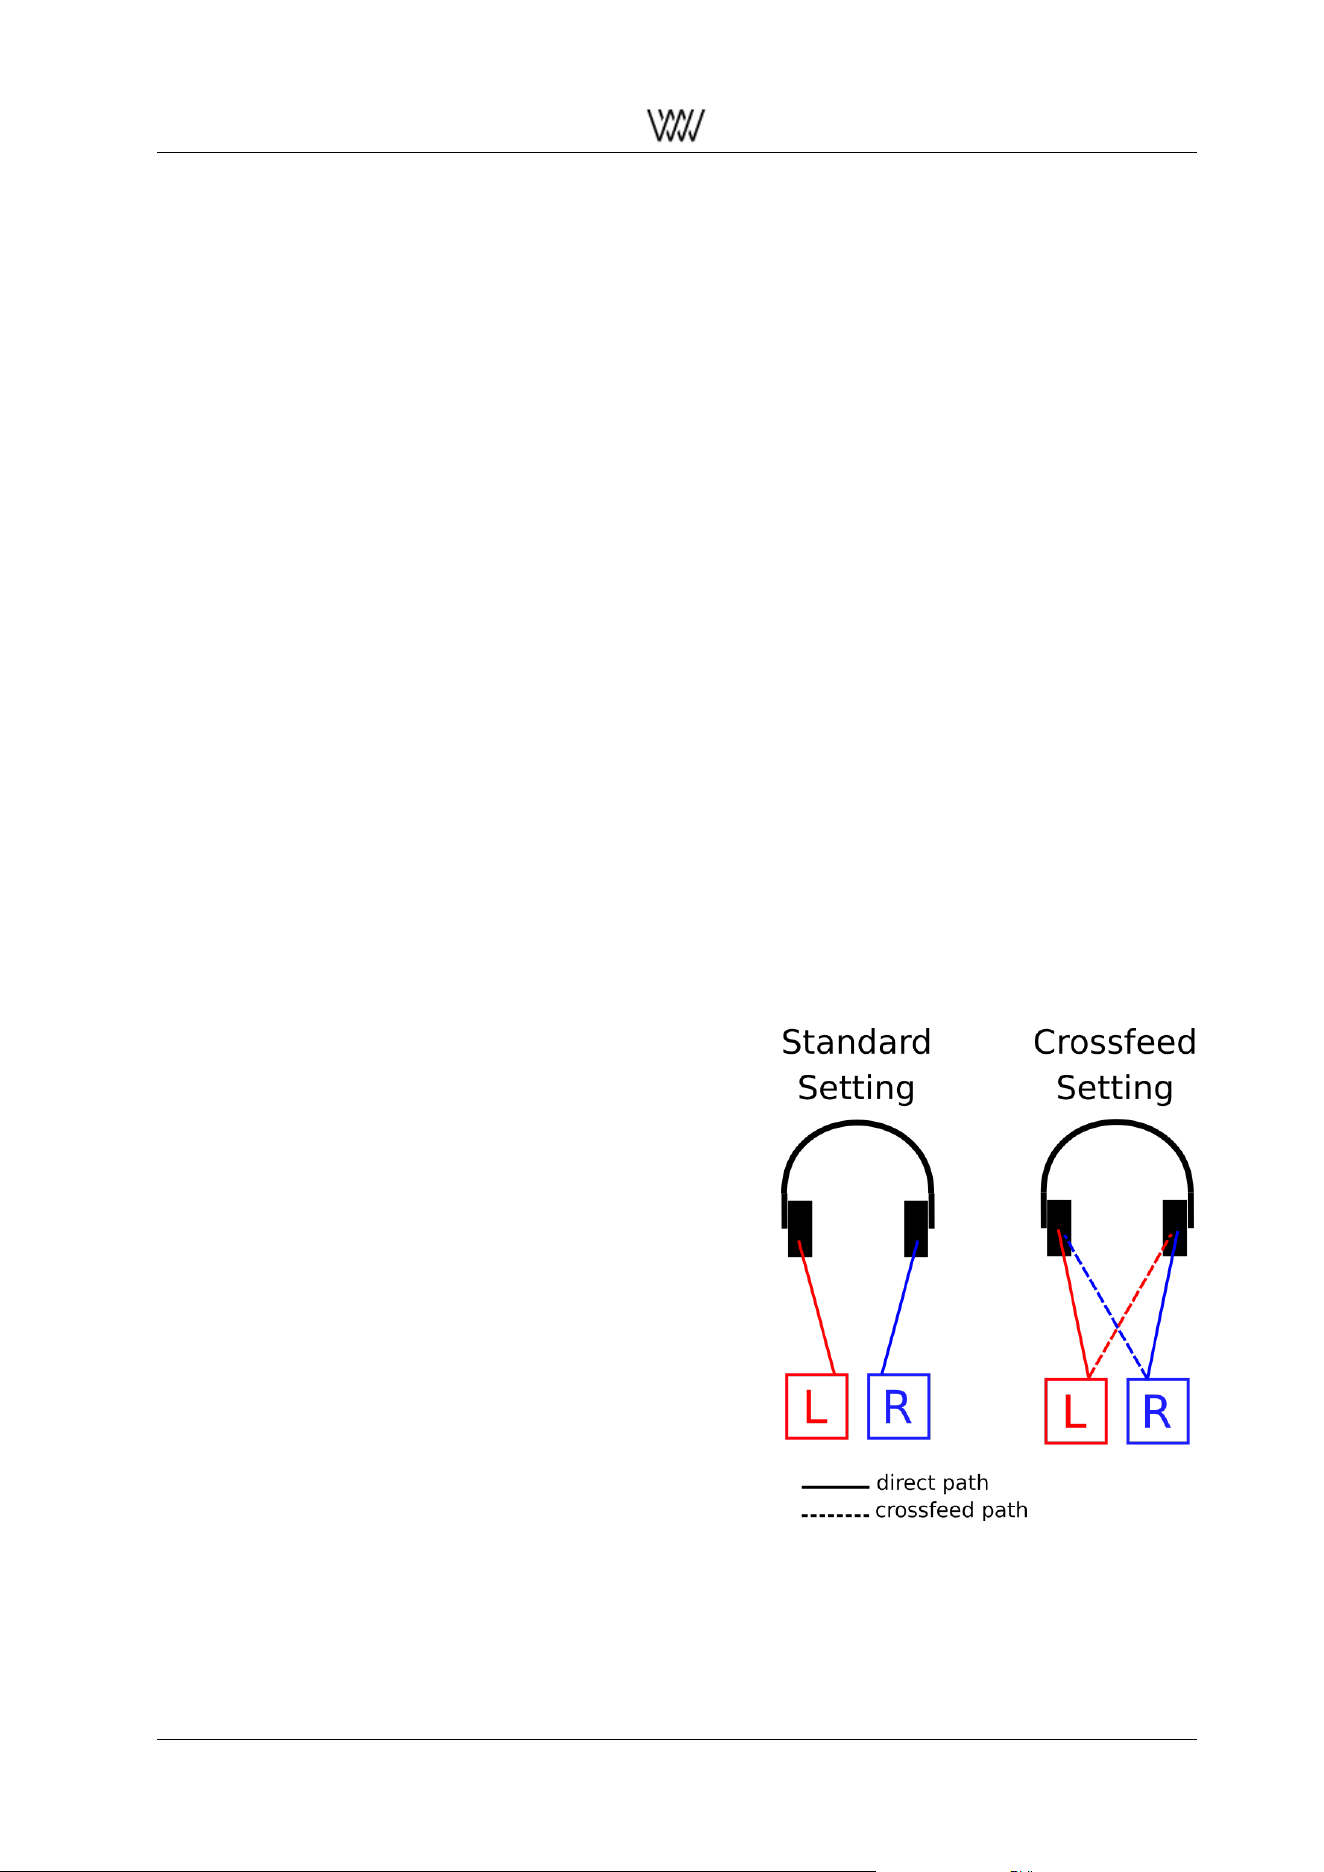
4.8 The Weiss Crossfeed Headphone Algorithm
The Weiss Crossfeed Headphone Algorithm optimizes the music for the reproduction via headphones. It
is especially useful for recordings with extreme channel separation. The figure on the right continues the
concepts of the discussion in section 4.3. In contrast to the scenario in 4.3 the usage of headphones realizes
a clean separation of the stereo channels regarding the left and right ear.
This is visualized in the figure titled with ”Standard Setting”.
To optimize audio for the reproduction via headphones this
seperation needs to be reduced. The ”Crossfeed Setting”
illustrates the main idea of the presented plugin. A certain
part of the left channel is blended into the signal directed
to the right ear and a certain part of the right channel is
added to the left one.
This additional part can be called Crossfeed path and is
drawn with a dashed line. So for each ear a summation
describes the basic idea of the algorithm:
lef t = direct
lef t
+ crossf eed
right
right = direct
right
+ crossf eed
lef t
The signals of the Crossfeed paths are processed fre-
quency dependent. It needs to be made clear that the
sound of this effect is conditional to the currently played
back audio.
The presented plugin also is equipped with a user param-
eter called Amount. With a range of 100 settings of the
Crossfeed Headphone effect the user can define its desired
sound adjustment. The higher the parameter is defined the
stronger is the impact of the plugin.
This plugin is not applicable with Output Termination set to
Speaker (2.3.2).
Figure 33: Crossfeed HP scheme
User Manual and 35 White Papers
Weiss Enginering Ltd. DAC501/DAC502
4.9 The Weiss Headphone Equalizer
The Weiss Headphone EQ also pursues the aim of a spectral compensation like the Schwede Loudness EQ
and the Room EQ. The introduced EQ plugin of this section attempts to balance the playback when using
headphones. The specific geometries and constructions of headphones can alter the reproduction of sound.
This can create loudness variations regarding certain frequencies in such a way that some frequency bands
could be emphasized and others could be dampened.
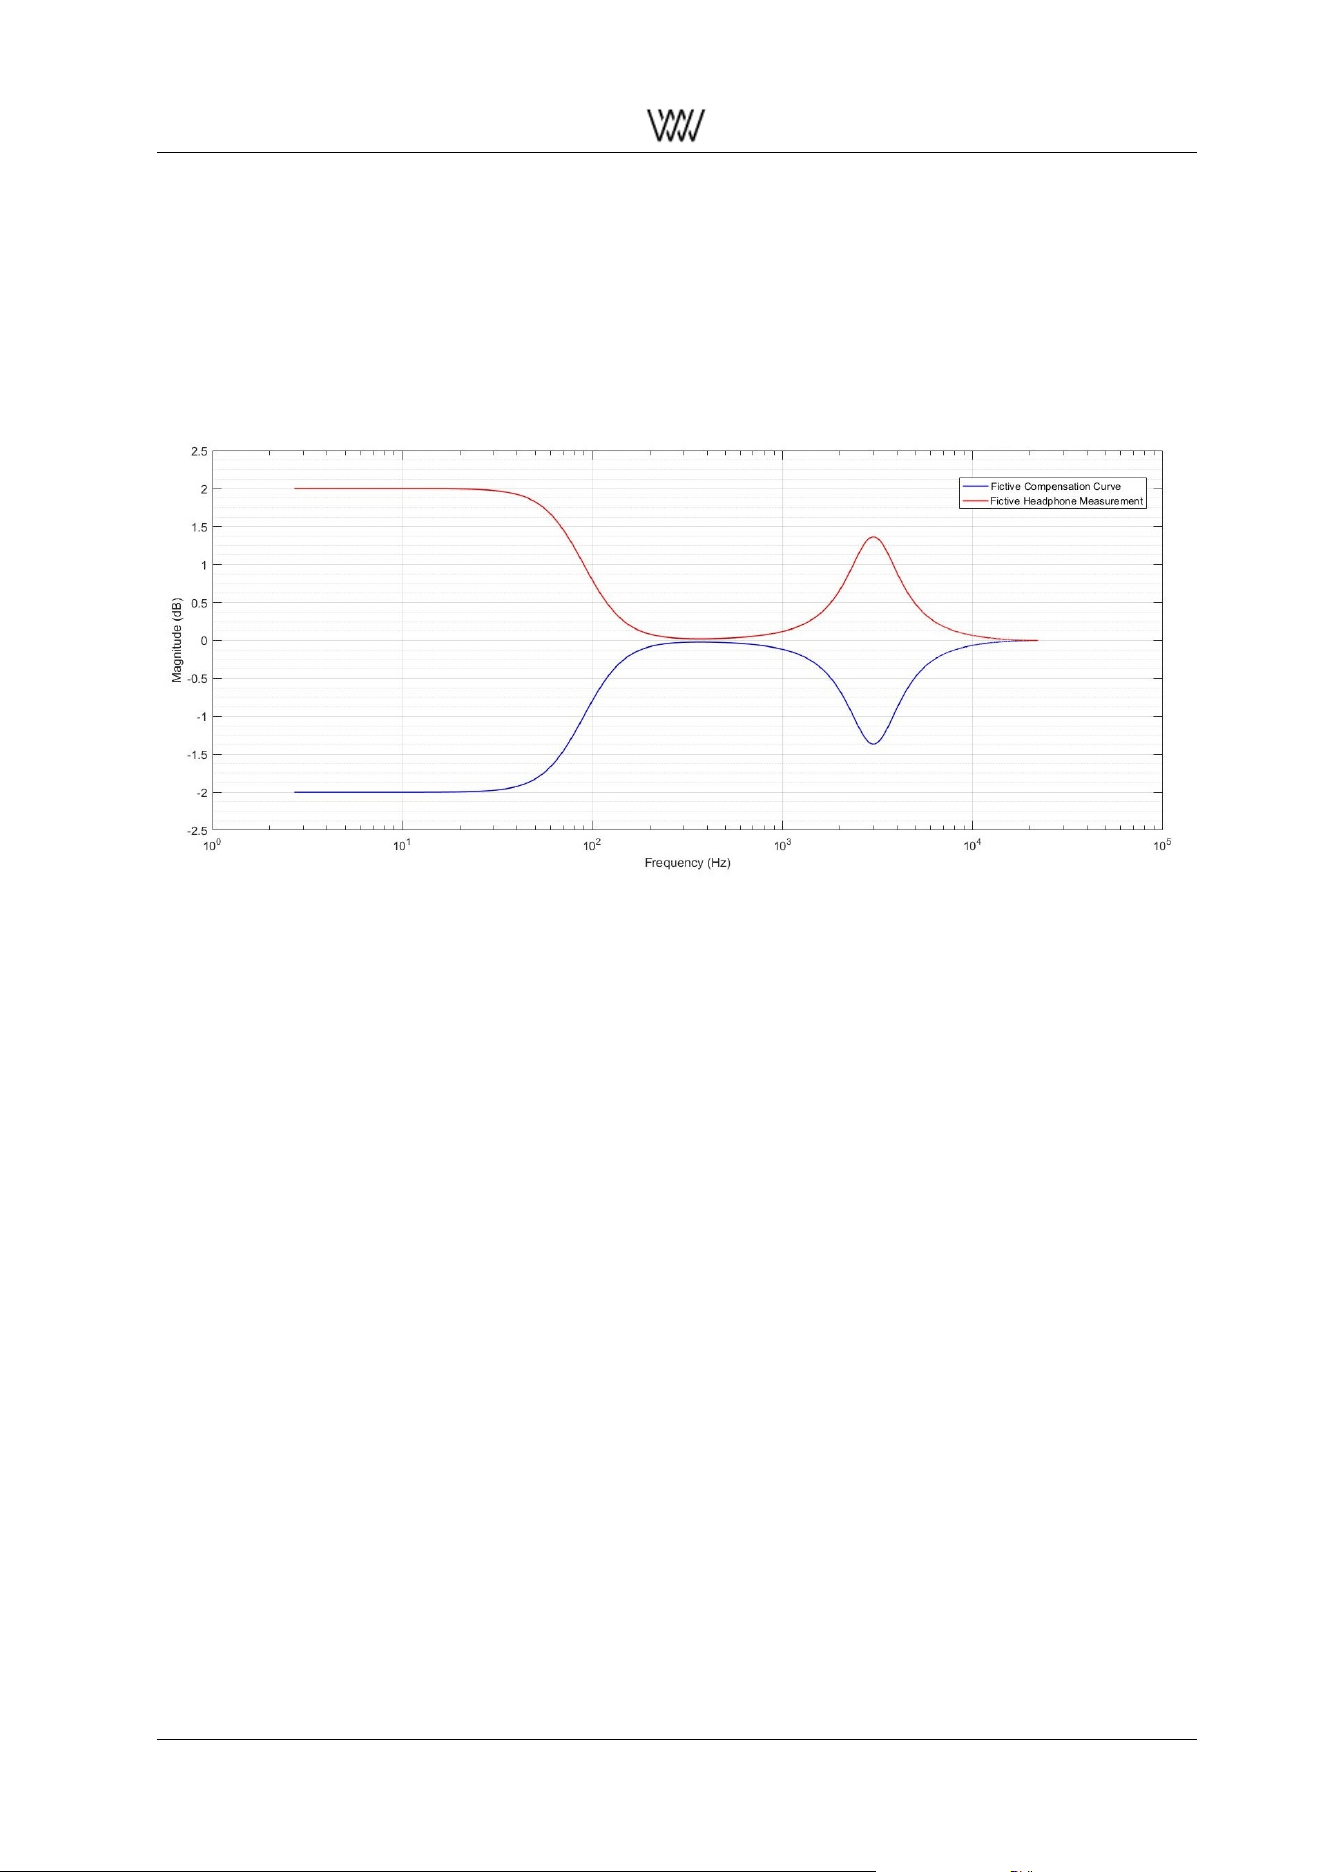
Figure 34: Fictive example of a headphone frequency response measurement (red) and its correlated com-
pensation curve (blue).
Such an imbalance can be compensated if the frequency response of the headphone is known. Measure-
ments of a headphone’s frequency response provide information about the spectral amplifying behaviour of
the system.
Based on this knowledge it is possible to design filters which are able to compensate this unauthentic be-
haviour and counterbalance the listening experience of headphones.
In figure 34 a fictive and simplified example of such a headphone frequency response measurement is plot-
ted in red. In reality such measurements are far more complex. This exemplary headphone only creates
an amplification imbalance in two frequency bands. The first one shows a damping behaviour of the low
frequencies up to around 100Hz. Another peak-like damping behaviour can be observed around 3kHz.
In order to compensate this imbalance the spectral behaviour of the headphone needs to be inverted. So
the basic idea of a compensation filter designs is to invert or, in other words, mirror the measured curve on
the 0dB axis. The resulting compensation curve is plotted in blue in figure 34.
The Weiss Headphone EQ plugin (sec. 2.3.7) offers a selection of predefined EQ settings to compensate the
properties of certain headphone models. The design of these EQ settings attempt to optimize the number
of active bands, so with a change in complexity of the headphone’s frequency response the number of EQ
bands vary.
In a first version of this plugin 19 Headphone Models by Audeze are presented as option settings. The
underlying headphone measurements of these EQ settings have been conducted and evaluated specifi-
cally by Audeze.
This plugin is not applicable with Output Termination set to Speaker (2.3.2).
User Manual and 36 White Papers

Weiss Enginering Ltd. DAC501/DAC502
4.10 The Schwede Loudness EQ
This plugin is based on the patent: ”Equalizer, audio system with such an equalizer and method for equal-
izing a sound mix” by Bernhard Schwede
1
His design describes an audio equalizer with a special concept.
In general Schwede’s algorithm aims the purpose of an aurally linearized equalization of a sound mix.
The idea is based on the psychoacoustic characteristics of the human hearing and and its anatomy. Our
auditory sensitivity is frequency dependent, which also effects the perception of loudness. This sensitiv-
ity regarding the loudness can cause an unauthentic sound experience when listening at home to audio
recordings for example of a concert hall. So Schwede’s concept tries to overcome these non linearities of
the human sense of hearing with a equalizer design which creates an optimized compensation curve based
on the psychoacoustic and anatomical theory.
1
Basically this equalization consists of seven bands with predefined parameters deduced from Schwede’s
design
1
. Ten different setting options of the EQ plugin are presented. The users select the EQ setting option
depending on the current listening level they enjoy the most with their audio equipment.
These ten options are described with dB levels. Some example comparisons shall illustrate the dB levels.
Setting 60dB could be compared with the loudness of a verbal communication, 70dB for example with a vac-
uum cleaner. 80dB can be visualized with street traffic, 90dB with a heavy truck and 100dB with a sawmill.
4.11 The Weiss M/S Control
→ to be announced
User Manual and 37 White Papers


Weiss Enginering Ltd. DAC501/DAC502
List of Figures
1 The DAC502 . . . . . . . . . . . . . . . . . . . . . . . . . . . . . . . . . . . . . . . . . . . . . 1
2 The DAC501 . . . . . . . . . . . . . . . . . . . . . . . . . . . . . . . . . . . . . . . . . . . . . 1
3 IR remote control . . . . . . . . . . . . . . . . . . . . . . . . . . . . . . . . . . . . . . . . . . . 3
4 Web interface overview . . . . . . . . . . . . . . . . . . . . . . . . . . . . . . . . . . . . . . . 4
5 De-Esser plugin . . . . . . . . . . . . . . . . . . . . . . . . . . . . . . . . . . . . . . . . . . . 5
6 Vinyl plugin . . . . . . . . . . . . . . . . . . . . . . . . . . . . . . . . . . . . . . . . . . . . . . 6
7 Equalizer plugin . . . . . . . . . . . . . . . . . . . . . . . . . . . . . . . . . . . . . . . . . . . 7
8 Room EQ plugin . . . . . . . . . . . . . . . . . . . . . . . . . . . . . . . . . . . . . . . . . . . 8
9 Headphone EQ plugin . . . . . . . . . . . . . . . . . . . . . . . . . . . . . . . . . . . . . . . . 12
10 Loudness EQ plugin . . . . . . . . . . . . . . . . . . . . . . . . . . . . . . . . . . . . . . . . . 13
11 Dynamics Adaption plugin . . . . . . . . . . . . . . . . . . . . . . . . . . . . . . . . . . . . . . 13
12 XTC plugin . . . . . . . . . . . . . . . . . . . . . . . . . . . . . . . . . . . . . . . . . . . . . . 14
13 Crossfeed HP plugin . . . . . . . . . . . . . . . . . . . . . . . . . . . . . . . . . . . . . . . . . 15
14 Snapshots maintenance . . . . . . . . . . . . . . . . . . . . . . . . . . . . . . . . . . . . . . . 16
15 Saving a new snapshot . . . . . . . . . . . . . . . . . . . . . . . . . . . . . . . . . . . . . . . 17
16 Global Preset composer matrix . . . . . . . . . . . . . . . . . . . . . . . . . . . . . . . . . . . 17
17 Firmware update . . . . . . . . . . . . . . . . . . . . . . . . . . . . . . . . . . . . . . . . . . . 18
18 Engineering drawings of the DAC501, DAC502 and the IR remote control . . . . . . . . . . . 19
19 EQ peak and notch filters . . . . . . . . . . . . . . . . . . . . . . . . . . . . . . . . . . . . . . 24
20 Low shelf and high shelf filter . . . . . . . . . . . . . . . . . . . . . . . . . . . . . . . . . . . . 24
21 Low pass and high pass filter scheme . . . . . . . . . . . . . . . . . . . . . . . . . . . . . . . 25
22 Instruments’ spectral treatment overview . . . . . . . . . . . . . . . . . . . . . . . . . . . . . . 25
23 Dummy head microphone . . . . . . . . . . . . . . . . . . . . . . . . . . . . . . . . . . . . . . 26
24 XTC scheme . . . . . . . . . . . . . . . . . . . . . . . . . . . . . . . . . . . . . . . . . . . . . 27
25 Block diagramm of the Weiss Vinyl Emulator . . . . . . . . . . . . . . . . . . . . . . . . . . . 28
26 Image processing: original (left), quantized without dithering (middle), quantized with dither-
ing (right) . . . . . . . . . . . . . . . . . . . . . . . . . . . . . . . . . . . . . . . . . . . . . . . 30
27 Block diagram of the Weiss Loudness Normalization . . . . . . . . . . . . . . . . . . . . . . . 31
28 Visualization of relation between dynamic level and normalization level . . . . . . . . . . . . . 31
29 Comparing different settings of the Dynamic Level, (Pink Floyd, Wish You Were Here, live) . 32
30 Block diagramm of the Weiss De-Esser plugin . . . . . . . . . . . . . . . . . . . . . . . . . . 33
31 Comparing different settings of the De-Esser user parameter: a) original; b) Amount -12 dB. . 33
32 Comparing different settings of the De-Esser user parameter: c) Amount 0 dB; b) Amount 9 dB. 34
33 Crossfeed HP scheme . . . . . . . . . . . . . . . . . . . . . . . . . . . . . . . . . . . . . . . . 35
34 Fictive example of a headphone frequency response measurement (red) and its correlated
compensation curve (blue). . . . . . . . . . . . . . . . . . . . . . . . . . . . . . . . . . . . . . 36
User Manual and 39 White Papers
